M/M/m QUEUE WITH BALKING, RENEGING AND
ADDITIONAL SERVERS
Madhu Jain and Poonam Singh
School of Mathematical Sciences, Institute of Basic Sciences Khandari, Agra, 282002, India, [email protected]
(Received: January 23, 2001 – Accepted in Revised form: October 24, 2001)
Abstract In this paper, we consider a multi-server queuing system in which additional servers are allowed for a longer queue to reduce the customer’s balking and reneging behavior. The customers are assumed to arrive in Poisson fashion and their service- times follow exponential distribution. The number of servers in long run depends on the queue-length. We obtain equilibrium queue size distribution. The expression for expected number of customers in the system in the long run has been obtained. Some other performance measures have also been provided. In order to match our results with earlier work, special cases are discussed. The numerical results are presented to verify the validity of the proposed analytical method
Key Words Queue, Multi-Server, Additional Servers, Balking, Reneging, Expected Queue Size
ﻩﺪﻴﻜﭼ
ﻪﻟﺎﻧﺎﻛ ﺪﻨﭼﻒﺻﻢﺘﺴﻴﺳﻚﻳﻪﻟﺎﻘﻣﻦﻳﺍﺭﺩ
ﻲﻣﺮﻈﻧﺭﺩﺍﺭ
ﻩﺪﻨﻫﺩﺲﻳﻭﺮﺳﺩﺍﺪﻌﺗﻢﻳﺯﺎﺠﻣﻥﺁﺭﺩﻪﻛﻢﻳﺮﻴﮔ
ﺑﻱﺮﺘﺸﻣﻪﻳﻼﮔﺯﺍﺎﺗﻢﻴﻨﻛﺩﺎﻳﺯﺍﺭ ﻢﻴﻫﺎﻜ
.
ﺮﺑﺽﺮﻓ ﻦﻳﺍ
ﻲﻣﺩﺭﺍﻭﻥﻮﺳﺍﻮﭘﻊﻳﺯﻮﺗﺱﺎﺳﺍﺮﺑﻥﺎﻳﺮﺘﺸﻣﻪﻛﺖﺳﺍ
ﻭﺪﻧﻮﺷ
ﺖﺳﺍ ﻲﻳﺎﻤﻧﻊﻳﺭﻮﺗﻱﺍﺭﺍﺩﻢﻫﺎﻬﻧﺁ ﻲﻫﺩﺲﻳﻭﺮﺳﻥﺎﻣﺯ
. ﻝﻮﻃﻪﺑﻲﮕﺘﺴﺑﺕﺪﻣﺯﺍﺭﺩﺭﺩﻥﺎﮔﺪﻨﻫﺩ ﺲﻳﻭﺮﺳﺩﺍﺪﻌﺗ
ﺩﺭﺍﺩﻒﺻ
.
ﻲﻣﻪﺒﺳﺎﺤﻣ ﺍﺭﺭﺍﺪﻳﺎﭘﻒﺻﻝﻮﻃﻊﻳﺯﻮﺗﻖﻴﻘﺤﺗﻦﻳﺍﺭﺩﺎﻣ ﻢﻴﻨﻛ
.
ﺭﺩﻱﺮﺘﺸﻣﺩﺍﺪﻌﺗﻦﻴﮕﻧﺎﻴﻣﻱﺍﺮﺑﻲﺗﺭﺎﺒﻋ
ﻲﻣﺖﺳﺪﺑﺭﺍﺪﻳﺎﭘﺖﻟﺎﺣ ﺭﺩﺍﺭﻢﺘﺴﻴﺳ ﻢﻳﺭﻭﺁ
.
ﻲﻣﻒﻳﺮﻌﺗﺰﻴﻧ ﻢﺘﺴﻴﺳﺩﺮﻜﻠﻤﻋ ﺭﺎﻴﻌﻣﺪﻨﭼ ﻢﻴﻨﻛ
. ﻪﺴﻳﺎﻘﻣﺭﻮﻈﻨﻣﻪﺑ
ﻲﻣﺭﺍﺮﻗﻲﺳﺭﺮﺑﺩﺭﻮﻣﻢﻫﺍﺭﺹﺎﺧﺖﻟﺎﺣﺪﻨﭼ،ﻩﺪﺷﻡﺎﺠﻧﺍﻱﺎﻫﺭﺎﻛﺎﺑﺎﻣﺭﺎﻛﺞﻳﺎﺘﻧ ﻢﻴﻫﺩ
.
1. INTRODUCTION
In many real life situations, the arriving customers may be discouraged due to long queue, and decide not to join the queue and leave the system at once. This behavior of customers is referred as ‘balking’. Sometimes customers get impatient after joining the queue and leave the system without getting service. This behavior of customer recognizes as ‘reneging’. The early valuable works on balking and reneging are due to Palm [1], Haight [2], Finch [3], Cox [4], Anker and Gaferian [5]. Reynolds [6] gave the stationary solution of a multi-server model with discouragement. For later advances, we can refer the following research papers and references therein. Varshney et al. [7] proposed a multi-server queuing model with balking and reneging by using diffusion approximation method. Garg et al. [8] designed G/Gy/m queuing system
with discouragement by using diffusion approximation method. Jain and Singh [9] developed a finite capacity priority queue with
discouragement. Ke and Wang [10] evaluated cost analysis of the M/M/R machine repair problem with balking, reneging and server breakdowns. Jain and Dhayani [11] proposed a state dependent bulk service queue with balking. Shawky [12] analyzed the M/M/C/K/N queuing model with balking, reneging and spares.
developed single server Markovian overflow queue with balking, reneging and an additional server for longer queues. Shawky [17] suggested single server machine interference model with balking, reneging and an additional server for longer queues. Jain [18] analyzed M/M/R machine repair problem with spares by using additional repairman. Jain [19] considered M/M/m queue with discouragement and additional servers. Jain and Vaidya [20] discussed finite M/M/m/K queue with discouragement and additional servers.
In this study, we analyze multi-server Markovian queue with balking, reneging and having the provision of additional servers in case of long queue. The paper is organized as follows: In Section 2, we describe queuing model with balking, reneging and additional servers and obtain queue size distribution in different cases. Section 3 provides some other performance measures by using queue size distribution. In Section 4, we outline some special cases which tally with earlier existing models. Section 5 facilitates numerical results to validate the proposed analytical method. In last Section 6, conclusion and further scope of the work are stated.
2. THE MATHEMATICAL MODEL AND ANALYSIS
We consider M/M/m queue with additional servers and discouragement. The customers arrive according to Poisson process with mean arrival rate λ, balking parameter β and reneging parameter
α; m permanent and r additional servers serve the customers exponentially. The service-discipline is first come-first served. The number of additional servers available for service depends upon the number of customers present in the system in the following manner:
• When number of customers present in the system is less than or equal to threshold value N and at least one server is free, there are m permanent servers available. The service rate of the permanent servers is µ0 (µ) if there is at least one
server is free (all servers are busy).
• When number of customers is greater than N
and less than or equal to 2N, then an additional server is provided for service with rate µ1.
Continuing this, in general, when the number of customers is greater than jN and less than or equal to (j+1)N, j additional servers are added to the system to provide service with rate µj (j = 1, 2, ….,
r-1). Thus, with the increase of N customers in the queue, one more additional server is added.
• When the number of customers becomes rN, then all r additional servers are added to the system for providing service.
• jth (j = 1, 2, …., r-1) additional server is removed as soon as the number of customers in the system drops to (jN-1).
The arrival and departure rates are given as follows:
≥ λ
+ +
+ ≤ < λ
+ +
≤ < λ
+
≤ ≤ λ
= λ
β β β
rN r ; 1 n
r m
N ) 1 j ( n jN ; 1 n
j m
N n m ; 1 n
m
m n 0 ;
n (1)
and
≥ +
− + +
+ ≤ < +
− + +
≤ < −
+
≤ ≤
=
∑
∑
= = r
i i
j
i i n
rN n r
m n m
N j n jN j
m n m
N n m m
n m
m n n
1 1 0
; } ) (
{
) 1 ( ;
} ) (
{
; )
(
1 ;
α µ
µ
α µ
µ
α µ
µ
µ
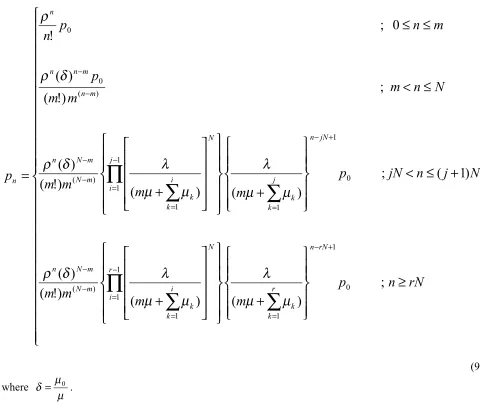
(2) We employ product type solution for
discouragement queue to obtain the steady-state queue size distribution.
The probability Pn can be calculated by using
(Saaty (1961)).
0 1 0 1
p
p
nj j j n
∏
−
= +
=
µ
λ
(3)
where = = µ λ
ρ traffic intensity
By using normalizing condition
∑
∞= = 0 , 1 n n
p we
can get the value of p0
3. SOME PERFORMANCE MEASURES
We can obtain expected number of customers in long run with r additional servers by using queue size distribution as follows (Equation 5):
≥
+
+
−
+
+
+
+
−
+
+
+
+
≤
<
+
+
−
+
+
+
+
−
+
+
+
≤
<
+
≤
≤
=
+ − + = = − = + + = = − = − − − + − + = = − = + + = = − = − − − − = − − −∏
∑
∏
∏
∑
∏
∏
∑
∏
∏
∑
∏
∏
rN
n
p
r
m
q
m
r
m
i
m
q
m
i
m
k
m
n
m
m
N
j
n
jN
p
i
m
q
m
j
m
i
m
q
m
i
m
k
m
n
m
m
N
n
m
k
m
n
m
p
m
m
n
p
n
p
rN n n rN q r k k r i N N i iN q i k k m N k m N m N n jN n n jN q j k k j i N N i iN q i k k m N k m N m N n m n k m n m n n n n;
)
(
)
(
)
(
.
)
(
)
(
)
(
)
(
)
!
(
)
!
(
)
(
)
1
(
;
)
(
)
(
)
(
.
)
(
)
(
)
(
)
(
)
!
(
)
!
(
)
(
;
)
(
)
!
(
)
!
(
)
(
1
;
!
0 1 1 1 1 1 ( 1)1 1 1 1 0 0 1 1 1 1
1 ( 1)
+ + − + + + + − + + + + + + + − + + + + − + + + + + + + − = + − ∞ = + = = − = + + = = − = − − − + − + = = + = − = + + = = − = − − − = = + − = − − −
∑
∏
∑
∏
∏
∑
∏
∏
∑
∑
∏
∏
∑
∏
∑
∑
∏
1 1 1 11 ( 1)
1 1 1 1 0 1 1 1 ) 1 ( 1
1 ( 1)
1 1 1 1 0 0 1 1 0 1 0 ) ( ) ( ) ( . ) ( ) ( ) ( ) ! ( ) ( ) ! ( ) ( ) ( ) ( ) ( ) ( . ) ( ) ( ) ( ) ! ( ) ( ) ( ) ! ( ) ( ) ( ) ! ( ) ( ) ! ( 1 )! 1 ( ) ( rN n rN n n rN q r k k r i N N i iN q i k k m N k m N m N n jN n n jN q j k k N j jN n j i N N i iN q i k k m N k m N m N n m n N m
n n m
k m n m n n n r m q m r m i m q m i m n k m m r m m i m q m j m i m q m i m n j m k m m m k m n m m n p Q E α µ µ λ α µ µ λ α µ µ ρ α µ µ λ α µ µ λ α µ µ ρ α µ µ ρ ρ β β β β β β β β β β β β β (5) The probability that there are grater than jN and less than or equal to (j+1)N customers in long run is
Probability {jN<Q≤≤≤≤(j+1)N} =
1
,...,
2
,
1
;
)
(
)
(
)
(
.
)
(
)
(
)
(
)
(
)
!
(
)
!
(
)
(
1 1 1 ) 1 ( 11 ( 1)
The probability that all additional servers are busy is given by
Probability {Q
≥≥≥≥
rN} =
∑
∏
∑
∏
∏
∑
∏
∞ = + − + = = − = + + = = − = − − −
+
+
−
+
+
+
+
−
+
+
+
rN n rN n n rN q r k k r i N N i iN q i k k m N k m N m N nr
m
q
m
r
m
i
m
q
m
i
m
k
m
n
m
p
m
1 1 1 11 ( 1)
1 1 1 1 0 0
)
(
)
(
)
(
.
)
(
)
(
)
(
)
(
)
!
(
)
!
(
)
(
α
µ
µ
λ
α
µ
µ
λ
α
µ
µ
ρ
β β β β β (7)4. SPECIAL CASES
Now we shall discuss some cases by setting appropriate parameters as follows:
Case 1. When there is no reneging, i.e. α=0, then queue size distribution Pn reduces to
which tally with standard result given in the Hillier and Liberman [21].
Case 4.
When α=0, β=0 and r=0 then model converts to classical M/M/m/∞ model.5. NUMERICAL RESULTS:
Table 1 depicts the probability (pn) for different
values of permanent servers and reneging parameter. Table 2 presents the expected number Equation 8 coincides with the result obtained by Jain [18].
Case 2. When α = 0 and β = 0 i.e. for model with additional servers and without discouragement, Equation 4 reduces to
≥
+
+
+
≤
<
+
+
≤
<
≤
≤
=
+ −
= −
=
= −
−
+ −
= −
=
= −
− − −
∑
∏
∑
∑
∏
∑
rN
n
p
m
m
m
m
N
j
n
jN
p
m
m
m
m
N
n
m
m
m
p
m
n
p
n
p
rN n
r
k k r
i
N
i
k k m
N m N n
jN n
j
k k j
i
N
i
k k m
N m N n
m n
m n n n
n
;
)
(
)
(
)
!
(
)
(
)
1
(
;
)
(
)
(
)
!
(
)
(
;
)
!
(
)
(
0
;
!
0 1
1 1
1
1 )
(
0 1
1 1
1
1 )
( ) (
0 0
µ
µ
λ
µ
µ
λ
δ
ρ
µ
µ
λ
µ
µ
λ
δ
ρ
δ
ρ
ρ
(9) where
µ µ δ = 0 .
Case 3. When α=0 and r = 0, i.e. when no additional server is provided for service and there is no reneging, we get expected number of customers as
+
−
=
∑
−∑
=
∞
= − − −
1
0 1 ( )(1 )
0
)
!
(
)
!
(
)!
1
(
)
(
m
n n m n m
n n
n
m
m
m
n
p
Q
of customers E{Q} for various values of λ, α and m. We observe that E{Q} increases with mean arrival rate (λ) whereas it decreases as reneging parameter (α) and the number of permanent servers (m) increase.
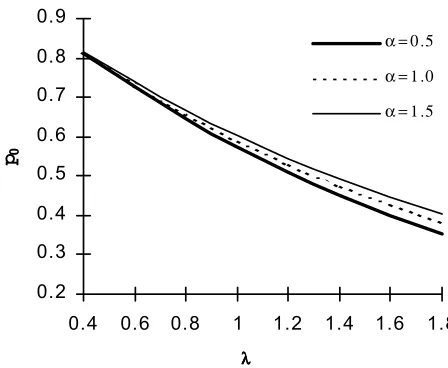
Figures 1-3 demonstrate the probability (p0) of
the system being empty vs. mean arrival rate (λ) for different values of reneging parameter (α), balking parameter (β) and number of permanent servers (m) respectively. We note that there is decrease in probability (p0) with mean arrival rate
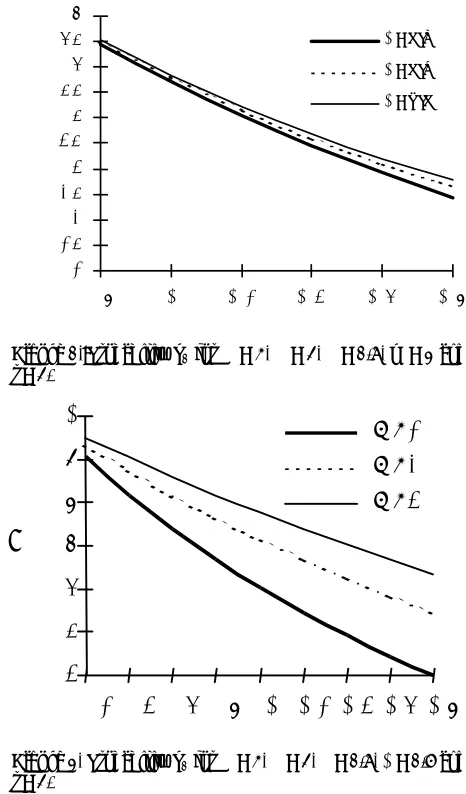
(λ). It increases with reneging parameter (α), balking parameter (β) and number of permanent servers (m). Figures 4-6 reveal the increasing trend in expected number of customers E{Q} with mean arrival rate(λ) whereas E{Q} decreases by
TAB LE 1. Probability p0 for N=3 , µ = 2 , α = 0 . 6 , β = 0 . 5 and r = 2 .
pn
m = 1 m = 2
N
α=0.5 α=0.5 α=0.5
α=0.5 α=1.0α=1.0α=1.0α=1.0 α=1.5α=1.5 α=1.5α=1.5 α=0.5 α=0.5α=0.5α=0.5 α=1.0α=1.0α=1.0α=1.0 α=1.5α=1.5 α=1.5α=1.5
0 0.59067 0.61055 0.62204 0.60500 0.60684 0.60812 1 0.29533 0.30527 0.31102 0.30250 0.30342 0.30406 2 0.09844 0.07631 0.06220 0.07562 0.07586 0.07601 3 0.01421 0.00734 0.00448 0.01512 0.01264 0.01085 4 0.00123 0.00047 0.00022 0.00157 0.00115 0.00087 5 0.00011 0.00003 0.00001 0.00015 0.00009 0.00005 6 0.00001 0.00000 0.00000 0.00001 0.00001 0.00000 7 0.00000 0.00000 0.00000 0.00000 0.00000 0.00000 8 0.00000 0.00000 0.00000 0.00000 0.00000 0.00000
sum 1.00000 1.00000 1.00000 1.00000 1.00000 1.00000
TAB LE 2 . Ex pected Number of Customers E{ Q } for N=3 ,µ = 2 , α = 0 . 6 , β = 0 . 5 and r = 2 .
E{Q}
m = 1 m = 2
λλλλ
α=0.5 α=0.5 α=0.5
α=0.5 α=1.0α=1.0α=1.0α=1.0 α=1.5α=1.5α=1.5α=1.5 α=0.5 α=0.5α=0.5α=0.5 α=1.0α=1.0α=1.0α=1.0 α=1.5α=1.5α=1.5α=1.5
0.2 0.1055 0.1030 0.1011 0.1001 0.1001 0.1001
0.4 0.2202 0.2102 0.2034 0.2011 0.2006 0.2002
0.6 0.3412 0.3198 0.3057 0.3032 0.3018 0.3006
0.8 0.4662 0.4303 0.4068 0.4067 0.4037 0.4012
1 0.5931 0.5403 0.5061 0.5117 0.5062 0.5017
1.2 0.7203 0.6490 0.6032 0.6180 0.6092 0.6021
1.4 0.8465 0.7558 0.6978 0.7255 0.7125 0.7022
1.6 0.9710 0.8602 0.7898 0.8340 0.8160 0.8017
1.8 1.0931 0.9622 0.8790 0.9431 0.9194 0.9007
0.2 0.3 0.4 0.5 0.6 0.7 0.8 0.9
0.4 0.6 0.8 1 1.2 1.4 1.6 1.8
λλλλ
p0
α = 0.5 α = 1.0 α = 1.5
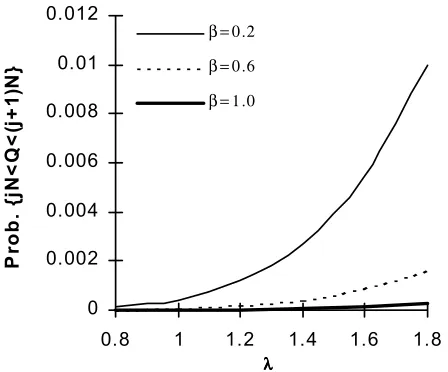
providing more permanent servers. Figures 7-11 display the effect of mean arrival rate (λ) on prob.
{jN<Q
≤
(j+1)N} and Prob. {Q>rN} with the variation of α, β and m respectively. It is observed that the both probabilities increase considerably with mean arrival rate (λ).Overall, we conclude that by providing more servers, the number of waiting customers in the system decreases. Thus, the system designer can facilitate better service to the customers by implementing more permanent and additional servers.
6. DISCUSSION
We have studied M/M/m queue with discouragement
0 .2 0 .2 5 0 .3 0 .3 5 0 .4
P0 0 .4 5
0 .5 0 .5 5 0 .6 0 .6 5 0 .7
0 .8 1 1 .2 1 .4 1 .6 1 . 8
λλλλ
β = 0 .2 β = 0 .6 β = 1 .0
Figure 2.:Probability p0 for N = 3, µ = 2, α = 0.6, m = 1 and r = 2.
0.4 0.5 0.6 0.7 0.8 0.9 1
0.2 0.4 0.6 0.8 1 1.2 1.4 1.6 1.8 λλλλ
p 0
m=2 m=3 m=4
Figure 3. Probability p0 for N = 3, µ = 2, α = 0.6, β = 0.5 and r = 2.
0 .2 0 .3 0 .4 0 .5 0 .6 0 .7 0 .8 0 .9 1 1 .1 1 .2
0 .4 0 .6 0 .8 1 1 .2 1 .4 1 .6 1 .8
λλλλ
E{
Q
}
α = 0 .5
α = 1 .0
α = 1 .5
Figure 4. Expected number of customers E{Q} for N=3, µ =2,
β = 0.5, µ = 1 and r = 2.
0 .0 0 8 0 .0 2 8 0 .0 4 8 0 .0 6 8 0 .0 8 8 0 .1 0 8 0 .1 2 8 0 .1 4 8 0 .1 6 8 0 .1 8 8
0 .8 1 1 .2 1 .4 1 .6 1 .8
λλλλ
E{
Q
}
β = 0 .2
β = 0 .6
β = 1 .0
Figure 5. Expected number of customers E{Q} for N = 3,
µ = 2, α = 0.6, m = 1 and r = 2.
0 0.1 0.2 0.3 0.4 0.5 0.6 0.7 0.8 0.9 1
0.2 0.4 0.6 0.8 1 1.2 1.4 1.6 1.8
λλλλ
E{
Q
}
m = 2 m = 3 m = 4
Figure 6. Expected number of customers E{Q} for N = 3,
and having the provision of additional servers for long queue. This type of model can be realized in the situations where the customers get impatient due to long queue and depart from the system, which causes loss to the system, and also inconvenience to the customers. The provision of additional servers may be helpful in reducing the balking behavior of the customers. Some other notable features incorporated in our model are as follows:
• The service rate of permanent servers when all servers are busy is different from the situation when at least one server is idle. This is a common phenomenon as server may provide service with faster rate to reduce balking when all servers are busy.
• The reneging behavior of the customers is included which makes our model mere closer to real life situation.
• The service rate of removable additional servers is different from that of permanent servers as being special servers.
0 0.01 0.02 0.03 0.04 0.05 0.06 0.07 0.08 0.09
0.6 0.8 1 1.2 1.4 1.6 1.8
λλλλ
P
ro
b
. {
jN
<
Q
<
(j
+
1
)N
} α = 0.5
α = 1.0
α = 1.5
Figure 7. Prob. {jN<Q<(j+1)N} for N = 3, µ = 2, α = 0.6,
β = 0.5 and r = 2.
0 0.002 0.004 0.006 0.008 0.01 0.012
0.8 1 1.2 1.4 1.6 1.8
λλλλ
P
ro
b
. {
jN
<
Q
<
(j
+
1
)N
}
β = 0.2 β = 0.6 β = 1.0
Figure 8. Prob. {jN<Q<(j+1)N} for N = 3, µ = 2, α = 0.6, m = 1 and r = 2.
0 0.01 0.02 0.03 0.04 0.05 0.06 0.07
0.6 0.8 1 1.2 1.4 1.6 1.8
λλλλ
P
ro
b
. {
jN
<
Q
<
(j
+
1
)N
} m=2
m=3 m=4
Figure 9. Prob. {jN<Q<(j+1)N} for N = 3, µ = 2, α = 0.6,
β = 0.5 and r = 2.
0 0 . 0 0 0 5 0 . 0 0 1 0 . 0 0 1 5 0 . 0 0 2 0 . 0 0 2 5 0 . 0 0 3 0 . 0 0 3 5
0 . 8 1 1 . 2 1 . 4 1 . 6 1 . 8
λλλλ
P
rob.
{
Q
>
rN
α = 0 .5 α = 1 .0 α = 1 .5
The customers may arrive in batches at service centers so that the incorporation of batch input will make our model more versatile. Our future work will include the batch input.
7. ACKNOWLEDGEMENTS
The authors are thankful to University Grant Commission for providing financial support vide project no. 8-5/98 (SR-I). The authors would also like to thank chief editor and referees for their critical suggestions and comments for the improvement of the paper.
8. REFERENCES
1. Palm, C., “Some Investigations into Waiting Times in Telephone Plants”, Tek. Medd. Fran Kung. Teleg., Vol. 3, No. 7-9, (1937), 113-117.
2. Haight, F. A., “Queuing with Reneging”, Metrika, Vol. 2, No. 3, (1959), 186-197.
3. Finch, “Balking in the Queuing System GI/M/1”, Acta Math. Acad. Su. Hung., Vol. 10, No. 1, (1959), 241-247. 4. Cox, D. R. and Miller, H. D., “The Theory of Stochastic
Processes”, John Wiley, New York, (1963).
5. Anker and Gaferian, “Some Queuing Problems with Balking and Reneging”, Oper. Res., Vol. 11, No. 2,
(1963), 88-100.
6. Reynolds, J. F., “The Stationary Solution of a Multi-Server Model with Discouragement”, Oper. Res., Vol. 16, (1968), 64-71.
7. Varshney, K., Jain, M. and Sharma, G. C., “A Multi-server Queuing Model with Balking and Reneging via Diffusion Approximation”, J. Phy. Nat. Sci., Vol. 10, No. 2, (1989), 10-15.
8. Garg, K. M., Jain, M. and Sharma, G. C., “G/Gy/m Queueing System with Discouragement via Diffusion Approximation”, Microelectron. Reliab., Vol. 33, No. 7, (1993), 1057-1059.
9. Jain, M. and Singh, C. J., “A Finite Capacity Priority Queue with Discouragement”, International Journal of Engineering, Vol. 11, Nos. 1-2, (1998), 31-37.
10. Ke. J. C. and Wang, K. H., “Cost Analysis of the M/M/R Machine Repair Problem with Balking, Reneging and Server Breakdowns”, J. Oper. Res. Soci., Vol. 50, (1999), 275-282.
11. Jain, M. and Dhayani, I., “A State Dependent Bulk Service Queue with Balking”, OPSEARCH, Vol. 36, No. 1, (1999), 70.
12. Shawky, A. I., “The Machine Interference Model: M/M/C/K/N with Balking, Reneging and Spares”, Oper. Res., Vol. 37, No. 1, (2000), 25-35.
13. Makaddis, G. S. and Zaki, S. Si., “The Problem of Queuing System M/M/1 with Additional Servers for a Longer Queue”, Indian J. Pure Appl. Maths., Vol. 14, No. 4, (1983), 83-90.
14. Murari, K., “An Additional Special Channel, Limited Space Queuing Problem with Service in Batches of Variable Size”, Oper. Res., Vol. 16, No. 1, (1986),. 83-90. 15. Varshney, K., Jain, M. and Sharma, G. C., “The M/M/m/K Queuing System with Additional Servers for a Long Queue”, Proc. of Seminar 65th Birthday Celebration of
Dr. P. C. Das Gupta, Calcutta, (1988), 277-282.
16. Abou-El-Alta, M. O. and Shawky, A. I., “The Single Server Markovian Overflow Queue with Balking, Reneging and an Additional Server for Longer Queues”,
Microelectron. Reliab., Vol. 32, (1992), 1389-1394. 17. Shawky, A. I., “The Single Server Machine Interference
Model with Balking, Reneging and an Additional Server for Longer Queues”, Microelectron. Reliab., Vol. 37, (1997), 355-357.
18. Jain, M., “M/M/R Machine Repair Problem with Spares and Additional Repairman”, Indian J. Pure Appl. Math., Vol. 29, No. 5, (1998), 517-525.
19. Jain, M., “M/M/m Queue with Discouragement and Additional Servers”, J. of GSR, Vol. 36, Nos. 1-2, (1998), 31-42.
20. Jain, M. and Vaidya, V., “Finite M/M/m/K Queue with Discouragement and Additional Servers”, Oper. Res., Vol. 36, No. 1, (1999), 73.
21. Hiller, F. S. and Liberman, G. J., “Operation Research”, Holden-Day Inc., San-Francisco, (1992).
0 0 .0 0 0 5 0 .0 0 1 0 .0 0 1 5 0 .0 0 2 0 .0 0 2 5 0 .0 0 3
0 .8 1 1 .2 1 .4 1 .6 1 .8
λλλλ
Pr
o
b
. {
Q
>
rN
m = 2 m = 3
m = 4