DOI: 10.22075/JRCE.2018.12200.1209
journal homepage: http://civiljournal.semnan.ac.ir/
Estimating Inter-Story Drift in High Rise Buildings
with the Flexural and Shear Cantilever Beam and
Mode-Acceleration Method
M. A. Ranaiefar1, M. H. Hosseini2* and M. R. Mansoori3
1. M.Sc. of Earthquake Engineering, Department of Structure, Earthquake, Geotechnical Engineering, Science and Research Branch, Islamic Azad University, Tehran, Iran.
2. Assistant professor, Department of Structure, Earthquake, Geotechnical Engineering, Science and Research Branch, Islamic Azad University, Tehran, Iran.
3. Assistant professor, Department of Structure, Earthquake, Geotechnical Engineering, Science and Research Branch, Islamic Azad University, Tehran, Iran.
Corresponding author: [email protected]
ARTICLE INFO ABSTRACT
Article history:
Received: 08 August 2017 Accepted: 11 June 2018
In this study, the seismic inter-story drift of structures is estimated by a combination of mode-acceleration equations with the modelling of high-rise buildings with flexural and shear cantilever beams. In the equation presented for calculating the inter-story drift, having less knowledge of the building is adequate and this issue is of significance in estimating the nonstructural component forces, especially in high-rise buildings and also in the initial design of structures. Also, a comparison of inter-story drift estimated by the approximation method with an exact method indicates that the application of the mode-acceleration method compared to mode-displacement with a fewer number of modes comes close to the exact calculation, which facilitates and expedites the analysis. In order to carry out an exact evaluation of the presented equation, inter-story drift is calculated and compared in 10, 15 and 50 story buildings during three seismic records using approximate relations. Exact analysis of those structures is done in finite element Opensees software. The results of comparisons show that the presented equation provides an adequate estimation without the need for modelling and lengthy software analysis.
Keywords:
High Rise Buildings, Inter-Story Drift,
Mode-Acceleration Method, Flexural and Shear Cantilever, Beam Method,
Nonstructural Components, Sensitive to Inter-Story Drift.
1. Introduction
During the past few years, with regard to the retrofit of buildings and optimization of new
nonstructural components result in great financial loss [1]. In most buildings, the expenditures for nonstructural components and building content are many times that of constructing the building itself. Also, damages to nonstructural components of buildings result in the performance of many specific or important buildings to come to a halt. For example, damage to nonstructural components and content of a hospital during a relatively severe earthquake results in great hazards [2,3]. Thus, the issue of preventing fatalities and damages to nonstructural components and building content is very serious and the significance of paying attention to this issue even with approximate calculations also results in less fatalities and financial loss.
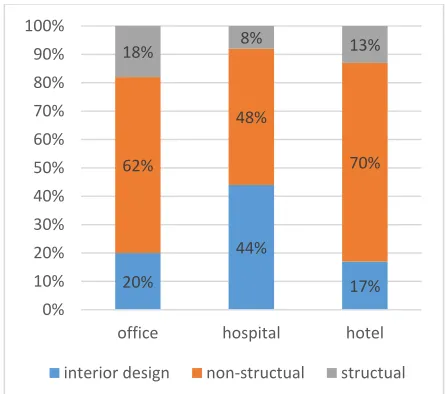
With regard to Figure 1, a comparison of the financial value of various building components with regard to their use is shown.
As it is observed in Figure 1, the financial value of the structural components of buildings compared to the nonstructural component and building content is less than 20%. Thus, preventing damage to nonstructural components in buildings is of great significance.
The inter-story drift in buildings during earthquakes is often among issues that result in great loss to nonstructural components. Nonstructural components sensitive to inter-story drift in buildings are observed in Table 1.
Fig. 1. Comparison of financial value of structural and nonstructural components and
building content.
Table 1. Nonstructural components sensitive to inter-story drift [5].
Sensitivity Component
Building walls Windows Inner doors Partitions Sensitive to drift Ceiling plaster
Electronic systems Partitions
Doors
Elevator cabin
Therefore, with regard to the sensitivity of nonstructural components to inter-story drift (Table 1), obtaining an approximate seismic response of inter-story drift in buildings is very important to prevents irreparable financial damages and fatalities.
In this study, an equation is proposed for estimating the inter-story drift using the
20%
44%
17% 62%
48%
70%
18% 8% 13%
0% 10% 20% 30% 40% 50% 60% 70% 80% 90% 100%
office hospital hotel
mode-acceleration equation based on the structural modelling method with shear beams.
1.1 Literature Review
1.1.1 Inter-Story Drift
The ratio of inter-story drift (IDR) in buildings is defined as the difference in displacement of upper and lower floors of a story divided by the height of that floor [12,16].studies by Miranda calculate the ratio of inter-story drift for the jth story using the
following equation:
1
( , ) ( 1) ( ) ( )
1 n
IDR j t j j D t
hi i i i i
(1)In this equation, i(j) and i(j+1) are the ith vibration mode in j and j+1 stories, respectively. h is the story height, n the number of stories, and i Modal participation factor of mode ith [14].
1.1.1. 1.1.2 Modelling High Rise
Buildings with the Flexural and Shear Cantilever Beam Method
The simple building model includes one continuous elastic model. In previous studies, continuous models were also suggested for estimating the structural response to wind or earthquakes [6, 7]. The model used in this study includes a combination of flexural and shear cantilever beam, which transforms under flexure and shear, respectively. Flexural and shear cantilever beams are connected by means of a rigid member and transfer the horizontal forces. Therefore, throughout the model height, both beams experience equal transformations [8].
Numerous research studies have been carried out regarding the cantilever beam methods for modelling and obtaining an approximate structural response in various loading. Nevertheless, Miranda [9] has had the main role in completing this method. Research carried out by Miranda and his colleagues [9, 10] have increased the precision of this method and proposed numerous revisions, hence improving it. The continuous model used includes a flexural cantilever beam and a shear cantilever beam, which transform in flexure and shear, respectively (Figure 2).
Fig. 2. Flexural and shear transformation in flexural and shear cantilever beam [11]. In the model proposed in Figure 2, the flexural and shear cantilever beam are connected together with an unlimited number of rigid members, which transfer the horizontal forces. The flexural and shear cantilevers in the hybrid system along the entire height are situated under equal lateral displacement.
2u(x,t) c u(x,t) EI 4u(x,t)
2 t 4 4
t H x
2
2 u(x,t) u (t)g EI
4 2 2
H x t
(2)
In Equation 2, is the mass per unit length in the cantilever beam model, H is the overall building height, u(x,t) is the normalized relative lateral displacement in height (which is variable between 0 at the structure foundation and 1 at the roof surface) and at time t, c is the damping coefficient per unit length, EI is the flexural rigidity of the flexural beam and is the ratio of lateral stiffness which is defined as Equation 3:
GA
H
EI
(3)With regard to the equation, GA is shear cantilever beam rigidity and EI is the flexural cantilever beam rigidity. The amounts of
equal to zero indicate a pure flexural cantilever beam (Euler-Bernoulli beam) and unlimited amounts show a pure shear cantilever beam. Average amounts of show multistory buildings in which the lateral displacements are a combination of flexural and shear lateral displacements. The simplified model of the shear and flexural cantilever beam is obtained based on Equation 4:
i
(x) sin( x) sinh( x) cos( x)
i i i i i
i cosh( x)
i i
(4)
in which i and i are dimensionless
parameters for the ith vibration mode which is obtained based on the following equations:
2 2
i i
(5)
2 sin( )
sinh( )
i
i
i i
i
i
2
cos( )
2
cosh( )
i
i
i
i
(6)
and i is the eigenvector of the ith vibration
mode which is dependent on the ith root of the equation character below:
4 0
2 2 cos( ) cosh( )
2 2 2
0 sin( ) sinh( ) 0
i i
i i
i i
i i
(7)
the vibration period of higher modes (Ti )can
be relatively obtained using the main vibration building mode (T1(, as follows:
T
i
1 1
T
1
i i
(8)With regard to the fact that masses are considered constant at the cantilever beam height, the modal participation factor i can
be calculated by the following equation:
1 i 0 i 1
2 i 0
(x)dx (x)dx
(9)
1.1.3 Mode-Acceleration
2 1
( , ) ( ) ( ) ( )
2 1
M i
u x t x D t D t
i i i
i i i (10)
The parameters of the equation are defined as follows:
i
D (t)
relative system speed for one degree of freedom of the ith mode (m/s).
i
ith mode frequency.i
ith mode damping.i
(x)
Displace mode figure for the ith
mode.
The mode-acceleration equation compared to the mode-displacement equation requires less participation of vibration modes in order to reach the appropriate dynamic response. Also, the mode-acceleration equation in high-rise buildings shows better performance [14].
2. Methodology
In this study, by combining the mode-acceleration and flexural and shear cantilever beam response equations, a new equation is presented for calculating inter-story drift in structures. The derivative of the mode-acceleration equation with respect to the dimensionless parameter (x=z/H) provides drift response based on the mode-acceleration equation:
( , )
( , )
2
1
( )
( )
1
( )
2
1
u x t
x t
x
i
x
D t
D t
H
i
i i
i
i
i
i
(11) in which ( )xi
is the first derivative of the
ith mode figure compared to dimensionless
altitudinal parameter x. A comparison of inter-story drift for the jth story is calculated by the following equation:
1 ( , )
2 1
( 1) ( ) ( ) ( )
2 1
IDR j t H
n i
j j D t D t
i i i i i
i i i (12) in which i(j+1) and i(j) are the ith vibratory
modes in floors j and j+1, respectively. h is the story height and n are the number of stories. Here, the ratio of inter-story drift in the jth story, based on mode-acceleration equation, is e equal to the rotation of the mid-height of story j in the model as shown in the following equation: 2 1 1 ( , ) ( , ) 2 1 1
( ) i ( ) ( )
i i i i
i i
IDR j t x t
x D t D t
H
(13) in which x is the level at mid-height of floorsacceleration and velocity response of the one degree of freedom system has higher accuracy and convergence speed in estimating structural response compared to the use of displacement response, which was used in the mode-displacement equation [14,15]. Nevertheless, the ratio of inter-story drift in dimensionless height x, is estimated by the following equation:
1 IDR(x, t)
H
2
m i 1
(x) D (t) D (t)
i i i 2 i
i 1 i
i (14) in which m is the number of modes which take part in obtaining the drift response. By using the seismic response equation, the inter-story drift in the simple flexural-shear beam model is obtained by using the mode-acceleration equation.
3. Introducing the Models and
Results of Analyses
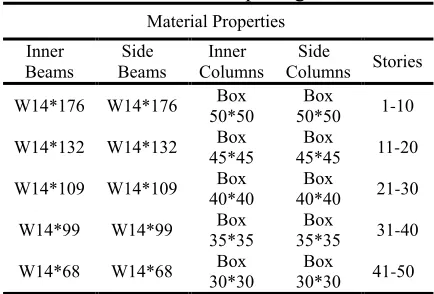
For evaluating the presented equation (Equation 14), 10, 15 and 50 story frames are considered. The evaluated columns are three flexural steel frames designed based on UBC94 regulations. It is supposed that the structures are placed in seismic zone 4 and soil type 2 region . The height of 10, 15 and 50 story buildings are 40.21, 51.8, and 150.2 m, respectively with a basic period of 1.9, 2.11, and 3.66 s. The damping percentage is considered as 5% and the overall weight of each story is 1107, 900 and 855 kN in three frames, respectively. The beam and column
arrangement in the frames is shown in Tables 2, 3 and 4.
Table 2. Beam and Column Layout in 10-story frame with 3 openings.
speartpo PrlaaretaM selrtaM stda slouloM ooar slouloM stda saplM ooar saplM 1,2 W14*109 W14*176 W24*55 W24*55 3,4 W14*82 W14*132 W21*50 W21*50 5,6 W14*74 W14*109 W21*50 W21*50 7,8 W14*68 W14*99 W21*44 W21*44 9,10 W14*48 W14*68 W16*40 W16*40
Table 3. Beam and Column Layout in 15-story frame with 3 openings.
speartpo PrlaaretaM selrtaM stda slouloM ooar slouloM stda saplM ooar saplM 1-3 2IPE27 2IPE33 IPE27 IPE30 4-6 2IPE24 2IPE30 IPE27 IPE30 7-9 2IPE22 2IPE27 IPE27 IPE30 10-12 2IPE20 2IPE24 IPE27 IPE30 13-15 2IPE18 2IPE22 IPE27 IPE30
Table 4. Beam and Column Layout in 50-story frame with 4 openings.
speartpo PrlaaretaM selrtaM stda slouloM ooar slouloM stda saplM ooar saplM 1-10 Box 50*50 Box 50*50 W14*176 W14*176 11-20 Box 45*45 Box 45*45 W14*132 W14*132 21-30 Box 40*40 Box 40*40 W14*109 W14*109 31-40 Box 35*35 Box 35*35 W14*99 W14*99 41-50 Box 30*30 Box 30*30 W14*68 W14*68
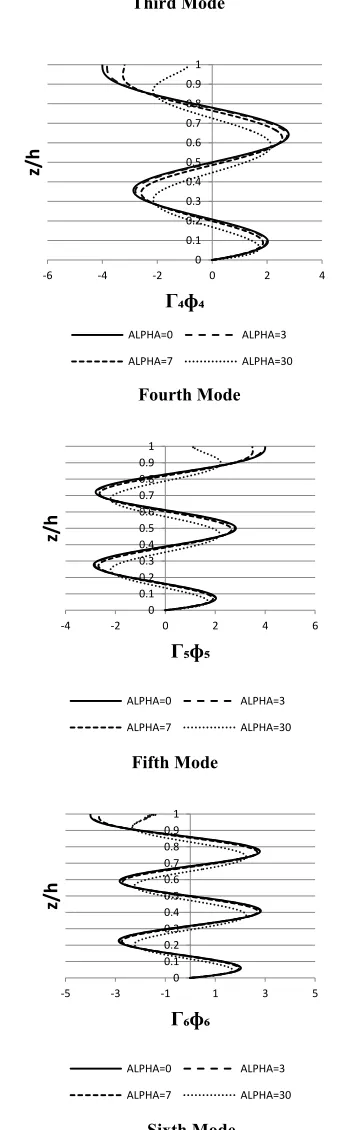
modes. For the lateral stiffness ratio equal to α=0, 3, 7 and 30, mode figures are obtained using equation 8 as follows. The mode participation obtained from Equation 9 are implemented in obtaining the mode figures.
edoM tsriF
Second Mode
eddoitsriF
teroo dtsriF
edo dtsriF t
tedo dtsriF
Fig. 3. The effect of dimensionless parameter of lateral stiffness ratio on mode figures.
0 0.1 0.2 0.3 0.4 0.5 0.6 0.7 0.8 0.9 1
0 0.5 1 1.5 2 2.5
z/h
Γ₁ɸ₁
ALPHA=0 ALPHA=3 ALPHA=7 ALPHA=30
0 0.2 0.4 0.6 0.8 1
-6 -4 -2 0 2 4
z/h
Γ₂ɸ₂
ALPHA=0 ALPHA=3 ALPHA=7 ALPHA=30
0 0.1 0.2 0.3 0.4 0.5 0.6 0.7 0.8 0.9 1
-4 -2 0 2 4 6
z/h
Γ₃ɸ₃
ALPHA=0 ALPHA=3 ALPHA=7 ALPHA=30
0 0.1 0.2 0.3 0.4 0.5 0.6 0.7 0.8 0.9 1
-6 -4 -2 0 2 4
z/h
Γ₄ɸ₄
ALPHA=0 ALPHA=3 ALPHA=7 ALPHA=30
0 0.1 0.2 0.3 0.4 0.5 0.6 0.7 0.8 0.9 1
-4 -2 0 2 4 6
z/h
Γ₅ɸ₅
ALPHA=0 ALPHA=3 ALPHA=7 ALPHA=30
0 0.1 0.2 0.3 0.4 0.5 0.6 0.7 0.8 0.9 1
-5 -3 -1 1 3 5
z/h
Γ₆ɸ₆
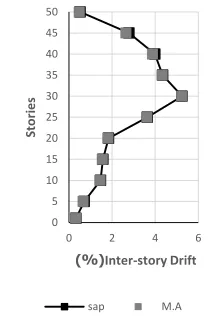
In order to evaluate the accuracy of the presented equation, the mentioned structures have been modeled and analyzed in opensees software under three earthquake records considering linear material behavior. The records consists of 1) Imperial Valley Earthquake El Centro Station, 2) Kern County earthquake Taft Station, 3) Loma Prieta earthquake Coralitus station. Drift results in the structures stories are obtained from the software. Figures 4 (a-i) compare the maximum inter-story drift of the stories resulting from the time history analyses in OpenSEES software with the results obtained from flexural and shear cantilever beam model and using Equation 14.
a) 10-story Frame-Imperial Valley Earthquake
b) 10-story frame- Kern County Earthquake
c) 10-story frame- Loma Prieta Earthquake
d). 15-story frame- Imperial Valley Earthquake
e) 15-story frame- Loma Prieta Earthquake
0 1 2 3 4 5 6 7 8 9 10
0 0.005 0.01
Stor
ie
s
Maximum Drift
OPENSEES M.A
0 1 2 3 4 5 6 7 8 9 10
0 0.001 0.002
Stor
ie
s
Maximum Drift
OPENSEES M.A
0 1 2 3 4 5 6 7 8 9 10
0 0.005 0.01
Stor
ie
s
Maximum Drift
OPENSEES M.A
0 1 2 3 4 5 6 7 8 9 10 11 12 13 14 15
0 0.005 0.01
Stor
ie
s
Maximum Drift
OPENSEES M.A
0 1 2 3 4 5 6 7 8 9 10 11 12 13 14 15
0 0.005 0.01
Stor
ie
s
Maximum Drift
f) 15-story frame- Kern County Earthquake
g) 50-story frame- Imperial Valley Earthquake
h) 50-story frame- Kern County Earthquake
i) 50-story frame- Loma Prieta Earthquake Fig. 4.tComparison of inter-story drift response
obtained from time history analysis in the software with acceleration obtained from the
presented equation.
As it is observed in Figures 4(a-i), using structural modelling with the cantilever beam method and using the mode-acceleration equation is an appropriate method for estimating the inter-story drift in high-rise buildings. In other words, the accuracy of the drift response equation using the mode-acceleration converges to an accurate response with fewer modes.
In Figures 5 (a-g), the effective mode numbers are evaluated in obtaining an accurate response in the equations provided for acceleration in 10, 15 and 50-story structures.
0 1 2 3 4 5 6 7 8 9 10 11 12 13 14 15
0 0.005 0.01
Stor
ie
s
Maximum drift
OPENSEES M.A
0 5 10 15 20 25 30 35 40 45 50
0 5 10
Stor
ie
s
Inter-story Drift
)%(
sap M.A
0 5 10 15 20 25 30 35 40 45 50
0 2 4
Stor
ie
s
Inter-story Drift (%)
sap M.A
0 5 10 15 20 25 30 35 40 45 50
0 2 4 6
Stor
ie
s
Inter-story Drift
)%(
a) 10-story building- 5th story- Imperial Valley Earthquake
b) 10-story building- 5th story- Kern County Earthquake
0 0.1 0.2 0.3 0.4 0.5 0.6 0.7 0.8
1 2 3 4 5 6
Inte
r-st
or
y
Dr
ift
(
%)
Mode number
Mode-Displacement Mode-Acceleration
0 0.02 0.04 0.06 0.08 0.1 0.12 0.14 0.16 0.18 0.2
1 2 3 4 5 6
Inte
r-st
or
y
Dr
ift
(
%)
Mode number
c) 10-story building- 4th story- Loma Prieta Earthquake
d) 15-story building- 9th story- Imperial Valley Earthquake
e) 15-story building- 11th story- LomaPrieta Earthquake
0 0.1 0.2 0.3 0.4 0.5 0.6 0.7
1 2 3 4 5 6
Inte
r-st
or
y
dr
ift
(
%)
Mode number
Mode-Displacement Mode-Acceleration
0 0.1 0.2 0.3 0.4 0.5 0.6 0.7
1 2 3 4 5 6
Inte
r-st
or
y
Dr
ift
(
%)
Mode Number
Mode-Displacement Mode-Acceleration
0 0.05 0.1 0.15 0.2 0.25 0.3 0.35 0.4 0.45
1 2 3 4 5 6
in
ter
-st
o
ry
Dr
ift
(
%)
Mode Number
f) 50-story building- 25th story- Kern County Earthquake
g) 50-story building- 10th story- LomaPrieta Earthquake
Fig. 5. Comparison of inter-story drift of the mode-displacement and mode-acceleration methods with the cooperation of higher modes.
In fact, in Figures 5, two mode-acceleration and mode-displacement methods are evaluated. With regard to Figures 5 (a-g), in the 10-story structure, the seismic response of the structure with the cooperation of 6 vibration modes with the mode-displacement method converges to the response of the mode-acceleration method with the cooperation of 3 vibration modes. Also, in the 15-story structure, structural seismic response with the cooperation of 8 vibration
modes with the mode-displacement method converges to the mode-acceleration response with the cooperation of 5 vibration modes. In the 50-story structure, the seismic response with cooperation of 6 vibration modes with the mode-acceleration method converges to the mode-displacement response with the cooperation of 18 vibration modes. In fact, the figures for inter-story drift indicate suitable results of using the mode-acceleration response for high-rise buildings, 0
0.5 1 1.5 2 2.5 3
3 6 9 12 15 18
Inte
r-st
or
y
Dr
ift
(
%)
Mode Number
Mode-Displacement Mode-Acceleration
0 0.2 0.4 0.6 0.8 1 1.2 1.4 1.6
3 6 9 12 15 18
Inte
r-st
or
y
Dr
ift
(
%)
Mode Number
which come closer to computer analyses with the cooperation of fewer modes.
High-rise structure modeling using the flexural-shear cantilever beam method is an appropriate method for structural analysis. In fact, by using structural modelling techniques in the form of flexural and shear beam utilizing less information of the structure, an adequate estimation of structural seismic behavior is obtained.
4. Conclusion
As the results indicate, the proposed equation provides an appropriate estimate by considering the number of modes for obtaining inter-story drift in various earthquakes. In the equations presented for inter-story drift, the mode-acceleration method is used. Contrary to the inter-story drift of Miranda, which was based on the mode-displacement technique, instead of using six mode vibration, three modes have been used. Therefore, it is clear that using the mode-acceleration method instead of the mode-displacement method requires the cooperation of fewer modes to estimate the response. Reduction in the number of cooperative modes in the mode-acceleration method does not reduce the precision in its seismic response estimation method. With regard to the capability of the proposed equation, in normal buildings with governing first mode, the first mode is used, and in high-rise buildings, the effect of higher modes can be considered. With an increase in the number of modes, the accuracy of the proposed equation increases and the response obtained from the equation comes closer to the accurate solution. In the equation proposed for analyzing and obtaining inter-story drift, much less information is
necessary compared to the dynamic structural parameters being evaluated. This fact will result in an increase of approximate analysis speed and estimation of structural inter-story drift. In the introductory design of high-rise buildings, an appropriate estimate of story drifts can be obtained by using the proposed equation. This can provide a better outlook on nonstructural element design which is sensitive to inter-story drift. For existing buildings, inter-story drift obtained from the proposed equation can result in implementing provisions for securing nonstructural elements of buildings.
5. Nomenclature
: Mass per unit length in the model (N/m) H: Overall structural height (m)u(x,t): Seismic response of displacement in a specific place and time (m).
x: Evaluated height in the model
(dimensionless). t: Time (s)
c : Damping per unit length
EI: Flexural rigidity of flexural beam
(Kg.m2)
: Lateral stiffness ratio (dimensionless)
GA: Shear rigidity of shear beam (Kg.m2)
i
h : Height of ith floor (m)
L: Aperture of floor beams i (m)
E: reactionary coefficient (Kg/m2)
c
I : moment of inertia of columns (m4)
g
I : moment of inertia of girders (m4) A: area column (m2)
d: Distance of column from neutral warp (m)
i
: Dimensionless parameter for the ithvibration mode(m)
i
: Eigen vector of the ith vibration modeT
i
: Vibration period of the ith modeف
T
i
: Cooperation coefficient of the ith mode2 2 u(x, t)
t
: Relative acceleration (m/s2)
2 g
2
u (t) t
: Earth acceleration (m/s2)
i
D (x): One degree of freedom system
displacement response for the ith mode (m)
(x)
i
: Displace mode figure for the ith modeu (x,t)
i
: Displacement response of ith mode
(m)
u (x,t)
: Absolute acceleration atdimensionless height x in time t (m/s2).
i
: ith damping modei
: i th mode frequencyD (t)
i
: relative system speed for one degreeof freedom of the ith mode (m/s).
REFERENCES
[1] Taghavi, S. and E. Miranda, Response assessment of non-structural building elements. 2003: Pacific Earthquake Engineering Research Center.
[2] Smith, B.S and E. Crowe, Estimating periods of vibration of tall buildings. Journal of Structural Engineering, (5) 112, 1986 p. 1005-1019.
[3] Stafford Smith, B. and A. Coull, Tall building structures: analysis and design. John Willey, New York, 1991.
[4] Cornwell, R., R. Craig, and C. Johnson, On the application of the mode‐acceleration method to structural engineering problems. Earthquake engineering & structural dynamics, 1983. 11(5): p. 679-688.
[5] Hansteen, O.E. and K. Bell, On the accuracy of mode superposition analysis in structural dynamics. Earthquake Engineering & Structural Dynamics, 1979. 7(5): p. 405-411.
[6] Dickens, J., J. Nakagawa, and M. Wittbrodt, A critique of mode acceleration and modal truncation augmentation methods for
modal response analysis. Computers & structures, 1997. 62(6): p. 985-998.
[7] Newmark, N.M. and W.J. Hall, Earthquake spectra and design. Earth System Dynamics, 1982. 1.
[8] Chopra, A.K., Dynamics of structures. Vol. 3. 1995: Prentice Hall New Jersey.
[9] Miranda E., Approximate seismic lateral deformation demands in multistory buildings. Journal of Structural Engineering, 1999. 1(4) 25 :p. 417-425.
[10] Miranda, E. and C.J. Reyes, Approximate lateral drift demands in multistory buildings with nonuniform stiffness. Journal of Structural Engineering, 2002. 128(7): p. 840-849.
[11] Miranda, E. and S. Taghavi, Approximate floor acceleration demands in multistory buildings. I: Formulation. Journal of structural engineering, 2005. 131(2): p. 203-211.
[12] Reinoso, E. and E. Miranda, Estimation of floor acceleration demands in high‐rise buildings during earthquakes. The Structural Design of Tall and Special Buildings, 2005. 14(2): p. 107-130.
[13] Gülkan, P. and S. Akkar, A simple replacement for the drift spectrum. Engineering Structures, 2002. 24(11): p. 1477-1484.
[14] Miranda, E. and S. Akkar, Generalized inter-story drift spectrum. Journal of structural engineering, 2006. 132(6): p. 84-852. [15] Chopra, A.K. and C. Chintanapakdee, Drift
spectrum vs. modal analysis of structural response to near-fault ground motions. Earthquake Spectra, 2001. 17(2): p. 221-234.
![Fig. 2. Flexural and shear transformation in flexural and shear cantilever beam [11]](https://thumb-us.123doks.com/thumbv2/123dok_us/8957614.1866982/3.612.337.519.286.469/fig-flexural-shear-transformation-flexural-shear-cantilever-beam.webp)