https://doi.org/10.5194/wes-4-355-2019
© Author(s) 2019. This work is distributed under the Creative Commons Attribution 4.0 License.
Wind direction estimation using SCADA data with
consensus-based optimization
Jennifer Annoni1, Christopher Bay1,2,3, Kathryn Johnson1,2, Emiliano Dall’Anese3, Eliot Quon1, Travis Kemper1, and Paul Fleming1
1National Renewable Energy Laboratory, Golden, CO, 80401 USA
2Department of Electrical Engineering, Colorado School of Mines, Golden, CO 80401, USA 3Department of Electrical, Computer, and Energy Engineering, University of Colorado – Boulder,
Boulder, CO 80309, USA
Correspondence:Jennifer Annoni ([email protected])
Received: 11 September 2018 – Discussion started: 5 October 2018 Revised: 14 May 2019 – Accepted: 16 May 2019 – Published: 20 June 2019
Abstract. Wind turbines in a wind farm typically operate individually to maximize their own performance and do not take into account information from nearby turbines. To enable cooperation to achieve farm-level objec-tives, turbines will need to use information from nearby turbines to optimize performance, ensure resiliency when other sensors fail, and adapt to changing local conditions. A key element of achieving a more efficient wind farm is to develop algorithms that ensure reliable, robust, real-time, and efficient operation of wind tur-bines in a wind farm using local sensor information that is already being collected, such as supervisory control and data acquisition (SCADA) data, local meteorological stations, and nearby radars/sodars/lidars. This article presents a framework for developing a cooperative wind farm that incorporates information from nearby turbines in real time to better align turbines in a wind farm. SCADA data from multiple turbines can be used to make better estimates of the local inflow conditions at each individual turbine. By incorporating measurements from multiple nearby turbines, a more reliable estimate of the wind direction can be obtained at an individual turbine. The consensus-based approach presented in this paper uses information from nearby turbines to estimate wind direction in an iterative way rather than aggregating all the data in a wind farm at once. Results indicate that this estimate of the wind direction can be used to improve the turbine’s knowledge of the wind direction. This estimated wind direction signal has implications for potentially decreasing dynamic yaw misalignment, decreas-ing the amount of time a turbine spends yawdecreas-ing due to a more reliable input to the yaw controller, increasdecreas-ing resiliency to faulty wind-vane measurements, and increasing the potential for wind farm control strategies such as wake steering.
Copyright statement. This work was authored [in part] by the National Renewable Energy Laboratory, operated by Alliance for Sustainable Energy, LLC, for the U.S. Department of Energy (DOE) under Contract No. DE-AC36-08GO28308. Funding provided by the U.S. Department of Energy Office of Energy Efficiency and Re-newable Energy Wind Energy Technologies Office. The views ex-pressed in the article do not necessarily represent the views of the DOE or the U.S. Government. The U.S. Government retains and the publisher, by accepting the article for publication, acknowledges that the U.S. Government retains a nonexclusive, paid-up,
irrevoca-ble, worldwide license to publish or reproduce the published form of this work, or allow others to do so, for U.S. Government purposes.
1 Introduction
optimiz-ing large wind farms in real time. Specifically, control sys-tems can be used to achieve a cooperative wind farm, which includes turbines that self-organize into groups, monitor their status and the status of other turbines, and control their per-formance to maximize the economic and reliable perfor-mance of a large-scale wind farm. A framework for coopera-tive wind farms can be achieved by representing a wind farm as a network of wind turbines. The network topology can be used to advance the state of the art in wind farm controls in topics ranging from distributed optimization and control to fault detection and short-term forecasting. In this sense, wind farms can take advantage of the network topology to imple-ment scalable, reconfigurable, and resilient control strategies in real time. The approach presented in this article is an itera-tive algorithm that takes advantage of the topology of a wind farm and incorporates local measurements from nearby tur-bines to determine the wind direction at an individual turbine. Improving the wind direction measurement at the turbine can reduce unnecessary yaw movements and minimize dynamic yaw misalignments.
Currently, turbines typically rely on wind vanes and anemometers mounted on the back of the nacelle to provide measurements to their controllers. Some turbine manufactur-ers have wind speed and wind direction estimators to correct for these errors based on individual turbine measurements. Individual measurements, on their own, can be unreliable due to the complex flow created as the wind passes through the rotor, preventing accurate inputs into the individual turbine yaw controller. One way to address noisy wind direction in-formation is to mount a forward-facing lidar on the nacelle to detect the wind in front of the turbine (Fleming et al., 2014b; Schlipf et al., 2013; Scholbrock et al., 2013; Simley et al., 2014). In addition, meteorological (met) towers can be used to characterize the inflow; however, most turbines do not have dedicated met towers and the wind direction can vary across a wind farm due to variable meteorological conditions and topography. Other remote sensing techniques have been proposed as well including radar, lidar, sodar, etc. (Peña et al., 2010; Barthelmie et al., 2016). However, they all require additional sensing equipment and integration into turbine controllers.
This paper describes a distributed optimization-based method to reliably estimate the wind direction across a wind farm even when faults and/or biases are present. Distributed optimization and control theory provide a framework for efficient computation of large systems, especially systems with network topologies. These types of optimization strate-gies have been used for multi-agent systems, such as un-manned aerial vehicles and robots, and can be used to co-ordinate subsystems to interact with their larger environment (Zhu and Martínez, 2015; Ferrari et al., 2016; Movric and Lewis, 2014; Shamma, 2008). Distributed optimization has also been considered in the wind farm controls literature (Marden et al., 2012; Spudi´c et al., 2015). However, com-plex aerodynamic interactions and large timescales make this
a challenging problem. For example, a distributed optimiza-tion framework for wind farm controls has been presented in Soleimanzadeh et al. (2013). However, solving this prob-lem becomes computationally complex as the system grows because of the number of turbines and larger flow domains. A limited-communication distributed model predictive con-troller designed to track a power reference signal is described in Bay et al. (2018); this algorithm uses a simplified lin-earized wake model to describe turbine interactions, allowing for scalability. Because this method requires a linear model, this method is difficult to extend to power maximization or load minimizations where the objective functions are highly nonlinear.
Consensus-based algorithms are a specific class of opti-mization algorithms that have the potential to accommodate sensor errors caused by failure, miscalibration, and noise by assuming that turbines experience wind inflow directions that share similar characteristics with those of their neigh-bors. Although consensus optimization is an active area of research for many applications, especially in multi-agent sys-tems, its use in wind farm applications is relatively new. A few studies have used consensus-based approaches for vari-ous problems in wind energy. In one such study, a dynamic average consensus estimator is used in Ebegbulem and Guay (2017) to estimate an overall cost function for turbines com-municating via an undirected network where the goal is to maximize total wind farm power production. Similar power maximization approaches using consensus-based approaches for an undirected graph can be found in Wang et al. (2017) and Gionfra et al. (2017). Finally, the research of Baros and Ilic (2017) allows turbines to self-organize using torque con-trol and storage to regulate total wind farm power output.
Fi-nally, Sect. 7 provides some conclusions and suggestions for future work.
2 Wind farm as a network
In this framework, turbines can take advantage of data from nearby turbines to make more informed decisions about in-dividual or farm-level operation. This framework is scalable and reconfigurable, and can be extended to include addi-tional sensors incorporating relevant nearby measurements from other turbines, meteorological instruments, and mobile sensors. Identifying a graph or network topology is important for incorporating local information and taking advantage of the structure of the wind farm to perform real-time optimiza-tion. The network connections can be based on proximity or based on physical interactions, i.e., aerodynamic interactions (wakes). This study uses proximity to define the connections between turbines. Finally, this approach can solve local op-timization problems and allows for local variations experi-enced in a wind farm. The wind farm can be modeled as an undirected or a directed network where turbines communi-cate with nearby turbines. Turbines in a wind farm can be considered the nodes, and the edges are established commu-nication between nearby turbines. Information is communi-cated across these edges to determine local atmospheric con-ditions – such as wind direction or wind speed – at a particu-lar turbine.
It is important to note that although turbines typically com-municate with a central computer to record SCADA data, an undirected network is used to determine which turbines to include while computing a local optimization at a particu-lar turbine. This topology is designed to take advantage of temporal and spatial structures in a wind farm. For example, a turbine on the westernmost edge of the wind farm can be experiencing a different wind speed/direction than a turbine on the eastern edge of the wind farm that is several kilome-ters away. This study uses a nearest-neighbor approach to define the network topology. Additional ways to characterize the network topologies will be explored in future work.
There are a few important things to note when determining the network topology in a wind farm. First, the local condi-tions can vary across a wind farm. The number of connec-tions between each turbine can determine the variability ob-tained across the wind farm. For example, if every turbine is connected to every other turbine, the variability across the wind farm will be small and the turbines will all agree on one set of atmospheric conditions based on a consensus ap-proach. In addition, the computation time will be high due to the number of communication exchanges per iteration of the consensus algorithm. However, if the turbine has no con-nections, the variation of the output of the consensus algo-rithm across the wind farm will be high and possibly unreli-able due to sensor noise and miscalibration. Smaller groups of turbines can agree on local conditions and provide a
re-liable measurement that more accurately captures the varia-tions across the wind farm.
3 Distributed optimization for real-time operation
A distributed approach can be used to solve an optimization problem that takes advantage of a system’s network topol-ogy. In this particular case, a distributed optimization prob-lem will be used to agree on wind direction across turbines. The problem can be decomposed such that each turbine can solve its own optimization problem, which incorporates in-formation from connected turbines in the network topology. In other words, a few measurements from nearby turbines are used to solve the optimization problem rather than solv-ing a centralized optimization problem that includes all surements from all turbines. Trying to incorporate all mea-surements from all turbines can be problematic in terms of communication limits and computational complexity, poten-tially taking hours to solve. However, grouping the turbines in a wind farm based on distance provides a computation-ally efficient algorithm for optimizing a particular objective function. The approach used in this article is based on Hallac et al. (2015), where the objective function can be written as
minimize xi
X
i∈V
fi(xi)
| {z }
node objective + X
(j,k)∈E
gj k(xj, xk)
| {z }
edge objective
i=1, . . ., Nturbs j ∈N(i), (1)
wherefi(xi) is the objective function at turbine i, i.e., the node objective;N(i) indicates the turbines connected to tur-binei;V is a set of all nodes andE is a set of all edges in the graph;xi is the wind direction estimate at turbinei; and gj k(xj, xk) compares wind direction measurements between turbinesjandkinN in the wind farm network, i.e., the edge objective. Each turbine is a node inVand the nearest turbines are connected by edges inE. This is a generalized framework for estimating many different quantities throughout the wind farm such as power, wind speed, or wind direction. The next section describes a wind direction consensus example to il-lustrate the utility of this framework.
3.1 Wind direction consensus
For this problem, each turbine uses its own wind direction measurement,exi,measure, as well as the wind direction mea-surement from the connected turbines to determine the local wind direction. First, the objective of the individual turbine i, i.e., the node objective, is to minimize the error between the wind direction measurement measured at turbinei and the estimated wind direction,xi, or
fi(xi)= exi,measure−xi−bi 2+
α|bi|, (2)
wherebi is the measurement bias in the wind direction with respect to true north, andαenforces sparsity of these biases in the wind farm. A largeαallows for very few biases to be identified among turbine measurements in the wind direction consensus algorithm. A small α allows for many biases to be identified. These biases can help identify faults in wind direction measurements. This approach allows the biases to be incorporated into the optimization, rather than be ignored, which can contribute to the overall wind direction consensus. In addition to the node objective, the edge objective incorpo-rates information from nearby turbines to ensure a reliable measurement of the wind direction at an individual turbine. The edge objective can be written as
gij xi, xj=wij|xi−xj|, (3) wherewijis a weight placed on the connection between tur-binesiandj,xi is the estimated wind direction at turbinei, andxj is the estimated wind direction at turbinej. The edge objective,gij(xi, xj), minimizes the differences in estimated wind direction between neighboring turbines. In this paper, the weights,wij, in each cluster are weighted based on dis-tance using a normal distribution; i.e., the information from turbines that are closer is weighted more than turbines that are farther away. Equations (2) and (3) are used by the opti-mization problem (Eq. 1) for this wind direction consensus problem. Using clustering allows each subset optimization to be performed in parallel, further reducing computational time. An iterative approach is needed to solve this optimiza-tion problem and is detailed in the next secoptimiza-tion. This iterative approach provides a feedback mechanism that lends itself to additional benefits such as fault detection.
3.2 Alternating direction method of multipliers
Alternating direction method of multipliers (ADMM) is a technique used to solve distributed optimization problems (Boyd et al., 2011) such as Eq. (1). This algorithm is partic-ularly useful in this case since each individual turbine solves its own optimization in parallel, communicates the solution to neighboring subsets, and iterates this process until the wind farm has converged and each node has reached a sin-gle value. In this study, each turbine determines its own local wind direction by only talking to its nearest neighbors, as indicated in Sect. 2. ADMM is used to solve a network op-timization with connecting nodes to determine a consensus between shared nodes such that
minimize Nturbs
X
i
fi(xi, bi)+λ X (j,k)∈E
wj kkzj k−zkjk2 (4)
subject toxi=zij, j∈N(i), (5)
wherezj kare copies ofxat different nodes; i.e.,zj,kis a copy ofxj at turbineksuch that the wind farm reaches consensus of the wind direction across the wind farm; andλis a penalty term that enforces consensus. Ifλis very large, there will be total consensus. Ifλis very small, there will be no consensus among nodes. The operatork · k2indicates theL2norm.
The distributed optimization problem is solved using ADMM by minimizing the augmented Lagrangian:
Lρ(x, b, z, u)=
X
i∈V
fi(xi, b)+
X
(j,k)∈E
λwj kkzj k−zkjk2
−(ρ/2)kuj kk22+ kukjk22
+(ρ/2)
kxj−zj k+uj kk22
+ kxk−zkj+ukjk22
, (6)
whereuis the scaled dual variable andρ >0 is the penalty parameter that enforces the constraints on the problem, i.e., enforcesxi=zi,j. The variablesx,b,z, andu are updated in serial. In this particular setup, the bias,bi, does not have a zupdate oruupdate since the biases are only known to the individual turbines; i.e., they are not communicated to nearby turbines.
4 Alternative methods for estimating wind direction
In addition to a consensus-based approach, alternative meth-ods can be used to determine an estimate of the wind direc-tion given the measurements of nearby turbines in the wind farm that are less computationally expensive. This section presents three alternative methods that will be used for com-parison to the consensus-based approach in the presence of a fault in one of the turbines. Results of the comparison will be given in Sect. 5.
4.1 Averaging
The first and simplest approach uses averaging across all of the turbines such that
xi= 1 N
N
X
j
xj,measure, (7)
the wind direction measured at turbinej. The main limitation to this approach is that it provides only one wind direction across the entire farm. It is common for the wind direction to vary across a large wind farm, so averaging is likely to give poor results for some turbines. Also, averaging is expected to perform worse in the presence of faults.
4.2 Weighted averaging
The next approach that was examined was a weighted aver-age of the wind directions at each turbine such that
xi= N
X
j
wijxj,measure, (8)
where wij is a weight based on the distance between tur-binesiandj. In this case, we used a normal distribution that weights turbines that are closer to turbine i with a higher weight and turbines that are farther away from turbine i with a lower weight. This method allows for changes in wind direction across the wind farm, which is likely to be an improvement over simple farm-wide averaging. However, faulty sensor cases may still be problematic.
4.3 Cluster average
Lastly, a cluster average was applied at each turbine. This is similar to consensus in that only measurements from the nearest X turbines are used, where X=15 for this study. However, cluster averaging uses a simple weighted average rather than the iterative, consensus-based approach presented in Sect. 3.1. This uses the network topology also used for the consensus-based approach to determine the wind direction at a turbine:
xi= Ni
X
j
wijxj,measure, (9)
where the weighted average wind direction at each turbine is determined by a subset of turbines,Ni. In the example in Sect. 6, Ni∈R20. This is similar to the weighted average
method, except only a subset of turbines are used rather than all of the turbines. Using only this subset may be helpful in excluding information from turbines that are far away.
5 Comparison of methods: wind direction estimation
This section demonstrates the benefits of the consensus ap-proach in Sect. 3.1 compared to the alternative methods pre-sented in Sect. 4.
5.1 Small wind farm – fault detection
First, the four different methods in Sects. 3.1–4 were tested on a six-turbine wind farm to demonstrate the performance
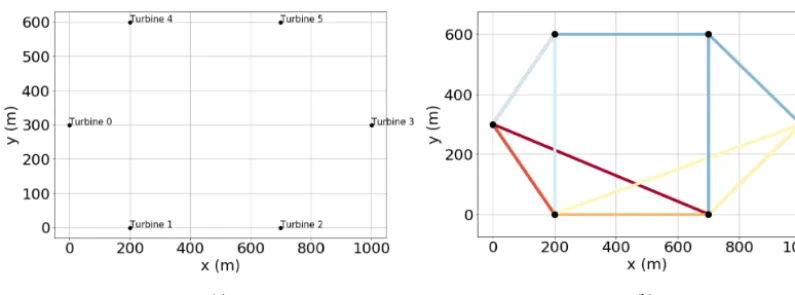
when a bias or fault is experienced at a turbine. The six-turbine wind farm is shown in Fig. 1a. The network topology used for the consensus approach, Sect. 3.1, and the cluster av-eraging, Sect. 4.3, is shown in Fig. 1b using the three nearest neighbors clustering strategy. The different colors in Fig. 1b represent the different clusters. For example, the darker blue lines indicate that Turbines 2, 3, and 4 are communicating with Turbine 5.
The wind direction is simulated from 270◦, and a fault is introduced at Turbine 0 such that the wind turbine is measur-ing a 90◦offset from the wind, i.e., a wind direction of 0◦. Such an error is possible in the field for a number of reasons including a drifting yaw position signal or a bent wind vane. Figure 2 shows the results of implementing the different methods described in Sects. 3.1–4. The top-left plot shows the “measured” data vs. the true wind direction. The top-right plot shows the estimated wind direction at each turbine us-ing the consensus approach described in Sect. 3.1. This plot shows that, through its iterative approach, consensus is able to determine the actual wind direction at Turbine 0 as well as at all of the other turbines. In evaluating the three averaging approaches in Sect. 4, the error introduced by a fault at Tur-bine 0 spreads at least to the nearby turTur-bines or, in the case of the simple average, across the entire wind farm. The re-sulting mean absolute error of each scenario is shown in the bottom-right subplot of Fig. 2. The consensus algorithm is able to outperform all of the other methods in this faulty sen-sor scenario. The mean absolute error shows that these other methods reduce the “average” error across the wind farm. This metric is important when assessing the accuracy of a method across a wind farm as will be shown in a larger wind farm example in Sect. 5. However, in this example, there is only one fault/error and the plots in Fig. 2 show that the error has spread to more turbines. In this case, it is critical that the consensus algorithm is able to identify the erroneous wind di-rection signal and minimally impact the other turbines in the wind farm. This will have implications when implementing advanced wind farm control strategies like wake steering.
5.2 Large wind farm
Figure 1.(a)Example six-turbine wind farm.(b)Example clustering based on the nearest three neighbors. The different colors represent the different clusters. For example, the darker blue lines indicate that Turbines 2, 3, and 4 are communicating with Turbine 5.
Figure 2.This six-turbine example demonstrates the effectiveness of the different methods in the presence of a fault in the Turbine 0 wind direction sensor. Panel(a)shows the “truth” data and the “measured” data. Note that the arrows are pointed in the upwind direction. Panel(b)
Figure 3.(a)This plot shows the simulated “truth” data underlying wind direction data based on the 30◦wind direction change across the wind farm.(b)This plot shows the simulated “measured” wind direction with noise added on top of the “truth” data. Note that the arrows are pointed in the upwind direction.
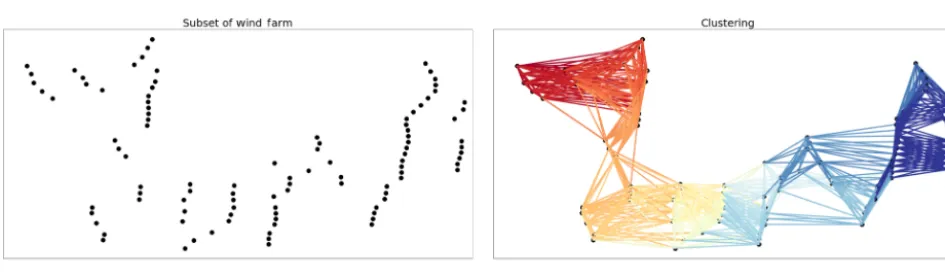
Figure 4.(a)This figure shows a subset of the turbines used in this study.(b)Connecting undirected edges indicating all groupings within the wind farm based on distance from each wind turbine to its neighbors.
period from the met towers and the sodar. The met towers had data at 1 min time intervals and the sodar had data avail-able at 10 min intervals.
To assess the performance of each method, the wind direc-tion data were simulated to provide a set of “truth” data. The simulated wind direction was generated based on the change in wind direction seen across the wind farm with added noise. First, the change in wind direction was observed in measure-ments from met towers in geographically different locations within the farm. Next, noise was added on top of this change in wind direction across the wind farm. Using the met tow-ers, there was an average of 30◦wind direction change across the wind farm. A standard deviation of 10◦was added on top of the wind direction change to simulate noisy wind direc-tion signals recorded at each turbine. Figure 3a shows the “true” underlying wind data based on the 30◦wind direction change across the wind farm, and Fig. 3b shows the “mea-sured” wind direction with noise added on top of the “truth” data. Note that the “measured” data in Fig. 3b visually look similar to the actual SCADA data recorded; see Fig. 7a.
5.2.1 Network topology and sensitivity analysis
Figure 5.(a)This subplot shows the mean absolute error computed with consensus using a range of penalty parameters,λ.(b)The cluster size was varied and resulting mean absolute error calculated to understand the best number of turbines to communicate with.
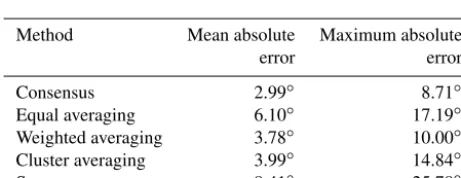
Table 1.Results of different methods. The mean absolute error col-umn is also plotted in the lower right subplot of Fig. 6. The consen-sus method also has the smallest maximum error.
Method Mean absolute Maximum absolute
error error
Consensus 2.99◦ 8.71◦
Equal averaging 6.10◦ 17.19◦
Weighted averaging 3.78◦ 10.00◦
Cluster averaging 3.99◦ 14.84◦
Sensors 8.41◦ 25.78◦
5.2.2 Comparing different methods
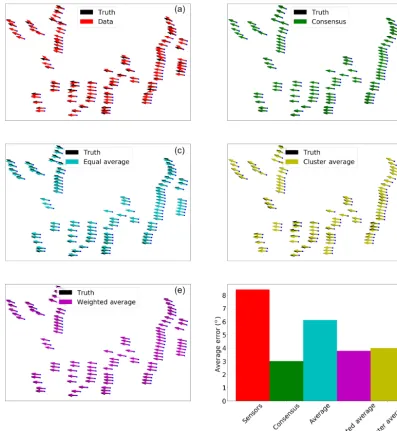
Next, the different methods described in Sects. 3.1–4 were compared across the large wind farm. Figure 6 shows the re-sults of the different methods applied to this large wind farm with a wind direction change of 30◦and a standard deviation of 10◦. The results indicate that the best results are achieved with the consensus algorithm, but the other methods perform similarly and are not as computationally expensive. They can reduce the error at some individual turbines, especially when no faults or additional biases are present. If corrected signals are included where no additional biases are present, the clus-ter averaging or the weighted averaging approach would be a good computationally efficient option. The total error re-sults of each of the methods are summarized in Fig. 6 in the bottom-right plot. In addition to the mean absolute error, the largest absolute errors were also recorded for each method and those results are shown in Table 1.
6 SCADA data analysis using the consensus algorithm for power analysis
In Sect. 4, we showed that the consensus algorithm is bet-ter able to estimate wind direction than the equal average, weighted average, and cluster average methods. In this sec-tion, we examine opportunities enabled by the algorithm, in-cluding with respect to power estimation and power curve calculation. First, consensus can capture the varying wind di-rection across the wind farm. Next, it can predict power loss by calculating misalignment in the turbine.
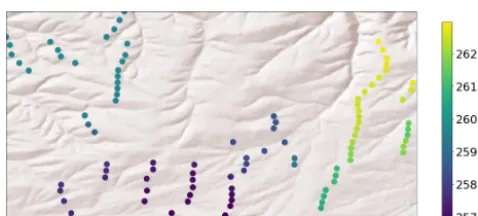
The consensus algorithm was used to post-process SCADA data to understand the possible gains of this ap-proach. First, the wind direction was examined at one time step with and without the consensus algorithm. Figure 7a shows the wind direction recorded at each wind turbine for one time step. This subplot shows the variability across the wind farm and the disagreement among turbines. Figure 7b shows the wind direction determined from the consensus al-gorithm at the same time step. Each time step takes 0.5 s to compute, in serial on a desktop computer, using the algorithm described in Sect. 3.1. The output of the consensus algorithm shows a smoothly varying wind direction across the wind farm. One implication of smoothly varying wind direction is that it may reduce the yaw motion of the yaw controller and the yaw drive in those turbines are not chasing local wind gusts that only last for a short time. Figure 8 shows the ter-rain and the corresponding color-coded wind direction and indicates that the wind direction varies with terrain, an effect that this algorithm is able to capture even in complex terrain. In particular, a strong change in wind direction is detected near the canyon in the north-central part of the wind farm.
in-Figure 6.This figure demonstrates the performance of the different methods on a larger wind farm than the one shown in Fig. 2 with noisy signals and a wind direction change across the wind farm. Panel(a)shows the “true” data and the actual data. Panel(b)shows the results of the consensus algorithm. Panel(c)shows the results of implementing equal averaging across the wind farm. Panel(d)shows the cluster averaging approach and(e)shows the weighted averaging approach across the full wind farm. The mean absolute errors of each of the methods are shown in panel(f).
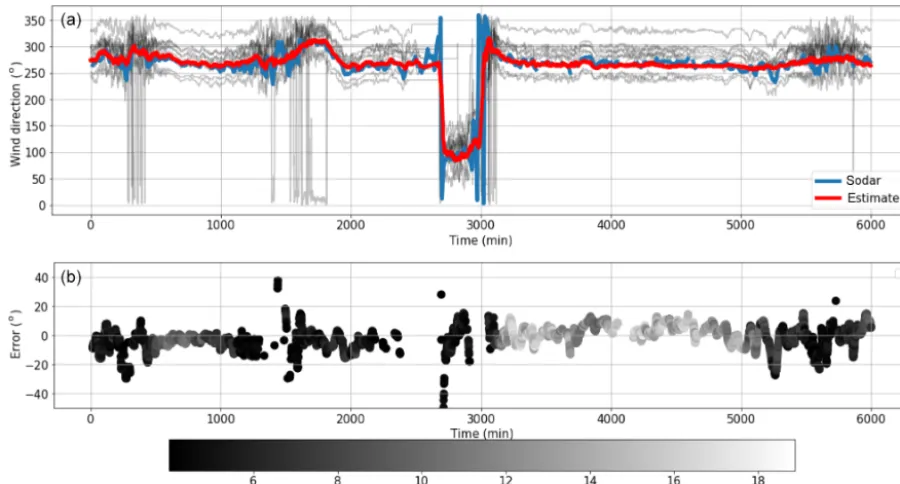
dividual turbines; i.e., the wind direction was determined at each turbine and the results were interpolated to the sodar lo-cation within the wind farm. The results were compared with the time series data recorded by the sodar as shown in Fig. 9. The top plot shows the time series wind direction measured by the sodar in blue and the estimate based on the consen-sus algorithm in red. This figure shows good agreement be-tween the estimated wind direction and the wind direction measured by the sodar. The 100 h shown in Fig. 9 were cho-sen to demonstrate the performance of the algorithm under large wind direction changes due to meteorological drivers.
Figure 9b shows the error between the estimated and actual signal recorded by the sodar. The points are color-coded with respect to wind speed. The largest errors are experienced at low wind speeds, typically at or below cut-in. Figure 10 shows the error distribution of the consensus algorithm com-pared with the sodar for wind speeds greater than 4.0 m s−1.
Figure 7.(a)The wind direction recorded at each turbine across the wind farm at one time step using actual SCADA data recorded at each turbine.(b)The wind direction estimated by the consensus algorithm at the same time step.
Figure 8.The consensus-based wind direction is shown across part of the wind farm based on the color of each turbine with the terrain plotted in the background. This shows the effects of terrain on the wind direction and indicates that the wind direction can vary across the wind farm.
between the estimated wind direction and the measured wind direction at the turbine. Figure 11a shows the power curve, computed with 95 % confidence intervals, of one turbine with small wind direction errors (less than 1◦) in green and large wind direction errors (greater than 10◦) in magenta. Using the estimated wind direction, we can identify when turbines are operating in misaligned conditions and correct dynamic yaw misalignment in the yaw controller.
Next, the average power loss of a turbine was computed for different amounts of wind direction error using a wind di-rection error of less than 1◦as the baseline from the SCADA data. Figure 11b shows the results of the average data, across all turbines across 500 h, in black. The percent of the 500 h of data used to compute the power loss at each offset is shown; i.e., 48.5 % of the data have less than 5◦offset. This plot indi-cates that some turbines across the wind farm could be spend-ing a significant amount of time misaligned. In literature, tur-bines operating in yaw misalignment have a loss of power that is proportional to cos(θ)pP(Gebraad et al., 2016), where
θis the misalignment angle andpPis determined empirically (Fleming et al., 2017). The value ofpPhas been shown to be between 1.0 and 2.0 (Gebraad et al., 2016; Fleming et al., 2017). In Fig. 11b, the SCADA data show the percent
de-crease in power vs. misalignment, where misalignment is cal-culated compared to wind direction consensus, most closely follows a cos(θ)1.4relationship. The loss in power is consis-tent with literature, which again indicates that the consensus-algorithm-estimated wind direction is a reasonable estimate of the wind direction at each turbine. Having a better wind di-rection measurement for the yaw controller of a turbine could improve yaw misalignments and reduce the amount of yaw-ing a turbine performs and might improve the effectiveness of wake steering (Fleming et al., 2014a).
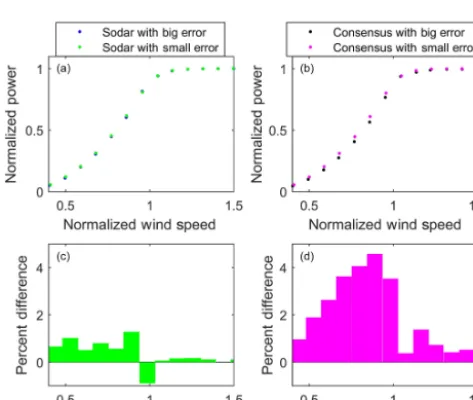
Finally, one additional metric was used for assessing the potential value of the consensus algorithm. We calculated the relative power performance of the turbines as they ex-perienced large (>20◦) and small (<10◦) wind direction er-rors compared to two baselines: (1) the sodar in the wind farm, and (2) the estimated wind direction from the consen-sus algorithm. In this analysis, we first eliminated erroneous data such as power values more than 13 % overrated power and less than 0. We used 10 min sodar data and 1 min turbine power and nacelle position data and calculated the statistics including the mean, median, and standard deviation of the power at each individual turbine based on wind speed bins of 1 m s−1. An average power curve was computed for the wind turbines in this wind farm after removing further outliers, de-fined as data points that were outside of 2 standard devia-tions above or below the median in each 1 m s−1wind speed bin. Based on a separate analysis using a power curve analy-sis for each individual turbine, we determined that some tur-bines likely experienced drift in their yaw-position sensors, causing it to appear that they had regularly large wind direc-tion errors despite being oriented correctly into the wind. We therefore removed data from turbines with consistently high, inexplicable wind direction errors compared to the consensus algorithm or the sodar.
Figure 9.(a)Comparison between the estimated wind direction calculated via consensus at the location of the sodar (red) and the actual wind direction recorded by the sodar (blue). The wind directions recorded by the nearest 10 turbines are shown in gray.(b)Error between the estimate and the actual wind direction recorded at the sodar. The dots are color-coded based on wind speed.
Figure 10.Error distribution of the estimated wind direction com-pared with measurements from the sodar. Note the measurements of the sodar are interpolated to match the 1 min time series from the consensus algorithm.
plot shows the difference in the power curve analysis when a large vs. small error is detected using the wind direction ref-erence from sodar measurements. The bottom-left plot shows the percent difference between these two power curves at each bin, where most percent differences are less than 1 %. In other words, the sodar reference is almost the same as the tur-bine sensor reference. The top-right plot shows the difference between the two power curves when using the consensus-based wind direction estimate as the wind direction
refer-ence. The bottom-right plot shows the percent difference be-tween the small and large wind direction errors detected with the wind direction estimate, which shows much larger differ-ences than when using the sodar as wind direction reference. The consensus algorithm therefore appears better able to de-tect true wind direction errors than the sodar.
Figure 11.(a)The power curve of a single turbine was computed using 0.5 m s−1bins over 500 h of data. The power curve is plotted for small wind direction errors of less than 10◦(green) and large wind direction errors of more than 10◦(magenta).(b)The power loss is computed for different yaw offset angles. The trend is consistent with cosine power laws seen in literature.
Figure 12.(a, b)Power curves based on binned data for 1 m s−1 wind speed bins across all turbines and(c, d)percent difference be-tween binned power from small wind direction errors to large wind direction errors. Positive percent difference indicates more power is generated when wind direction errors are small. Panels(a, c)are based on comparisons between turbine wind vanes and the sodar, and(b, d)are based on comparisons between the turbine wind vanes and the consensus algorithm.
be able to minimize yaw misaligned conditions. Lidars have been used to date to correct for yaw misalignment. How-ever, due to the limitations in scanning distances, lidars have only been able to correct static misalignment. This approach allows for more reliable wind direction measurements that correspond to larger timescales and space scales, which can ride through local wind variations with small timescales and might avoid yawing prematurely.
7 Conclusions and future work
This article presents a framework for a cooperative wind farm where turbines benefit from increased communication, i.e., sharing of data. The specific example that has been presented here is a wind direction consensus algorithm that uses infor-mation from nearby turbines to determine the wind direction. The results indicate that this strategy is able to detect wind direction errors and is supported using a power curve anal-ysis and expected power loss from misalignment from the literature. By increasing communication between turbines, it is possible to improve the performance of turbines in a wind farm. The proposed consensus-based approach was also compared with averaging methods and outperformed these methods especially when handling turbines with faults and/or biases in the data.
Future work will improve and extend the consensus ap-proach beyond wind direction estimation alone. An early step will determine the optimal number of connections between turbines given the layout and terrain features as well as al-lowable computation time. Next, the network topology cho-sen could facilitate short-term forecasting in a wind farm. For example, it takes minutes for wind to propagate down-stream. Turbines that exist upstream could communicate to connected downstream turbines the near-term conditions in-cluding wind direction changes that could mitigate extreme loading events. In addition, the consensus approach will in-vestigate the sensitivity to various turbulence levels in the atmosphere. This could be incorporated into the consensus algorithm itself in the form of a stochastic optimization.
turbine until maintenance can be scheduled and completed. In summary, this framework for cooperative consensus lays the groundwork for many different avenues for cooperative, autonomous wind farms.
Data availability. The data are not publicly available and were made available to NREL through the owner and operator of the wind farm through a contract. This data are proprietary information and are not to be released.
Competing interests. The authors declare that they have no con-flict of interest.
Disclaimer. The views expressed in the article do not necessar-ily represent the views of the US Department of Energy or the US Government.
Acknowledgements. Funding provided by the US Department of Energy, Office of Energy Efficiency and Renewable Energy, Wind Energy Technologies Office.
Financial support. This research has been supported by the US Department of Energy, Wind Energy Technologies Office (grant no. DE-AC36-08GO28308).
Review statement. This paper was edited by Sandrine Aubrun and reviewed by three anonymous referees.
References
Baros, S. and Ilic, M.: Distributed Torque Control of Deloaded Wind DFIGs for Wind Farm Power Output Regulation, IEEE T. Power Syst., 32, 4590–4599, 2017.
Barthelmie, R. J., Wang, H., Doubrawa, P., and Pryor, S.: Best Practice for Measuring Wind Speeds and Turbulence Offshore through In-Situ and Remote Sensing Technologies, available at: http://www.geo.cornell.edu/eas/PeoplePlaces/Faculty/spryor/ DoE_AIATOWEA/DoE2016Barthelmieetal_BestPractice_ 070716-1djxj4x.pdf (last access: June 2019), 2016.
Bay, C., Annoni, J., Taylor, T., Pao, L., and Johnson, K.: Active Power Control for Wind Farms Using Distributed Model Pre-dictive Control and Nearest Neighbor Communication, in: IEEE 2018 Annual American Control Conference (ACC), 682–687, 2018.
Boyd, S., Parikh, N., Chu, E., Peleato, B., and Eckstein, J.: Dis-tributed optimization and statistical learning via the alternating direction method of multipliers, Foundations and Trends®in Ma-chine Learning, 3, 1–122, 2011.
Ebegbulem, J. and Guay, M.: Distributed Extremum Seeking Con-trol for Wind Farm Power Maximization, in: International
Feder-ation of Automatic Control, IFAC-PapersOnLine, 50, 147–152, 2017.
Ferrari, S., Foderaro, G., Zhu, P., and Wettergren, T. A.: Distributed optimal control of multiscale dynamical systems: a tutorial, IEEE Contr. Syst. Mag., 36, 102–116, 2016.
Fleming, P., Annoni, J., Shah, J. J., Wang, L., Ananthan, S., Zhang, Z., Hutchings, K., Wang, P., Chen, W., and Chen, L.: Field test of wake steering at an offshore wind farm, Wind Energ. Sci., 2, 229–239, https://doi.org/10.5194/wes-2-229-2017, 2017. Fleming, P. A., Gebraad, P. M., Lee, S., van Wingerden, J.-W.,
John-son, K., Churchfield, M., Michalakes, J., Spalart, P., and Mori-arty, P.: Evaluating techniques for redirecting turbine wakes us-ing SOWFA, Renew. Energ., 70, 211–218, 2014a.
Fleming, P. A., Scholbrock, A. K., Jehu, A., Davoust, S., Osler, E., Wright, A. D., and Clifton, A.: Field-test results using a nacelle-mounted lidar for improving wind turbine power capture by reducing yaw misalignment, J. Phys. Conf. Ser., 524, 012002, https://doi.org/10.1088/1742-6596/524/1/012002, 2014b. Gebraad, P., Teeuwisse, F., Wingerden, J., Fleming, P., Ruben, S.,
Marden, J., and Pao, L.: Wind plant power optimization through yaw control using a parametric model for wake effects—a CFD simulation study, Wind Energy, 19, 95–114, 2016.
Gionfra, N., Sandou, G., Siguerdidjane, H., Faille, D., and Loeven-bruck, P.: A Distributed Consensus Control Under Disturbances for Wind Farm Power Maximization, in: 2017 IEEE 56th Annual Conference on Decision and Control (CDC), Melbourne, Aus-tralia, 2015–2020, 2017.
Hallac, D., Leskovec, J., and Boyd, S.: Network lasso: Clustering and optimization in large graphs, in: Proceedings of the 21th ACM SIGKDD international conference on knowledge discov-ery and data mining, 387–396, 2015.
Lindenberg, S.: 20 % Wind Energy By 2030: Increasing Wind En-ergy’s Contribution to US Electricity Supply, EERE Publication and Product Library, Washington, D.C., USA, 2009.
Marden, J., Ruben, S., and Pao, L.: Surveying game theoretic ap-proaches for wind farm optimization, in: 50th AIAA Aerospace Sciences Meeting including the New Horizons Forum and Aerospace Exposition, p. 1154, 2012.
Movric, K. H. and Lewis, F. L.: Cooperative optimal control for multi-agent systems on directed graph topologies, IEEE T. Au-tomat. Contr., 59, 769–774, 2014.
Peña, A., Hasager, C. B., Badger, M., Barthelmie, R. J., Bingöl, F., Cariou, J.-P., Emeis, S., Frandsen, S. T., Harris, M., Karagali, I., et al.: Remote sensing for wind energy, Risø National Laboratory for Sustainable Energy, Technical University, Risø, 2010. Schlipf, D., Schlipf, D. J., and Kühn, M.: Nonlinear model
predic-tive control of wind turbines using LIDAR, Wind Energy, 16, 1107–1129, 2013.
Scholbrock, A., Fleming, P., Fingersh, L., Wright, A., Schlipf, D., Haizmann, F., and Belen, F.: Field testing lidar-based feed-forward controls on the NREL controls advanced research tur-bine, in: 51st AIAA Aerospace Sciences Meeting Including the New Horizons Forum and Aerospace Exposition, p. 818, 2013. Shamma, J.: Cooperative control of distributed multi-agent systems,
Wiley Online Library, 2008.
Soleimanzadeh, M., Wisniewski, R., and Johnson, K.: A distributed optimization framework for wind farms, J. Wind Eng. Ind. Aerod., 123, 88–98, 2013.
Spudi´c, V., Conte, C., Baoti´c, M., and Morari, M.: Cooperative dis-tributed model predictive control for wind farms, Optim. Contr. Appl. Met., 36, 333–352, 2015.
Wang, L., Wen, J., Cai, M., and Zhang, Y.: Distributed Optimization Control Schemes Applied On Offshore Wind Farm Active Power Regulation, Energy Procedia, 105, 1192–1198, 2017.