Http://www.ijetmr.com©International Journal of Engineering Technologies and Management Research [48]
PERFORMANCE VALIDATION OF PRIOR QUANTIZATION
TECHNIQUES IN OUTLIERS CLASSIFICATION USING WDBC
DATASET
Dr.D.Rajakumari *1
*1 Assistant Professor, Department of Computer Science, Nandha Arts and Science College,
Erode, Tamil Nadu, India
Abstract:
Data mining is the process of analyzing enormous data and summarizing it into the useful knowledge discovery and the task of data mining approaches is growing quickly, particularly classification techniques very efficient, way to classifying the data, which is important in the decision-making process for medical practitioners. This study presents the quantization and validation (OQV) techniques for fast outlier detection in large size WDBC data sets. The distance metrics utilization makes the algorithm as the linear one for various objects and assures the sequential scanning. The inclusion of direct quantization technique and the cluster explicit discovery assures the simplicity and the economical. The comparative analysis of proposed OQV techniques with the triangular boundary-based classification and the Weighing-based Feature Selection and Monotonic Classification (WFSMC) regarding the accuracy, precision, recall and the number of attributes assures an effectiveness of OQV for large size datasets.
Keywords: Data Mining; Classification; Outlier Detection; Feature Selection; Wisconsin Diagnosis Breast Cancer (WDBC).
Cite This Article: Dr.D.Rajakumari. (2018). “PERFORMANCE VALIDATION OF PRIOR QUANTIZATION TECHNIQUES IN OUTLIERS CLASSIFICATION USING WDBC DATASET.” International Journal of Engineering Technologies and Management Research,
5(4), 48-56. DOI: https://doi.org/10.29121/ijetmr.v5.i4.2018.207.
1. Introduction
Http://www.ijetmr.com©International Journal of Engineering Technologies and Management Research [49]
Feature selection algorithms are grouped into three, namely, supervised[1], unsupervised[2] and semi-supervised[3] on the basis of labeling, un-labeling and partially labeling respectively. Multi-view learning algorithms are applicable to analyze the presence of correlated and complemented information on data. But, the selection of selective features via multi-view learning on single view data is the challenging task. An unsupervised feature selection approaches are used to overcome the problem in multi-view analysis. They utilizethe three information namely, data cluster center, the comparison between data and correlation between different views. A rough calculation of cluster labels introduced the noise due to the discrete nature leads to misguidance in feature selection. Robust spectral learning employs in unsupervised feature selection for the improvement of strength. In general, the data in high dimensional and a large space are labeled. The synchronized explore of labeling and un-labeling of data difficult by using the unsupervised feature selection approaches. Detection of the outliers is a critical task during the classification process due to the following issues. Small subsets of data instances that are located proximate and sensitive to the small changes in the attribute values resulting due to the switching of the classes. Variation in the accuracy of the classification model due to the presence of outliers in a dataset. Also the inability to correctly classify the data records near the boundary.
2. Related Work
The main objective of the outlier detection process is to isolate the observations that are considerably dissimilar from the remaining data. Due to the dimensionality, detection of the outlier in the high-dimensional data was a challenging task. Radovanovic et al[4]demonstrated that the distance-based outlier method had produced more contrasting outlier scores in the high dimensional data. This was done by reexamining the reverse nearest neighbors in the unsupervised outlier detection process. However, the distance-based outlier detection method was highly expensive. Angiulli et al[5]introduced a distributed method to detect the distance-based outliers in very large datasets. Improved efficiency and scalability of the distributed method for the increasing number of nodes was realized through the experimental results. Due to the potential quadratic time complexity, the distance-based outlier detection technique was difficult to utilize efficiently in very large datasets. Sequential and distributed algorithms were developed to address this problem, by combining the indexing and disk block accessing techniques.
The proposed algorithms have shown significant improvements when compared to the state-of-the-art distributed methods. Pham and Pagh[6]suggested a novel random projection-based technique to estimate the angle-based outlier factor for all data points. The theoretical analysis of the quality of approximation was introduced to guarantee the reliability of estimation algorithm. The empirical experiments on the synthetic and real-world datasets have demonstrated the efficiency and scalability of the proposed approach to very large high-dimensional datasets. A novel outlier detection model was introduced to detect the outliers that differ from the normal instances by considering the combinations of different subsets of attributes. The outliers in the arbitrarily oriented subspaces of the original feature space were searched by using the proposed model.
Http://www.ijetmr.com©International Journal of Engineering Technologies and Management Research [50]
the algorithm with respect to the density of the starting object and inefficient identification of the adjacent clusters of various densities. The computational complexity was also too high an algorithm called as Anyout capable of solving anytime outlier detection was introduced. A confidence measure for Any Out was proposed for the improved performance of the algorithm on constant data streams. The diagnosis of disease and early prediction of stages of cancer required the quality improvement in feature selection process. Sharma et al[7]designed the data mining model by using Probabilistic Neural Network (PNN). The PNN based selection model improved the accuracy and effectiveness of the treatment. The discovery of knowledge patterns in multi-clinical categorization was an important process .Jacob et al[8]analyzed the various feature selection algorithms namely, fisher filtering, runs filtering, stepwise discriminant analysis and RELIEF on error rate minimization. The comparative study improved the decision-making process in classification.
The simultaneous tracking of multi-level expressions of genes in the clinical data performed by using microarray. But, high dimensional feature vectors in microarray provided the maximum cost and risk in the over-fitting process. Kumari et al[9]presented the combination of filter and wrapper approaches to obtain the best feature vectors in the microarray. The classification performance dependent on input dimensionality. Hence, the feature selection process was enhanced to reduce the dimensionality Bolón-Canedo et al[10]reviewed the characteristics of microarray data and the selection methods applied to microarray data namely, Correlation-Based Feature Selection (CBFS), RELIEFF and minimum Redundancy and Maximum Relevancy (mRMR). They addressed the problems such as imbalance and the complexity. The task creation and the formulation of rules for decision making involved in the data mining framework. The complexity, size and variants of dataset made the conventional techniques were unsuitable in OD and OC. Rajakumariand Pannirselvam[11]proposed the novel Triangular Boundary-based Classification (TBC)that contained the training and testing algorithms to overcome the challenges in conventional techniques. The incorrect classification instance rate was substantially reduced in TBC. The deterioration of feature selection and classification performance occurs due to the relevant or irrelevant feature and noise in the traditional algorithms. Rajakumari[12] proposed the Weighing-based Feature Selection and Monotonic Classification (WFSMC) for relevant feature extraction. This paper evaluates the performance of TBC and WFSMC under various performance parameters. Outlier Quantization and Validation.
3. Methodology
The novel Outlier Quantization and Validation (OQV) techniques include the domain participation and objects allocation. The proposed OQV includes following phases.
i. Quantization ii. Outlier discovery iii. Cluster discovery
i. Quantization
Http://www.ijetmr.com©International Journal of Engineering Technologies and Management Research [51]
(D) for candidate outlier cells discovery sequentially. Construct the index if the hash table key identifies the relevant cell. Map the relevant object to the cell .Increment the count value in the cell. The populated mapped cells and the count values are stored in structure (S).
The increase in precision and dimensionality will increase the number of cells exponentially as (2𝑃∗𝑘) that increases the domain sparsity (same objects spread over the large cells). The static memory allotted for array structure is not effective, since the knowledge of populated cells only exists. The direct access instead of mapping is beneficial larger than the size and time taken.
ii. Outlier Discovery
The potential outlier cells validation in storage structure provides the outlier objects. The cell validation through the Nearest Neighbor (NN) search reduces the false positive rates. Moreover, the quantization based on distance metric assigns the objects in the cell as the outliers. The comparison of tolerance (T) with the domain count (𝑠𝑑𝑜𝑚𝑎𝑖𝑛𝑐𝑜𝑢𝑛𝑡 ) as a replacement for of cell count reduces the false positive rates as follows:
𝑠𝑑𝑜𝑚𝑎𝑖𝑛𝑐𝑜𝑢𝑛𝑡 = ∑{∀𝑠𝑐𝑜𝑢𝑛𝑡: 𝑠 ∈ 𝑁𝑁} ….. (1)
The neighbor limit (N) defines the NN search radius and the value N=1 represents the cell is bounded and N=3 denotes the cell in 3 distance from the target cell. The search is terminated if
𝑠𝑑𝑜𝑚𝑎𝑖𝑛𝑐𝑜𝑢𝑛𝑡 > 𝑇 to provide the optimum value as in following algorithm.
Outlier discovery
Initialize the storage structure (S), tolerant value (T), neighbor limit (N), count (C) For each d in D
I=calculate the index of d
Form the cell (c) according to the index value If (c!=invalid)
If (c is unknown)
cknown=compare(S, I,T,N,𝑠𝑐𝑜𝑢𝑛𝑡 ) End if
End if End for
Increment the count value (C) If C>T then
Return false Else
Return true End
Http://www.ijetmr.com©International Journal of Engineering Technologies and Management Research [52]
count value is incremented if all the values are mapped for particular cell. Then, compare the tolerance value with the count value and generate false reports if it is greater than the tolerance or lesser than the tolerance value. The cell validation (either common or outlier) provides the valid outlier cells for each object.
iii. Cluster Discovery
The outlier cell lists construction and the validation is the major tasks in cluster discovery. The algorithm for cluster discovery process is as follows:
Cluster discovery
Initialize the storage structure (S), tolerant value (T), neighbor limit (N), count (C) For each d in D
I=calculate the index of d
Form the cell (c) according to the index value If (c!=invalid)
If (c is unknown)
cknown=compare(S, I,T,N,𝑠𝑐𝑜𝑢𝑛𝑡 ) End if
End if End for
Cluster (𝑐𝑐𝑙𝑢𝑠𝑡𝑒𝑟)=new cluster of (S) While iterator.next
Increment the target cell count (𝑐𝑐𝑜𝑢𝑛𝑡) and the domain count (𝑠𝑐𝑜𝑢𝑛𝑡) If (𝑠𝑐𝑜𝑢𝑛𝑡 > 𝑇)
If (c=valid)
Merge (𝑠𝑐𝑙𝑢𝑠𝑡𝑒𝑟, 𝑐𝑐𝑙𝑢𝑠𝑡𝑒𝑟) End if
End while Return true
The symbols used in proposed OQV technique and associated description is listed in Table I.
Table 1: Symbols and its descriptions
Symbols Descriptions
S Storage structure
N Neighbor limit
I Index value
C Cell
𝑠𝑑𝑜𝑚𝑎𝑖𝑛𝑐𝑜𝑢𝑛𝑡 Domain count
T Tolerance value
C Count
Http://www.ijetmr.com©International Journal of Engineering Technologies and Management Research [53]
The known cell validation follows the outlier discovery procedures. The cluster of storage structure is initialized with the value C. The comparison of domain count with the tolerance value offers the best mapping of domain values with the cluster values. The quantization prior to clustering reduces the complexity and enhances the simplicity of clustering process
The known cell validation follows the outlier discovery procedures. The cluster of storage structure is initialized with the value C. The comparison of domain count with the tolerance value offers the best mapping of domain values with the cluster values. The quantization prior to clustering reduces the complexity and enhances the simplicity of clustering process.
4. Performance Analysis
This section discusses the performance of proposed Outlier Quantization and Validation (OQV) on WDBC (Wisconsin Diagnostic Breast Cancer) Dataset regarding the number of attributes, accuracy and precision and etc., If the predictions include a minimum number of false positives and false negatives, the accuracy of the algorithm is rated as high. The True Positive (TP) is the negative instances detected as outliers by the classifier, False Positive (FP) is the number of instances that are incorrectly detected as outliers, True Negative (TN) is the number of the positive instances detected as non-outliers and False Negative (FN) is the number of instances that are not detected as outliers. Hence, the classification performance of the proposed approach is higher than the existing algorithms.
TP-Negative instances correctly detected as outliers TN-Positive instances detected as non-outliers
FP-Instances detected as outliers detection incorrectly. FN-Instances non-detected as outliers
The comparative analysis between the proposed OQV techniques with the existing Triangular Boundary-based Classification (TBC) and Weighing-based Feature Selection and Monotonic Classification (WFSMC) provides the effectiveness of OQV.
i. Number of Attributes
The variation of number of attributes over the boundary-based feature selection and classification, weighing based classification with the OQV conveys the applicability of OQV in real time data set handling.
Figure 1 shows the comparative analysis of number of attributes required for boundary/weighing based feature selection/classification and OQV techniques. For TBC and WFSMC, the no. of attributes required for implementation is 15 and 12. The merging/mapping concept and the quantization in proposed OQV techniques effectively reduces the number of attributes requirement (11) and it offers the 26.67 and 8.33 % reduction in number of attributes compared to TBC and WFSMC respectively.
Http://www.ijetmr.com©International Journal of Engineering Technologies and Management Research [54]
Figure 1: No. of attributes vs techniques
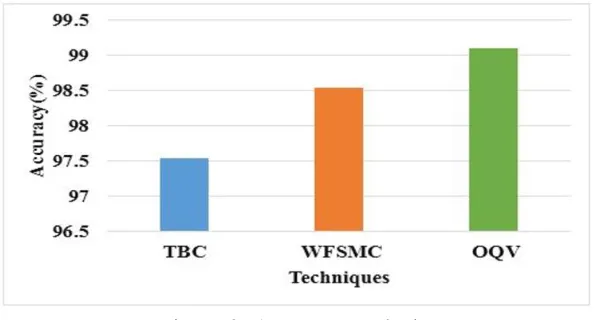
ii. Accuracy
The variation of accuracy over the boundary-based feature selection and classification, weighing based classification with the OQV conveys that the proposed OQV has the higher accuracy.
Figure 2: Accuracy analysis
Figure 2 shows the comparative analysis of number of attributes required for boundary/weighing based feature selection/classification and OQV techniques. For TBC and WFSMC, accuracy values are 97.54 and 98.54 %. The merging/mapping concept and the quantization in proposed OQV techniques effectively improves the accuracy value (99.1 %) and it offers the 1.59 and 0.57 % improvement compared to TBC and WFSMC.
iii. Precision
Http://www.ijetmr.com©International Journal of Engineering Technologies and Management Research [55]
Figure 3: Precision analysis
Figure 3 shows the comparative analysis of precision of boundary/weighing based feature selection/classification and OQV techniques. For TBC and WFSMC, precision values are 0.9541 and 0.9631. The merging/mapping concept and the quantization in proposed OQV techniques effectively improves the precision value (0.988) and it offers the 3.55 and 2.59 % improvement compared to TBC and WFSMC.
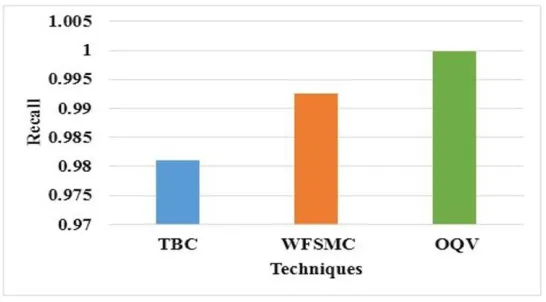
iv. Recall
The recall is also termed as sensitivity or true positive rate. It is the ratio of correctly predicted positive instances. Improving the recall can often decrease the precision. The increase in true positive prediction will increase the recall rate. The variation of precision values over the boundary-based feature selection and classification, weighing based classification with the OQV conveys that the optimality and the validation/quantization mechanisms improve the recall value.
Figure 4: Recall analysis
Http://www.ijetmr.com©International Journal of Engineering Technologies and Management Research [56] 5. Conclusion
The novel triangular boundary based classifications techniques, weighing based feature selection, and distance-based techniques are proposed to overcome the limitations in the existing classification techniques. This paper studied the conventional outlier techniques and their limitations. The useful knowledge discovery and the task of data mining approaches is growing quickly, particularly classification techniques very efficient, way to classifying the data, which is important in the decision-making process for medical practitioners. This study presented the Outlier Quantization and Validation (OQV) techniques for fast outlier detection in large size WDBC data sets. The distance metrics utilization made the algorithm as the linear one for various objects and assured the sequential scanning. The inclusion of direct quantization technique and the cluster explicit discovery assured the simplicity and the economical. The comparative analysis of proposed OQV techniques with the triangular boundary-based classification and the Weighing-based Feature Selection and Monotonic Classification (WFSMC) regarding the accuracy, precision, recall and the number of attributes proved the effectiveness of OQV for large size datasets.
References
[1] C. C. Aggarwal, "Supervised outlier detection," in Outlier Analysis, ed: Springer, 2013, pp. 169-198.
[2] K. Noto, C. Brodley, and D. Slonim, "FRaC: a feature-modeling approach for semi-supervised and unsupervised anomaly detection," Data mining and knowledge discovery, vol. 25, pp. 109-133, 2012.
[3] A. Daneshpazhouh and A. Sami, "Entropy-based outlier detection using semi-supervised approach with few positive examples," Pattern Recognition Letters, vol. 49, pp. 77-84, 2014.
[4] M. Radovanovic, A. Nanopoulos, and M. Ivanovic, "Reverse nearest neighbors in unsupervised distance-based outlier detection," IEEE Transactions on Knowledge and Data Engineering, vol. 27, pp. 1369-1382, 2015.
[5] F. Angiulli, S. Basta, S. Lodi, and C. Sartori, "Distributed strategies for mining outliers in large data sets," IEEE Transactions on Knowledge and Data Engineering, vol. 25, pp. 1520-1532, 2013. [6] N. Pham and R. Pagh, "A near-linear time approximation algorithm for angle-based outlier detection in high-dimensional data," in Proceedings of the 18th ACM SIGKDD international conference on Knowledge discovery and data mining, 2012, pp. 877-885.
[7] N. Sharma and H. Om, "Usage of Probabilistic and General Regression Neural Network for Early Detection and Prevention of Oral Cancer," The Scientific World Journal, vol. 2015, 2015.
[8] S. G. Jacob and R. G. Ramani, "Discovery of Knowledge Patterns in Clinical Data through Data Mining Algorithms: Multi-class Categorization of Breast Tissue Data," International Journal of Computer Applications (IJCA), vol. 32, pp. 46-53, 2011.
[9] B. Kumari and T. Swarnkar, "Filter versus wrapper feature subset selection in large dimensionality microarray: A review," 2011.
*Corresponding author.