EUKARYOTICCELL, Sept. 2009, p. 1381–1396 Vol. 8, No. 9 1535-9778/09/$08.00⫹0 doi:10.1128/EC.00121-09
Copyright © 2009, American Society for Microbiology. All Rights Reserved.
How a Cell Crawls and the Role of Cortical Myosin II
䌤
David R. Soll,* Deborah Wessels, Spencer Kuhl, and Daniel F. Lusche
W. M. Keck Dynamic Image Analysis Facility and Department of Biology, The University of Iowa, Iowa City, Iowa 52242
Received 27 April 2009/Accepted 13 July 2009
The movements of Dictyostelium discoideumamoebae translocating on a glass surface in the absence of
chemoattractant have been reconstructed at 5-second intervals and motion analyzed by employing 3D-DIAS software. A morphometric analysis of pseudopods, the main cell body, and the uropod provides a comprehen-sive description of the basic motile behavior of a cell in four dimensions (4D), resulting in a list of 18 characteristics. A similar analysis of the myosin II phosphorylation mutant 3XASP reveals a role for the cortical localization of myosin II in the suppression of lateral pseudopods, formation of the uropod, cytoplas-mic distribution of cytoplasm in the main cell body, and efficient motility. The results of the morphometric analysis suggest that pseudopods, the main cell body, and the uropod represent three motility compartments that are coordinated for efficient translocation. It provides a contextual framework for interpreting the effects
of mutations, inhibitors, and chemoattractants on the basic motile behavior ofD.discoideum. The generality of
the characteristics of the basic motile behavior ofD.discoideummust now be tested by similar 4D analyses of
the motility of amoeboid cells of higher eukaryotic cells, in particular human polymorphonuclear leukocytes.
Amoeboid behavior is a characteristic of cells spanning the entire animal kingdom (5, 6, 15, 56). It is basic to the life history of soil amoebae, embryogenesis, white blood cell func-tion, tissue regenerafunc-tion, neural development, and cancer me-tastasis (52). Therefore, the molecular biology of this process has been the focus of intensive investigation (2, 15, 40, 50, 53, 57). In marked contrast, the basic motile behavior of amoeboid cells, which provides the contextual framework for interpreting the results of genetic and biochemical studies, has received far less attention. We still lack an accurate and quantitative four-dimensional (4D) description of how an amoeboid cell trans-locates along a substratum in the absence of a chemotactic signal. The lack of such a description has led to perceptions of single cell migration that are 2D, sometimes oversimplified, and sometimes actually inaccurate. These perceptions, unfor-tunately, have served as the basis for modeling cell locomotion, interpreting the behavioral defects of cytoskeletal and regula-tory mutants, and assessing the effects of inhibitors and stimuli, most notably chemoattractants.
To obtain a 4D description of cell behavior, we have em-ployed 3D-DIAS software (25, 61, 62, 64, 78) to reconstruct and motion analyze the basic motile behavior ofDictyostelium discoideumamoebae translocating along a substratum in the absence of chemoattractant (63, 71, 76, 77, 79, 80). By quan-titating in space and time the extension and retraction of pseu-dopods, changes in shape, anterior progress of the main cell body and uropod, and contact of the ventral surface of the cell with the substratum, we have developed a complex morpho-metric description of cell migration that reveals a number of characteristics. In addition, by similarly reconstructing and mo-tion analyzing the myosin II heavy chain dephosphorylamo-tion mutant 3XASP (20), a more complex role is revealed for my-osin II localization in the posterior cell cortex.
MATERIALS AND METHODS
4D reconstructions of crawling cells.MigratingD.discoideumamoebae were visualized on the glass surfaces of chambers perfused with a buffered salts solution in the absence of chemoattractant using differential interference con-trast microscopy (Fig. 1A). A stepping motor was used to obtain 60 optical sections of a cell through thezaxis in a 2-second period (Fig. 1B) (26, 27, 61, 62, 64, 78). The optical sections were used to generate a 3D representation of the cell every 5 seconds. Cells at low density were perfused in a chamber with buffer at a rate that precluded conditioning of the soluble microenvironment, a neces-sary precaution becauseD.discoideumcells release the chemoattractant cyclic AMP (3, 14, 36), which alters basic motile behavior in the process of chemotaxis (63, 69).
For each of the 60 optical sections obtained for a single 3D reconstruction, the complete in-focus perimeter of the cell was outlined (Fig. 1C), and the pseudo-pods and cell body were demarcated (Fig. 1D). The perimeters (outlined edges) of the compartments were converted to beta-spline representations and stacked (Fig. 1E). The representations were then connected in thezaxis, and the surface was smoothed by previously described methods (61, 63, 64) to produce the final 3D reconstruction (Fig. 1F). Each reconstruction could be viewed from any angle (Fig. 1G). Views at a 0° tilt revealed whether the ventral surface of the cell was in contact with the substratum or within 1m of the substratum (Fig. 1G). Because the surfaces of the cell were converted to beta-spline representations, the reconstruction at each time point was, in essence, a mathematical model, and the entire cell or any encapsulated or windowed component (e.g., pseudopod, uropod) could be analyzed quantitatively for changes in shape, volume, and motility using 3D-DIAS software (61, 62, 64, 78).
Definitions of cell regions and landmarks.Based upon the visual texture of the cytoplasm (Fig. 1A and D), a migrating cell could be separated into the cell body, which contained particulate cytoplasm filled with vesicles, mitochondria, vacu-oles, and the nucleus, and pseudopods, which contained “nonparticulate” cyto-plasm (Fig. 1H). The “anterior pseudopod” directed anterior cellular transloca-tion, and a “lateral pseudopod” represented an extension either from the posterior flank of the previous anterior pseudopod (2) or from the anterior half of the cell body (Fig. 1H). When a lateral pseudopod assumed the role of anterior pseudopod, it was considered the “new anterior pseudopod,” and the previous anterior pseudopod was considered the “old anterior pseudopod.” The “tip of the anterior pseudopod” was considered the point on the pseudopod surface farthest from the cell body. The “interface,” which represented the boundary between the nonparticulate cytoplasm of a pseudopod and the partic-ulate cytoplasm of the cell body, provided a reliable landmark for assessing anterior progress of the cell body (Fig. 1H). The “posterior tip” of the cell body provided a reliable landmark for monitoring anterior progress of the posterior end of the cell body (Fig. 1H). The “anterior-posterior axis” represented the line drawn through the center of the cell body, from the interface of the anterior pseudopod to the posterior tip (Fig. 1H). The axis frequently contained a major bend, the “turning point,” which marked the position at which a new anterior
* Corresponding author. Mailing address: Department of Biology, The University of Iowa, 302 BBE, Iowa City, IA 52242. Phone: (319) 335-1117. Fax: (319) 335-2772. E-mail: [email protected].
䌤Published ahead of print on 24 July 2009.
1381
on September 8, 2020 by guest
http://ec.asm.org/
pseudopod had caused a soft (⬍45°) or sharp (⬃90°) turn. For assessing the distribution of volume, the cell body was arbitrarily separated into an “anterior half” and a “posterior half” by bisecting the anterior-posterior axis. The cell body was also subdivided into two portions based on cell contour, the larger, anterior “main cell body” and the tapered, posterior “uropod” (Fig. 1H). The place at which curvature changed between the two was referred to as the “junction” (Fig. 1H). Both the main cell body and uropod contained particulate cytoplasm. Cells also formed filopodia from their pseudopods that redistributed along the main cell body to the uropod, where they were referred to as “tail fibers” (27). In the studies presented here, filopodia and tail fibers were not reconstructed.
Finally, for this analysis it was critical that distinctions were made between pseudopod “formation,” “expansion,” “extension,” and “retraction.” Formation denoted the appearance of a new pseudopod, regardless of its dynamics. Expan-sion denoted growth of a pseudopod (an increase in pseudopod volume). Ex-tension denoted progress by the tip of the fully expanded pseudopod away from the cell body after the pseudopod had grown to its approximate maximum volume. Retraction referred to the withdrawal of a pseudopod of any size back into the cell body.
RESULTS
Pseudopod expansion and extension do not correlate with
episodic posterior contractions.It has been proposed that
my-osin-mediated rear retraction provides force for coordinated
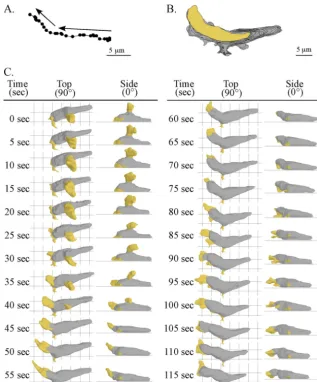
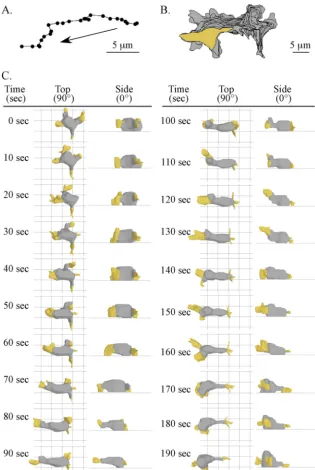
protrusion of the leading edge in the process of cellular trans-location (8, 23, 24, 34). An alternative, widely held view is that cell movement occurs as a series of discrete steps or episodes initiated by protrusion at the front end followed by myosin-mediated release from the substratum and rear retraction in the direction of travel (1, 31). To explore the perception that pseudopod formation and extension occurred in steps (i.e., episodic) and correlated with episodic contractions of the pos-terior end of a cell, we tested whether there was a temporal correlation between protrusion at the front end and release from the substratum and contraction at the rear end. For the representative amoeba reconstructed in Fig. 2, the centroid (center of area computed in 2D) (61, 62) translocated approx-imately 15m in 115 s in the absence of a sharp turn (Fig. 2A). The centroid and perimeter tracks were relatively persistent and in one general direction, containing only one “soft” turn to the right at approximately a 45° angle (see vectors in Fig. 2A). At the time of the first 3D reconstruction (0 s), this represen-tative cell was in the process of retracting its original anterior pseudopod and extending a new lateral pseudopod from its left
FIG. 1. The 3D-DIAS software program provides 3D reconstructions of a live, translocating cell at time intervals and demarcation of cell regions and landmarks. (A) A top view of the stacked sections of aD.discoideumamoeba obtained by differential interference contrast microscopy. The anterior pseudopod (a. ps.) and lateral pseudopod (l. ps.) and uropod (u.) are indicated. (B) A side view of 60 stacked optical sections, all collected within a 2-second period. (C) Outlining of the in-focus edge of the cell perimeter of each optical section. (D) In each outline, the perimeter of nonparticulate cytoplasm is yellow and that of particulate cytoplasm is black. (E) The outlines are then stacked. (F) A 3D-DIAS software program smoothes the edges of outlines by beta-spline replacement windows and then connects them in thezaxis to generate a 3D reconstruction, in which the cell body and the pseudopods are color coded gray and yellow, respectively. Smoothing procedures are applied. (G) Reconstructions can be viewed at any angle. The posterior-anterior axis is indicated by an arrow in a circle above the three columns of images, and the angle of view (0°, side; 90°, from on top) is shown to the left of the three rows of images. (H) Particular cell regions and landmarks germane to the analysis are denoted. In panels C and D, numbers refer to optical sections 1, 8, and 17.
on September 8, 2020 by guest
http://ec.asm.org/
flank. A side view (0°) revealed that the new lateral pseudopod had formed several microns above the substratum (Fig. 2C). It expanded during the first 20 s (0 to 20 s) and then retracted back into the cell body over the next 25 s (20 to 45 s), never contacting the substratum (Fig. 2C). Retraction occurred si-multaneously with the formation of a new pseudopod from the original anterior end (Fig. 2C). Side views revealed that the new anterior pseudopod first expanded along the substratum (20 to 35 s) and then continued to expand off the substratum (40 to 50 s) (Fig. 2C). During the initial 55 s of analysis (0 to 55 s), the posterior tip of the cell remained fixed in relation to the substratum, and the uropod did not undergo any change in shape that would suggest an episodic contractile event paral-leling anterior pseudopod extension (Fig. 2C). At 50 s, the anterior pseudopod stopped expanding, and between 50 and 115 s, it extended anteriorly (Fig. 2C). The cell body translo-cated anteriorly, in unison with the extending pseudopod (Fig. 2C).
To explore whether a visible contraction in the posterior half of the cell occurred prior to or in parallel with anterior pseu-dopod expansion (2 to 115 s), the contour of the anterior pseudopod and the posterior end of the cell body were out-lined from the top (90°) and from the side (0°) (Fig. 3A). At time zero (0 s), the anterior pseudopod was outlined in red, and the posterior portion of the cell was outlined in green. At subsequent time points, both were outlined in black and over-laid on the respective red and green outlines obtained at time zero for comparison (Fig. 3C). The outlines of the anterior pseudopod between 5 and 115 s did not match the outlines at 0 s (Fig. 3C). In marked contrast, the outlines of the posterior portion of the cell during the entire 115 s of analysis were nearly superimposable upon the outlines at 0 s, reflecting a relatively stable shape (Fig. 3C). These results, which were obtained for three additional wild-type cells translocating in a similar fashion (i.e., in the absence of a sharp turn) (data not shown), demonstrated that a pseudopod could expand, extend
FIG. 2. Motion analysis and 3D reconstruction of a representative cell undergoing a soft turn (⬃45°). (A) The track of the cell centroids (centers of mass) in 2D over 115 seconds. The arrows show the direction of travel. (B) The track of the cell perimeters in 2D over 115 s. The area of the last position of the cell is shown in yellow, and the areas of the preceding positions are shown in gray. (C) 3D reconstructions of the translocating cell every 5 s. The pseudopods are color coded yellow, and the cell bodies are color coded gray. Top (90°) and side views (0°) are presented at each time point.
VOL. 8, 2009 HOW A CELL CRAWLS 1383
on September 8, 2020 by guest
http://ec.asm.org/
anteriorly, and undergo dramatic changes in shape in the ab-sence of concomitant changes in the shape of the uropod.
Coordinate translocation of the anterior and posterior ends
of the cell body. The preceding analysis suggested that the
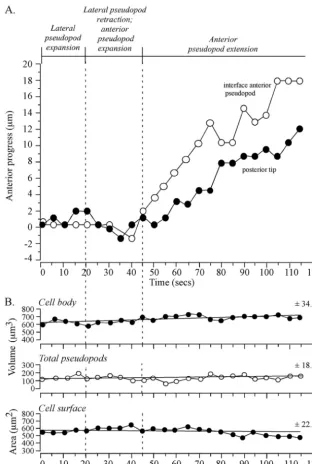
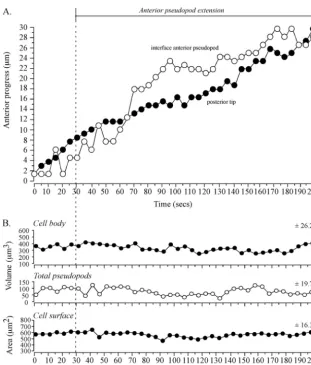
interface tracked an extending anterior pseudopod. To test whether tracking by the interface was coordinated both with anterior progress of the anterior tip of the pseudopod and anterior progress of the posterior tip of the cell, the positions of the three landmarks were coplotted (Fig. 3B). During the period of rapid anterior pseudopod extension (50 to 115 s), the interface (blue dot) moved in coordination with and in the direction of the anterior pseudopod tip (red dot) (Fig. 3B). During this period, the posterior tip (green dot) also moved, but it did so in the direction of the original cell axis (Fig. 3B). Temporal coordination was more evident in time plots of the anterior progress of the interface and posterior tip (Fig. 4A). Between 0 and 45 s, when the anterior pseudopod was expand-ing, neither the interface of the anterior pseudopod or
poste-rior tip moved (Fig. 4A). At 45 s, however, when the anteposte-rior pseudopod extended away from the cell body in a persistent fashion, both the interface and posterior tip of the cell body also translocated anteriorly (Fig. 4A). The rates of anterior translocation were slightly different, 2.9m per 10 s for the interface and 1.9m per 10 s for the posterior tip. This dif-ference led to a progressive increase in the length of the cell body (Fig. 2C). These results indicated that the cell body could remain spatially fixed with a constant shape when a lateral pseudopod just expanded and then retracted and when an anterior pseudopod expanded.
Pseudopod volume, cell body volume, and surface area.The
representative cell reconstructed in Fig. 2 and three additional cells reconstructed in a similar fashion (data not shown) were at no time without a pseudopod. This proved true for over 50 additional wild-type cells translocating in buffer that had been reconstructed in 3D over the past 10 years using 3D-DIAS software (data not presented). For the cell in Fig. 2, when the
FIG. 3. When a cell translocates, the anterior pseudopod continually changes shape, but the posterior portion of the cell that includes the uropod maintains a relatively constant shape. The representative cell is the same one analyzed in Fig. 2. (A) Color coding of the outlined regions at time zero. (B) Tracks of the anterior tip (red), interface (blue), and posterior tip (green) over a 115-second period. (C) Comparison of the shapes of the anterior pseudopod and posterior portion of the cell. At each time point, the new outline in black is superimposed over the red outline at 0 second to assess changes in shape. Top (90°) and side (0°) views are presented at each time point.
on September 8, 2020 by guest
http://ec.asm.org/
volume of the lateral pseudopod increased, the volume of the original anterior pseudopod decreased, and when the volume of a new anterior pseudopod increased, the volume of the lateral pseudopod decreased, suggesting a mechanism that maintained a constant collective volume for all pseudopods.
For the cell in Fig. 2, as the anterior pseudopod expanded to full volume, the interface remained fixed in relation to the substratum. After the anterior pseudopod had achieved full volume and had begun to extend, the interface tracked it, thus contributing to the maintenance of a relatively constant pseudopod volume (Fig. 2C).
Measurements of collective pseudopod volume (i.e., anterior plus lateral) revealed that no major change correlated with the transition from lateral pseudopod expansion to retraction, anterior pseudopod expansion, or anterior pseudopod extension (Fig. 4B). Both the vol-ume and surface area of the cell body also exhibited no dramatic changes correlating with a change in pseudopod dynamics (Fig. 4B). There were, however, gradual changes in the three parameters (Fig. 4B). For instance, there was a gradual increase in cell body volume and collective pseudopod volume and a gradual decrease in cell surface area (Fig. 4B).
FIG. 4. Anterior progress of the interface and posterior tip is coordinated in a cell undergoing a soft turn (⬃45°) during anterior pseudopod extension. No dramatic changes in pseudopod volume, cell body volume, or cell surface correlate with the onset of anterior pseudopod expansion at 20 seconds or anterior pseudopod extension at 45 seconds. The representative cell is the same one shown in Fig. 2. (A) Time plots of anterior progress of the interface and posterior tip. Pseudopod dynamics are delineated at the tip of the graph. (B) Time plots of cell body volume, total (collective) pseudopod volume, and cell surface area. Vertical dashed lines denote landmark events. The best-fit lines and the mean deviation from the best-fit line (⫾standard deviation) are presented for each of the three parameters analyzed.
VOL. 8, 2009 HOW A CELL CRAWLS 1385
on September 8, 2020 by guest
http://ec.asm.org/
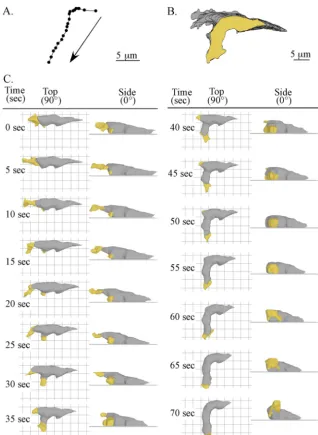
Similar rules hold during a sharp turn.Lateral pseudopods that initiate sharp turns form either on the substratum or initially form off the substratum and then descend to the sub-stratum (76). During the first 15 s of analysis, the representa-tive cell in Fig. 5 translocated persistently in the anterior di-rection (Fig. 5A and B). The anterior pseudopod extended, even though it was not in contact with the substratum (Fig. 5C). During this period, a small lateral pseudopod on the left flank of the cell that was not in contact with the substratum maintained relatively constant volume. Between 15 and 20 s, this lateral pseudopod expanded, descended to the substratum, and then expanded for 15 subsequent seconds (Fig. 5C). As the new lateral pseudopod expanded (15 to 30 s) and extended away from the cell (20 to 70 s), the original anterior pseudopod retracted into the main cell body and did so off the substratum (Fig. 5C).
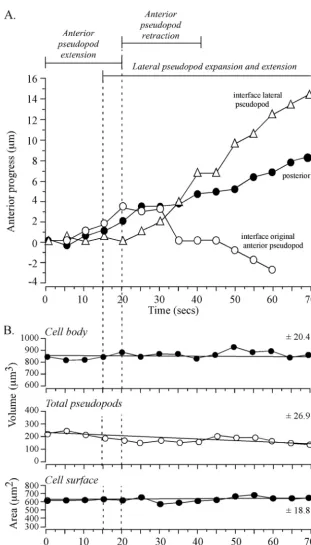
The interface between the original anterior pseudopod and cell body stopped tracking when this pseudopod stopped ex-tending and the lateral pseudopod began exex-tending (Fig. 5C). In Fig. 6A, anterior progress is plotted as a function of time for the interface of the original anterior pseudopod, the interface of the new lateral pseudopod, and the posterior tip of the cell body. The interface of the original anterior pseudopod tracked that pseudopod for a distance of 3 m and then regressed 7m during retraction (Fig. 5C and 6A). The interface asso-ciated with the new pseudopod began tracking when the inter-face of the old pseudopod stopped tracking (Fig. 5C and 6A). The posterior tip progressed anteriorly, while the interface of the original anterior pseudopod tracked that pseudopod and continued when the interface of the new anterior pseudopod began tracking (Fig. 5C and 6A). The posterior tip moved anteriorly at a slower speed than the interface of the new
FIG. 5. Motion analysis and 3D reconstruction of a representative cell that formed a lateral pseudopod and turned into it, causing a sharp left turn. The figure is set up in the same way as Fig. 2; see the legend to Fig. 2 for descriptions of the panels.
on September 8, 2020 by guest
http://ec.asm.org/
FIG. 6. Anterior progress of the interface of a new lateral pseudopod and progress of the posterior tip of a cell undergoing a sharp turn (⬃90°) are coordinated. While the new pseudopod is progressing away from the cell, the interface of the original anterior pseudopod moves in the opposite direction (toward the cell body) in the process of retraction. No dramatic changes in total pseudopod volume, cell body volume, or cell surface area correlate with formation, expansion, and extension of the new lateral pseudopod or with retraction of the old anterior pseudopod. The representative cell analyzed is the same one analyzed in Fig. 5. (A) Time plots of anterior progress of the interface of the new anterior pseudopod, the interface of the original (old) anterior pseudopod, and the posterior tip. Pseudopod dynamics are delineated at the top of the graph. (B) Time plots of cell body volume, total pseudopod volume, and cell surface area. Vertical dashed lines denote landmark events. The best-fit lines and the mean deviation from the line are presented for each of the three parameters analyzed.
VOL. 8, 2009 HOW A CELL CRAWLS 1387
on September 8, 2020 by guest
http://ec.asm.org/
anterior pseudopod (Fig. 6A), resulting in elongation of the main cell body (Fig. 5C), as was the case for the cell in Fig. 2. The trajectory of the new anterior pseudopod dictated the direction of the tracking interface, but it did not direct the trajectory of the posterior tip (Fig. 5C). The interface tracked the new pseudopod at a 90° angle, while the posterior tip followed the original anterior-posterior axis (Fig. 5B). The uropod shrank as it approached the turning point and was difficult to distinguish when it reached that point (data not shown). When it passed the turning point, it re-formed (data not shown). In the re-formation process, the junction between the main cell body and uropod reappeared along the new anterior-posterior axis, several microns anterior to the turning point (data not shown).
Through the sharp turn initiated between 15 and 30 s by the cell in Fig. 5, the collective volume of pseudopods, the volume of the cell body, and the surface area exhibited no associated change (Fig. 6B). There was, however, a slow decrease in the collective volume of pseudopods between 0 and 70 s, but no change in cell body volume or cell surface area (Fig. 6B). Similar results were obtained for three additional cells under-going sharp turns (data not shown).
Pseudopod retraction and the junction.We previously
pre-sented data suggesting that the position of a retracting pseu-dopod in a wild-type cell is fixed in relation to the substratum (59). This is evident in the time sequence of cell reconstruc-tions in Fig. 5, in which the original anterior pseudopod began to retract into the anterior half of the main cell body at 30 s but completed the process 65 s later in the posterior half of the cell body, without changing its position in relation to the substra-tum. Other morphological landmarks, such as remnants of anterior or lateral pseudopods that were not fully retracted (e.g., see the remnant of the original anterior pseudopod along the left flank of the cell in Fig. 2C) or bulges along the anterior flank of a cell (e.g., the bulge along the left flank of the cell in Fig. 5C) were also fixed in relation to the substratum. Taken together, these observations indicate that the cell body expands anteriorly at the interface and shrinks at the posterior end, while the intervening cell body remains fixed until posterior resorption.
In a majority of cases, resorption was completed just prior to the junction. Resorption did not continue along the uropod tip. This was evident in the retraction dynamics of the original anterior pseudopod of the representative cell in Fig. 5 and the remnant of the original anterior pseudopod on the left flank of the cell in Fig. 2C (final retraction not shown).
During pseudopod retraction, both the particulate-free re-gion of the pseudopod and the adjacent cell body with partic-ulate cytoplasm that had extended out behind that pseudopod were retracted into the main cell body. At the completion of retraction, the surface contour of the main cell body showed no indication of the prior pseudopod (Fig. 2C and 5C).
Uropod contact with the substratum.In models of migration
for bothD. discoideumamoebae and other cell types, it has been proposed that the rear of a cell detaches from the sub-stratum in order to retract anteriorly (17, 30, 45, 47, 58, 70, 81). Side views of the representative cells in Fig. 2 and 5, however, did not support this model. Except for the very most posterior tip, the ventral surface of the uropods of the two representative cells remained in contact with the substratum as the main cell
body and uropod translocated anteriorly (Fig. 2C and 5C). Of eight cells analyzed as in Fig. 3, the uropod of only one lost contact with the substratum, but even in that one case, the loss was temporary and not associated with a change in contour (data not shown).
Role of myosin II.It has been hypothesized that myosin II,
which localizes in the posterior cell cortex (4, 11, 32, 43, 49, 81), provides the contractile force for anterior translocation of the cell body and uropod (4, 7, 23, 33, 44, 65, 70, 82). For myosin II to localize to the cortex ofD.discoideum, it must polymerize, and to polymerize, the myosin II heavy chain (MhcA) must undergo dephosphorylation (13, 18, 19, 37, 42, 43). Phosphor-ylation-dephosphorylation occurs at three threonine residues in the MhcA tail. If myosin II provides the contractile force in the cortex for anterior translocation of the main cell body and uropod, then cells defective in assembling myosin II in their cortex should be defective in both behaviors. To test this pre-diction, we examined a mutant of D. discoideum, 3XASP, which expresses an MhcA that mimics a constitutively phos-phorylated state (i.e., it remains phosphos-phorylated and cannot be dephosphorylated). The incapacity to dephosphorylate the 3XASP MhcA causes defects in myosin II polymerization and cortical localization (19, 35). The 3XASP mutant was gener-ated by transforming the myosin null mutant line HS1 with a plasmid containing theMHCAopen reading frame (ORF) in which the three tail threonines were replaced with aspartic acid residues (19). The 3XASP derivative of theMHCAORF was under the regulation of the actin 15 promoter, and Western blots indicated that this 3XASP derivative was expressed at the same level as normal MHCAunder the control of its native promoter (19, 26). Quantitative comparisons of 3XASP cells were made with wild-type AX3 cells, since qualitative compar-isons showed no differences between AX3 cells and controls in which mhcA⫺ cells were complemented with the normal MHCAORF under the regulation of the actin 15 promoter, as was the case for the mutatedMHCAORF in 3XASP.
In fixed wild-type cells, staining with anti-myosin II antibody was enhanced in the cortex of the posterior half of the cell (Fig. 7A and B). Staining intensity was measured by optically sec-toring a cell by laser scanning confocal microscopy. A projec-tion image of the middle five secprojec-tions of a cell was then scanned for pixel intensity through a zigzag path shown in each image that crossed the cell 15 times, resulting in broad peaks representing the pixel intensity of the cell body along that zig or zag. The outer pixels of the broad peaks represented cortical staining. The average (⫾standard deviation) ratio of posterior to anterior cortical staining in wild-type cells was 1.6 ⫾ 0.2 (n⫽5). In fixed 3XASP cells, however, there was no enhanced staining in the posterior cortex (Fig. 7C and D). The average ratio of posterior to anterior cortical staining for the mutant was 1.0⫾0.2 (n⫽5).
3XASP cells had previously been shown by 2D-DIAS anal-yses to be capable of extending pseudopods and undergoing cellular translocation, demonstrating that normal cortical lo-calization of myosin II was not essential for these basic pro-cesses (27, 82). Several aspects of motility, however, proved to be defective. 3XASP cells translocated at half the speed of control cells, formed lateral pseudopods at far higher frequen-cies than those of the posterior half of the cell body, and turned more often (27, 82).
on September 8, 2020 by guest
http://ec.asm.org/
The representative 3XASP cell reconstructed in Fig. 8 trans-located in a directed fashion but with a higher frequency of sharp turns (Fig. 8A) than parental wild-type cells showed (Fig. 2A and 5A). It also underwent more complex changes in con-tour (Fig. 8B and C). At 0 s, it abnormally possessed four pseudopods which were not in contact with the substratum (Fig. 8C). The pseudopod to the viewer’s left dropped to the substratum at 10 s, and at 30 s, it expanded and extended along the substratum, undergoing complex shape changes (Fig. 8C). This pseudopod assumed the role of the new anterior pseudo-pod. Between 70 and 80 s, this pseudopod lifted off the sub-stratum, and during the subsequent 50 s (80 to 130 s), it extended anteriorly off the substratum (Fig. 8C). Between 130 and 140 s, it descended to the substratum, and a new lateral pseudopod formed at a 45° angle from the left flank of the cell, just behind the previous anterior pseudopod (Fig. 8C). As this new lateral pseudopod extended, the preceding anterior pseu-dopod retracted into the cell body (Fig. 8C).
Between 10 and 50 s, the interface tracked the anterior pseudopod at a relatively constant rate, but between 55 and
75 s, the rate increased and then returned to the original value (Fig. 9A). In contrast, the posterior tip translocated anteriorly at a relatively constant rate between 0 and 55 s and then at a decreased but constant rate after 55 s (Fig. 9A). Transient velocity surges of pseudopod and interface were observed in three additional 3XASP cells similarly analyzed (data not shown). As was the case for control cells, no dramatic changes in total pseudopod volume, cell body volume, or cell surface correlated with the expansion and then extension of the ante-rior pseudopod at 20 s (Fig. 9B). There was, however, a slow and relatively constant decrease in the three parameters over the 200 min of analysis (Fig. 9B).
Defects in uropod formation and cytoplasmic distribution in
3XASP cells.3XASP cells exhibited defects both in forming a
tapered uropod and in maintaining anterior distribution of cytoplasm in the cell body during cellular translocation. For the representative 3XASP cell in Fig. 8C, the posterior end of the cell, which could be deduced from the previous direction of translocation and the position of tail fibers (not reconstructed here), was blunt, even when both the interface and posterior
FIG. 7. Myosin II is localized in the posterior cortex of wild-type cells, but not in the posterior cortex of mutant 3XASP cells. Cells were stained with anti-myosin II antibody and optically sectioned in thezaxis by laser scanning confocal microscopy. A projection image derived from the center of section 5 was then scanned for pixel intensity using a zigzag track that crossed the cell 15 times. When the intensity scan crossed the cell, a broad peak of pixel intensities was generated. When it moved outside the cell, a trough of low-level pixel intensity was generated. It is the pixel intensities at the edges of each broad peak that represent cortical regions. For each cell, the average (avg.) cortical intensities (i.e., the average intensities of the outside pixels of the broad peaks) for the anterior (a) and posterior (p) halves of the cell, the ratio of the posterior to anterior values, and thepvalues for significance are shown. Representative wild-type cells (A and B) and representative 3XASP cells (C and D) are shown.
VOL. 8, 2009 HOW A CELL CRAWLS 1389
on September 8, 2020 by guest
http://ec.asm.org/
ends of the cell progressed in unison anteriorly (e.g., between 10 and 130 s) (Fig. 8C). Side views of the representative 3XASP cell revealed a relatively box-shaped cell body (Fig. 8C), in stark contrast to the longer, flatter cell body of parental cells (Fig. 2C and 5C). Furthermore, when the dominant pseu-dopod of the representative 3XASP cell surged anteriorly be-tween 55 and 75 s, the bulk of the cytoplasm, which was initially distributed equally along the anterior-posterior axis of the cell body, was left behind (Fig. 8C). Then, between 130 and 190 s, the bulk of the cytoplasm rapidly redistributed anteriorly, gen-erating a cell body with a bulging anterior half and an abnor-mally elongate, untapered posterior half (Fig. 8C). Similar
aberrant behavior was observed in three additional 3XASP cells similarly analyzed (data not shown).
The abnormal changes in the distribution of cytoplasm of 3XASP cells were evident when the volumes of the anterior and posterior halves of a cell were plotted as a function of time. For the representative wild-type cell, the volume of the ante-rior half remained approximately twice that of the posteante-rior half through the entire period of analysis (Fig. 10A). In marked contrast, the volume of the anterior half of the 3XASP cell in Fig. 7 was equal to that of the posterior half between 15 and 55 s (data not shown), then decreased to half that of the posterior half between 55 and 115 s, and finally increased to
FIG. 8. Motion analysis and 3D reconstruction of a representative 3XASP cell. The figure is set up in the same way as Fig. 2; see the legend to Fig. 2 for descriptions of the panels.
on September 8, 2020 by guest
http://ec.asm.org/
more than twice that of the posterior half between 125 and 195 s (Fig. 10B). The decrease in anterior volume coincided with the anterior surge in pseudopod extension. Similar dy-namics were observed in qualitative analyses of three addi-tional 3XASP cells. In contrast, qualitative analyses of com-plemented controls in which mhcA⫺cells were transformed with the wild-type MHCA ORF under the regulation of the actin 15 promoter, revealed that they behaved similarly to AX3 cells (data not shown). These results indicate that cortical myosin plays a role in the formation and maintenance of the uropod and in maintaining the bulk of the cytoplasm in the anterior half of the cell body.
Aberrant pseudopod retraction in 3XASP cells. Because
3XASP cells did not maintain a uropod, they lacked the junc-tion that normally formed between the main cell body and uropod. Since the junction appeared to represent the site at which pseudopods, pseudopod remnants, and bulges com-pleted retraction, we examined how pseudopods were re-tracted in 3XASP cells. The representative 3XASP cell recon-structed in Fig. 8C possessed three pseudopods in addition to the one that assumed the role of anterior pseudopod at the
beginning of analysis. These three pseudopods shrank as they gradually relocated posteriorly, but they did not disappear (Fig. 8C) as lateral pseudopods did at the junction of wild-type cells (Fig. 5C). Rather, remnants of the pseudopods of 3XASP cells accumulated at the blunt posterior end of the cell body, eventually coalescing to form an abnormal terminal region lacking particulate cytoplasm (Fig. 8C). This abnormal retrac-tion scenario was observed in three addiretrac-tional 3XASP cells similarly analyzed (data not shown).
Cells can translocate on the uropod alone.In a recent
anal-ysis of the effect of extracellular Ca2⫹on motility, it was
dem-onstrated that in Tricine buffer containing ⬎40 mM CaCl2, cells adhered to the glass substratum solely by their uropod (47). This provided a unique opportunity to test whether the uropod alone could support translocation. In Fig. 11A, in-focus optical sections obtained at the substratum through differential interference contrast microscopy are presented for a cell in Tricine buffer containing 80 mM CaCl2. Only the uropod was in focus and therefore in contact with the substratum through-out the time series. In Fig. 11B and C, 3D reconstructions are presented at time intervals of this cell, viewed from the top
FIG. 9. Anterior progress of the interface of the anterior pseudopod and progress of the posterior end of a 3XASP cell are coordinated. No dramatic changes in total pseudopod volume, cell body volume, or cell surface correlate with expansion, extension, or retraction of the anterior pseudopod or with formation of a new lateral pseudopod. The figure is set up in the same way as Fig. 4, except that landmark tracks are not plotted; see the legend to Fig. 4 for descriptions of the panels.
VOL. 8, 2009 HOW A CELL CRAWLS 1391
on September 8, 2020 by guest
http://ec.asm.org/
(90°) or from the side (0°), respectively. Translocation tracks of the posterior tip of the cell are presented as dotted lines in each of the three presentations. These tracks revealed that over the 135 s of analysis, this cell migrated, and it did so in the general direction of the anterior pseudopod (Fig. 11B and C). The average velocity of this representative cell was 7m per min. Two additional wild-type cells in 80 mM CaCl2analyzed in a similar fashion exhibited similar uropod-based motility (data not shown). In contrast to wild-type cells, 3XASP cells treated with 80 mM CaCl2did not translocate and did not form
a uropod. Taken together, these data demonstrate that the uropod alone is capable of supporting persistent translocation.
DISCUSSION
This 4D analysis has revealed a number of general charac-teristics ofD.discoideumtranslocation in the absence of che-moattractant under a single set of conditions. Some of these characteristics had been noted previously from 2D analysis, but many are new. The characteristics are as follows. (i) A trans-locating cell can be separated into three basic compartments, the pseudopods, the main cell body, and the uropod. Support for this separation can also be found in a variety of earlier experiments. For example, traction stresses computed from bead displacement on an elastic substratum showed stress within the main cell body, but not the uropod (28). Fukui et al. (22) labeled F-actin flow and identified a unique compartment in the uropod where F-actin converged, and Jay and Elson (29)
showed that the velocity of beads attached to the dorsal surface changed when the beads reached the uropod. (ii) A translo-cating cell extends both anterior and lateral pseudopods, the latter primarily from the flanks of the previous anterior pseu-dopod (2) or the main cell body (2, 74, 79, 80). New pseudo-pods rarely form from the uropod. (iii) A cell moves in a cyclic fashion, with an average periodicity of 1.5 min between velocity peaks (76). Each translocation phase is initiated by reextension of a new pseudopod. (iv) At any one time, a pseudopod is expanding or extending on or off the substratum. When a lateral pseudopod extends away from the cell body, it assumes the role of new anterior pseudopod, causing a turn at an angle to the original cell axis. (v) When a lateral pseudopod assumes the role of new anterior pseudopod, the preceding anterior pseudopod is retracted back into the cell body. (vi) During retraction, a pseudopod remains spatially fixed in relation to the substratum (59), decreasing in volume as the cell body literally crawled by it. (vii) Newly formed pseudopods expand to maximum volume and then extend anteriorly, maintaining a relatively constant volume during extension. (viii) Abrupt changes in the collective volume of all pseudopods do not occur concurrently with pseudopod formation, expansion, ex-tension, or retraction. In addition, no abrupt changes in the cell body volume or cell surface area occur concurrently with these landmark behaviors. (ix) When a pseudopod begins to extend anteriorly, the interface between it and the main cell body tracks it, thus playing a role in the maintenance of relatively constant pseudopod volume. (x) Retraction of a pseudopod is
FIG. 10. In wild-type cells, the bulk of the cytoplasm is maintained anteriorly as the cell translocates, but in 3XASP cells, the distribution relocates transiently to the posterior half of the cell body. (A) The volume of the anterior and posterior half of a representative wild-type cell over time (shown in seconds). (B) The volume of the anterior and posterior halves of a representative 3XASP cell over time. The line through the reconstruction of the cell at each time point delineates the anterior (dark gray) and posterior (light gray) halves of the cell body. The pseudopods are color coded black.
on September 8, 2020 by guest
http://ec.asm.org/
complete by the time the anteriorly translocating junction reaches it. (xi) The bulk of cytoplasm remain in the anterior half of the cell body regardless of pseudopod dynamics. (xii) When the interface tracks an extending pseudopod, the poste-rior end of the cell moves with it anteposte-riorly in a coordinated fashion. (xiii) Anterior progress of the posterior end of a cell is slower than that of the pseudopod tip and interface, leading to a slight increase in cell length during the translocation phase of the motility cycle. (xiv) The interface moves in the direction of an extending anterior pseudopod, whereas the posterior tip of a cell moves along the anterior-posterior axis established during the preceding translocation phase. This leads to a bend between the prior cell axis and the newly developing cell axis. This excludes stepwise models in which the cell body translo-cates anteriorly and the uropod does so afterwards. (xv) Cells make sharp turns through extension of a lateral pseudopod at an approximately 90° angle (72, 73, 76). As the lateral pseu-dopod and its interface extends, the new cell body forms
be-hind it. During a sharp turn, when the uropod nears the turning point, its volume decreases, and when the posterior tip reaches the turning point, the uropod and junction re-form along the new cell axis, on the other side of the original turning point. (xvi) There are no obvious coordinated shape changes in the uropod and expanding pseudopod that would suggest that ep-isodic contractions in the rear of the cell drive formation, expansion, or extension. (xvii) Both the main cell body and uropod usually adhere to the substratum as both progressed anteriorly, which is not consistent with models in which the posterior end has to release from the substratum to facilitate posterior contraction (1, 4, 7, 13, 40, 44, 58, 82). (xviii) Finally, a uropod alone can drive cellular translocation along a sub-stratum.
These characteristics suggest a more complex model in which each of the three general compartments, the pseudo-pods, the main cell body, and the uropod, may each have a unique motility mechanism. They suggest that the three
motil-FIG. 11. Cells can translocate anteriorly in a persistent fashion when adhering to the substrate only by their uropod. Cells were incubated in Tricine buffer containing 80 mM CaCl2, which has been shown to block selectively adhesion to a substratum by the main cell body and anterior
pseudopod, but not adhesion of the uropod (46). (A) Track of the posterior tip of a representative cell imaged through differential interference contrast optics at the substratum. (B) Track of the posterior tip of 3D reconstructions observed from on top (90°). (C) Track of the posterior tip of 3D reconstructions observed from the side (0°). The original position (asterisk) and translocation track (dotted line) of the posterior tip are indicated. s, seconds.
VOL. 8, 2009 HOW A CELL CRAWLS 1393
on September 8, 2020 by guest
http://ec.asm.org/
ity processes must be highly coordinated to achieve efficient cellular translocation.
Pseudopod extension, expansion, and retraction and volume
homeostasis.There is a consensus that protrusion of a
pseu-dopod is based in part upon actin polymerization and cross-linking (10, 53, 54, 68). We found no evidence to indicate that protrusive forces provided by episodic posterior contractions drove pseudopod formation, expansion, or extension. This was reinforced by the observation that when a new anterior pseu-dopod expanded and extended, the prior anterior pseupseu-dopod retracted back into the cell body. If protrusive forces from the posterior cortex were at play, then one would have expected simultaneous expansion of all pseudopods, not simultaneous extension and retraction. Expansion and extension of pods, therefore, appear to be intrinsic properties of a pseudo-pod, presumably driven by localized actin polymerization and cross-linking (9, 41, 60), not by posterior contraction. Indeed, we found that in many cases a pseudopod formed and grew to maximum volume without a change in uropod shape or loca-tion. Treadmilling, with polymerization (p) at the distal edge and depolymerization (d) at the proximal edge (the interface) (31, 41, 55), would explain both expansion, extension, volume homeostasis, and retraction. Whenpwas⬎d, the pseudopod expands. Whenpequalsd, the pseudopod extends without a change in volume. When p was ⬍d, the pseudopod shrinks during retraction.
The relative stability of collective pseudopod volume pre-dicts the existence of at least one volume-limiting component, possibly regulating the extent of total actin polymerization among pseudopods, and therefore, this component must travel between old and new pseudopods through the particulate cy-toplasm. That component could be the pool of actin monomers or an actin accessory protein (40, 53). Because homeostasis involves the expansion of one pseudopod at the expense of another, the possibilities that the rate-limiting component(s) regulates treadmilling and that its exit from one pseudopod leads to a change in the balance of polymerization and depo-lymerization, favoring the latter in the exited pseudopod, must be entertained. In addition, the mechanism of homeostasis involves tracking by the interface. With time, we observed slow but constant increases or decreases in collective pseudopod volume, but we never observed a dramatic change that corre-lated temporally with pseudopod formation, expansion, exten-sion, or retraction.
Main cell body translocation.The main cell body was
bor-dered by the interface and junction and appeared to behave differently from either the pseudopods or uropod. Fukui and coworkers (21) observed that the interface between pseudopod and cell body inD. discoideumamoebae stained for both F-actin and myosin II, leading to the suggestion that a filamen-tous lattice at the interface excluded organelles and vesicles from entering pseudopods and disrupting the F-actin gel. The junction marks the transition between the main cell body and the uropod and functions as a sink for retracting pseudopods. The cell body is distinct from the uropod both in the context of cortical myosin and in its capacity to form lateral pseudopods. Between the interface and junction, retracting pseudopods, pseudopod remnants, and bulges are spatially fixed in relation to the substrate until resorption is complete at the junction. In contrast, the tail fibers at the end of the uropod show a high
degree of stability (27). This leads to a model in which the main cell body translocates by expansion at the interface and ab-sorption at the junction with the intervening cell cortex stable and spatially fixed until resorption occurs at the junction. This is reinforced by the trajectories of the interface and junction during soft or sharp turns. In both cases, the interface and, therefore, the extending main cell body follow the trajectory of the new anterior pseudopod, whereas the junction follows the trajectory of the previously established anterior-posterior axis of the cell body established. In support of the model, Iwadate and Yumura (28) found that cells translocated in a direction opposite the rearward sum of force vectors measured at the ventral surface of the cell. The behavior of the myosin II mutant 3XASP also supports the model. These cells do not form a stable uropod, yet the cell body can still translocate in a relatively persistent and directed fashion, which suggests that the cell can lose one of the motility compartments and still translocate.
Translocation of the uropod. Although we initially
consid-ered the uropod and main cell body a single motile entity, especially since there was no visible cytoplasmic barrier be-tween the two as was the case at the interface (21), evidence has accumulated in other systems that a variety of molecules specifically localize in the uropod (12, 38, 45). Here we have identified several characteristics that also support the individ-uality of the uropod. First, there was a visible contour change at the junction between the uropod and the main cell body. Second, the uropod had a tapered shape quite distinct from the main cell body and contained far less cytoplasm. Third, pseu-dopods did not form along the tapered uropod. Fourth, re-tracting pseudopods and surface remnants completed resorp-tion at the juncresorp-tion. Retracresorp-tion did not continue along the uropod. Fifth, filopodia had to migrate to the uropod to be-come stable tail fibers (27). Sixth, myosin II localized dispro-portionately in the cortex of the uropod. Seventh, the uropod surface contained Ca2⫹-resistant adhesion sites, whereas the
main cell body lacked them (46). A few of these traits have been alluded to in more qualitative analyses of T-cell migration (16). Perhaps the most interesting observation made here is that a cell that adhered to the substratum only by its uropod could translocate in a persistent fashion in the direction of the anterior pseudopod, even though the anterior pseudopod and main cell body were not in contact with the substratum. There-fore, the uropod alone was sufficient to drive cellular translo-cation in a persistent and directed fashion along a surface. The speed of uropod-driven translocation was, however, approxi-mately half that of cells for which the main cell body and uropod adhered to the substratum (46). Interestingly, the sum of the translocation speeds of a cell attached to a substratum only by its main cell body (i.e., 3XASP cells) and a cell attached only by its uropod (i.e., a wild-type cell in 80 mM CaCl2) was equal to the speed of a cell attached to the substratum by the main cell body and uropod, suggesting additivity.
Although we have hypotheses for pseudopods and the main cell body, we have no hypothesis for how a uropod alone can move along a substratum in a persistent and directed fashion. Because of the stability of tail fibers, which most likely contain actin filaments contiguous with the cortical cytoskeleton (67), it seems unlikely that a cortical sink for depolymerization and absorption exists at the posterior end of a uropod, as has been
on September 8, 2020 by guest
http://ec.asm.org/
demonstrated for actin filaments at the proximal ends of pseu-dopods (i.e., the interface) and as we have hypothesized for the cortical cytoskeleton at the posterior end of the main cell body (i.e., at the junction).
Role of myosin II.To assess the role of cortical localization
of myosin II in basic motile behavior, we analyzed the mutant 3XASP, which expresses a myosin II heavy chain that mimics a constitutively phosphorylated state (i.e., it cannot undergo de-phosphorylation), resulting in underassembly of myosin II in the cell cortex (19) with the interface. 3XASP cells exhibited many of the characteristics of wild-type cells. They formed pseudopods and maintained a relatively stable collective pseu-dopod volume, even though they formed on average twice as many pseudopods as wild-type cells did. During extension of each pseudopod, the interface tracked the pseudopod, and the posterior end of the cell translocated anteriorly in a coordinate fashion. 3XASP cells, however, did not maintain a tapered uropod and during cellular translocation exhibited an abnor-mal change in the distribution of cytoplasm in the main cell body. The cytoplasm was left posteriorly when a pseudopod rapidly extended anteriorly but then rapidly relocated anteri-orly, leaving a posteriorly narrow, untapered tail that was tran-sient and morphologically distinct from a uropod. Resorption of lateral pseudopods and surface remnants was also defective in 3XASP cells, because they lacked a junction. Retracting pseudopods and remnants ended up at the posterior end of a 3XASP cell, where they coalesced into an abnormal particle-free region. This result reinforces the suggestion that the junc-tion plays a specific role in resorpjunc-tion and defines the anterior boundary of the normal uropod. Interestingly, the tail fibers normally located at the posterior end of a uropod (26) were still present at the posterior end of a 3XASP cell lacking a discernible uropod (D. Wessels and D. R. Soll, unpublished observations), indicating that the posterior end of a cell main-tained its identity in the absence of a tapered uropod. To-gether, these results indicate that the localization of myosin II in the cortex of the uropod is necessary for achieving maximum velocity, suppressing lateral pseudopod formation, maintaining normal cell morphology, maintaining normal cytoplasmic dis-tribution along the anterior-posterior axis, and forming a func-tional uropod. We suggest that all of these functions may depend upon the cortical tension generated by myosin II, a motor molecule, in the posterior cell cortex (20, 39, 51, 75, 82).
Concluding remarks.The 4D description of the basic motile
behavior ofD.discoideumamoebae presented here provides a contextual framework for developing models of motility, inter-preting behavioral defects of mutants, deducing the roles cy-toskeletal and regulatory molecules play in motility, and de-termining how chemotactic gradients manipulate basic motile behavior. Studies are now in progress to test which of the characteristics ofD.discoideummotility hold true for other cell types, most notably human polymorphonuclear leukocytes (48, 66), and how they are manipulated by spatial and temporal gradients of the chemoattractant cyclic AMP (63).
ACKNOWLEDGMENTS
This work was supported by NIH grant HD-18577 and the Devel-opmental Studies Hybridoma Bank at the University of Iowa.
We acknowledge the use of the W. M. Keck Dynamic Image Anal-ysis Facility at the University of Iowa. We thank Arturo De Lozanne
for providing the myosin II antibody and Thomas Egelhoff for provid-ing the 3XASP strains.
REFERENCES
1.Ananthakrishnan, R., and A. Ehrlicher.2007. The forces behind cell move-ment. Int. J. Biol. Sci.3:303–317.
2.Andrew, N., and R. H. Insall. 2007. Chemotaxis in shallow gradients is mediated independently of PtdIns 3-kinase by biased choices between ran-dom protrusions. Nat. Cell Biol.9:193–200.
3.Bonner, J. T., D. S. Barkley, E. M. Hall, T. M. Konijn, J. W. Mason, G. O’Keefe III, and P. B. Wolfe.1969. Acrasin, acrasinase, and the sensitivity to acrasin inDictyostelium discoideum. Dev. Biol.20:72–87.
4.Bosgraaf, L., and P. J. van Haastert.2006. The regulation of myosin II in
Dictyostelium. Eur. J. Cell Biol.85:969–979.
5.Bottino, D., A. Mogilner, T. Roberts, M. Stewart, and G. Oster.2002. How nematode sperm crawl. J. Cell Sci.115:367–384.
6.Bray, D.2001. Cell movements: from molecules to motility. Taylor & Fran-cis, New York, NY.
7.Catalano, A., and D. H. O’Day.2008. Calmodulin-binding proteins in the model organismDictyostelium: a complete and critical review. Cell. Signal.
20:277–291.
8.Clow, P. A., and J. G. McNally.1999.In vivoobservations of myosin II dynamics support a role in rear retraction. Mol. Biol. Cell10:309–323. 9.Condeelis, J., A. Hall, A. Bresnick, V. Warren, R. Hock, H. Bennett, and S.
Ogihara.1988. Actin polymerization and pseudopod extension during amoe-boid chemotaxis. Cell Motil. Cytoskelet.10:77–90.
10.Condeelis, J.1998. The biochemistry of animal cell crawling, p. 85–100.In
D. R. Soll and D. Wessels (ed.), Motion analysis of living cells. Wiley-Liss, Inc., New York, NY.
11.Conti, M. A., and R. S. Adelstein.2008. Nonmuscle myosin II moves in new directions. J. Cell Sci.121:11–18.
12.Cooper, K. M., D. A. Bennin, and A. Huttenlocher.2008. The PCH family member proline-serine-threonine phosphatase-interacting protein 1 targets to the leukocyte uropod and regulates directed cell migration. Mol. Biol. Cell
19:3180–3191.
13.De la Roche, M. A., J. L. Smith, V. Betapudi, T. T. Egelhoff, and G. P. Coˆte.
2002. Signaling pathways regulatingDictyosteliummyosin II. J. Muscle Res. Cell Motil.23:703–718.
14.Dinauer, M. C., S. A. MacKay, and P. N. Devreotes.1980. Cyclic 3⬘,5⬘-AMP relay inDictyostelium discoideumIII. The relationship of cAMP synthesis and secretion during the cAMP signaling response. J. Cell Biol.86:537–544. 15.Dumstrei, K., R. Mennecke, and E. Raz.2004. Signaling pathways controlling
primordial germ cell migration in zebrafish. J. Cell Sci.117:4787–4795. 16.Dustin, M. L.2002. Membrane domains and the immunological synapse:
keeping T cells resting and ready. J. Clin. Investig.109:155–160. 17.Eddy, R. J., L. M. Pierini, F. Matsumura, and F. R. Maxfield.2000. Ca2⫹
-dependent myosin II activation is required for uropod retraction during neutrophil migration. J. Cell Sci.113:1287–1298.
18.Egelhoff, T. T., S. S. Brown, and J. A. Spudich.1991. Spatial and temporal control of nonmuscle myosin localization: identification of a domain that is necessary for myosin filament disassemblyin vivo. J. Cell Biol.112:677–688. 19.Egelhoff, T. T., R. J. Lee, and J. A. Spudich.1993.Dictyosteliummyosin heavy chain phosphorylation sites regulate myosin filament assembly and localiza-tion in vivo. Cell75:363–371.
20.Egelhoff, T. T., T. V. Naismith, and F. V. Brozovich.1996. Myosin-based cortical tension inDictyosteliumresolved into heavy and light chain-regu-lated components. J. Muscle Res. Cell Motil.17:269–274.
21.Fukui, Y., J. Murray, K. S. Riddelle, and D. R. Soll.1991. Cell behavior and actomyosin organization inDictyosteliumduring substrate exploration. Cell Struct. Funct.16:289–301.
22.Fukui, Y., T. Kitanishi-Yumura, and S. Yumura.1999. Myosin II-indepen-dent F-actin flow contributes to cell locomotion inDictyostelium. J. Cell Sci.
112:877–886.
23.Fukui, Y.2002. Mechanistics of amoeboid locomotion: signal to forces. Cell. Biol. Int.26:933–944.
24.Grebecki, A.1994. Membrane and cytoskeleton flow in motile cells with emphasis on the contribution of free-living amoebae. Int. Rev. Cytol.148:
37–80.
25.Heid, P. J., E. Voss, and D. R. Soll.2002. 3D-DIASemb: a computer-assisted system for reconstructing and motion analyzing in 4D every cell and nucleus in a developing embryo. Dev. Biol.245:329–347.
26.Heid, P. J., D. Wessels, K. J. Daniels, P. Gibson, H. Zhang, E. Voss, and D. R. Soll.2004. The role of myosin heavy chain phosphorylation in Dictyo-steliummotility, chemotaxis and F-actin localization. J. Cell Sci.117:4819– 4835.
27.Heid, P. J., J. Geiger, D. Wessels, E. Voss, and D. R. Soll.2005. Computer-assisted analysis of filopod formation and the role of myosin II heavy chain phosphorylation inDictyostelium. J. Cell Sci.118:2225–2237.
28.Iwadate, Y., and S. Yumura.2008. Actin-based propulsive forces and myosin-II-based contractile forces in migratingDictyosteliumcells. J. Cell Sci.121:
1314–1324.
VOL. 8, 2009 HOW A CELL CRAWLS 1395
on September 8, 2020 by guest
http://ec.asm.org/
29.Jay, P. Y., and E. L. Elson.1992. Surface particle transport mechanism independent of myosin II inDictyostelium. Nature356:438–440.
30.Jay, P. Y., P. A. Pham, S. A. Wong, and E. L. Elson.1995. A mechanical function of myosin II in cell motility. J. Cell Sci.108:387–393.
31.Keren, K., Z. Pincus, G. M. Allen, E. L. Barnhart, G. Marriott, A. Mogilner, and J. A. Theriot.2008. Mechanism of shape determination in motile cells. Nature453:475–480.
32.Knecht, D. A., and E. Shelden.1995. Three-dimensional localization of wild-type and myosin II mutant cells during morphogenesis ofDictyostelium. Dev. Biol.170:434–444.
33.Koehl, G., and J. G. McNally.2002. Myosin II redistribution during rear retraction and the role of filament assembly and disassembly. Cell. Biol. Int.
26:287–296.
34.Kolega, J.2006. The role of myosin II motor activity in distributing myosin asymmetrically and coupling protrusive activity to cell translocation. Mol. Biol. Cell17:4435–4445.
35.Kolman, M. F., L. M. Futey, and T. T. Egelhoff.1996.Dictyosteliummyosin heavy chain kinase A regulates myosin localization during growth and de-velopment. J. Cell Biol.132:101–109.
36.Kolsch, V., P. G. Charest, and R. A. Firtel.2008. The regulation of cell motility and chemotaxis by phospholipid signaling. J. Cell Sci.121:551–559. 37.Kuczmarski, E. R., and J. A. Spudich.1980. Regulation of myosin self-assembly: phosphorylation ofDictyosteliumheavy chain inhibits formation of thick filaments. Proc. Natl. Acad. Sci. USA77:7292–7296.
38.Lacalle, R. A., R. M. Peregil, J. P. Albar, E. Merino, A. C. Martinez, I. Merida, and S. Manes.2007. Type I phosphatidylinositol 4-phosphate 5-ki-nase controls neutrophil polarity and directional movement. J. Cell Biol.
179:1539–1553.
39.Laevsky, G., and D. A. Knecht.2003. Cross-linking of actin filaments by myosin II is a major contributor to cortical integrity and cell motility in restrictive environments. J. Cell Sci.116:3761–3770.
40.Lauffenburger, D. A., and A. F. Horwitz.1996. Cell migration: a physically integrated molecular process. Cell84:359–369.
41.Le Clainche, C., and M. F. Carlier. 2008. Regulation of actin assembly associated with protrusion and adhesion in cell migration. Physiol. Rev.
88:489–513.
42.Lee, R. J., T. T. Egelhoff, and J. A. Spudich.1994. Molecular genetic trun-cation analysis of filament assembly and phosphorylation domains of Dic-tyosteliummyosin heavy chain. J. Cell Sci.107:2875–2886.
43.Levi, S., M. V. Polyakov, and T. T. Egelhoff.2002. Myosin II dynamics in
Dictyostelium: determinants for filament assembly and translocation to the cell cortex during chemoattractant responses. Cell Motil. Cytoskelet.53:177– 188.
44.Li, S., J. L. Guan, and S. Chien.2005. Biochemistry and biomechanics of cell motility. Annu. Rev. Biomed. Eng.7:105–150.
45.Lokuta, M. A., M. A. Senetar, D. A. Bennin, P. A. Nuzzi, K. T. Chan, V. L. Ott, and A. Huttenlocher.2007. Type Igamma PIP kinase is a novel uropod component that regulates rear retraction during neutrophil chemotaxis. Mol. Biol. Cell18:5069–5080.
46.Lusche, D. F., D. Wessels, and D. R. Soll.2009. The effects of extracellular calcium on motility, chemotaxis and the cortical localization of myosin II in
Dictyostelium. Cell Motil. Cytoskelet.66:567–587.
47.Morin, N. A., P. W. Oakes, Y. M. Hyun, D. Lee, Y. E. Chin, M. R. King, T. A. Springer, M. Shimaoka, J. X. Tang, J. S. Reichner, and M. Kim.2008. Nonmuscle myosin heavy chain IIA mediates integrin LFA-1 de-adhesion during T lymphocyte migration. J. Exp. Med.205:195–205.
48.Murray, J., H. Vawter-Hugart, E. Voss, and D. R. Soll.1992. Three-dimen-sional motility cycle in leukocytes. Cell Motil. Cytoskelet.22:211–223. 49.Nachmias, V. T., Y. Fukui, and J. A. Spudich.1989. Chemoattractant-elicited
translocation of myosin in motileDictyostelium. Cell Motil. Cytoskelet.13:
158–169.
50.Parent, C. A.2004. Making all the right moves: chemotaxis in neutrophils andDictyostelium. Curr. Opin. Cell Biol.16:4–13.
51.Pasternak, C., J. A. Spudich, and E. L. Elson.1989. Capping of surface receptors and concomitant cortical tension are generated by conventional myosin. Nature341:549–551.
52.Philippar, U., E. Roussos, M. Oser, H. Yamaguchi, H.-D. Kim, S. Giampieri, Y. Wang, S. Goswami, J. B. Wyckoff, D. Lauffenburger, E. Sahai, J. S. Condeelis, and F. B. Gertler.2008. A Mena invasion isoform potentiates EGF-induced carcinoma cell invasion and metastasis. Dev. Cell15:813–828. 53.Pollard, T. D., and G. G. Borisy.2003. Cellular motility driven by assembly
and disassembly of actin filaments. Cell112:453–465.
54.Rafelski, S. M., and J. A. Theriot.2004. Crawling toward a unified model of cell mobility: spatial and temporal regulation of actin dynamics. Annu. Rev. Biochem.73:209–239.
55.Schaus, T. E., and G. G. Borisy.2008. Performance of a population of independent filaments in lamellipodial protrusion. Biophys. J.95:1393–1411. 56.Seravin, L. N., and A. V. Gudkov.2005. Amoeboid properties of cells during
early morphogenesis and the nature of a possible protozoan ancestor of Metazoa. Zh. Obshch. Biol.66:212–223. (In Russian.)
57.Servant, G., O. D. Weiner, P. Herzmark, T. Balla, J. W. Sedat, and H. R. Bourne.2000. Polarization of chemoattractant receptor signaling during neutrophil chemotaxis. Science287:1037–1040.
58.Sheetz, M. P., D. Felsenfeld, C. G. Galbraith, and D. Choquet.1999. Cell migration as a five-step cycle. Biochem. Soc. Symp.65:233–243.
59.Shutt, D. C., D. Wessels, K. Wagenknecht, A. Chandrasekhar, A. L. Hitt, E. J. Luna, and D. R. Soll.1995. Ponticulin plays a role in the positional stabilization of pseudopods. J. Cell Biol.131:1495–1506.
60.Sidani, M., D. Wessels, G. Mouneimne, M. Ghosh, S. Goswami, C. Sar-miento, W. Wang, S. Kuhl, M. El-Sibai, J. M. Backer, R. Eddy, D. Soll, and J. Condeelis.2007. Cofilin determines the migration behavior and turning frequency of metastatic cancer cells. J. Cell Biol.179:777–791.
61.Soll, D. R.1995. The use of computers in understanding how animal cells crawl. Int. Rev. Cytol.163:43–104.
62.Soll, D. R., and E. Voss.1998. Two and three dimensional computer systems for analyzing how cells crawl, p. 25–52.InD. R. Soll and D. Wessels (ed.), Motion analysis of living cells. Wiley-Liss, Inc., New York, NY.
63.Soll, D. R., D. Wessels, P. J. Heid, and H. Zhang. 2002. A contextual framework for characterizing motility and chemotaxis mutants in Dictyoste-lium discoideum. J. Muscle Res. Cell Motil.23:659–672.
64.Soll, D. R., E. Voss, D. Wessels, and S. Kuhl.2007. Computer-assisted systems for dynamic 3D reconstruction and motion analysis of living cells, p. 365–384.InS. Shorte (ed.), Cell motility. Springer Verlag, Berlin, Germany. 65.Spudich, J. A.1989. In pursuit of myosin function. Cell Regul.1:1–11. 66.Stepanovic, V., D. Wessels, F. D. Goldman, J. Geiger, and D. R. Soll.2004.
The chemotaxis defect of Shwachman-Diamond syndrome leukocytes. Cell Motil. Cytoskel.57:158–174.
67.Svitkina, T. M., E. A. Bulanova, O. Y. Chaga, D. M. Vignjevic, S. Kojima, J. M. Vasiliev, and G. G. Borisy.2003. Mechanism of filopodia initiation by reorganization of a dendritic network. J. Cell Biol.160:409–421. 68.Theriot, J. A., and T. J. Mitchison.1991. Actin microfilament dynamics in
locomoting cells. Nature352:126–131.
69.Tomchik, K. J., and P. N. Devreotes.1981. Adenosine 3⬘,5⬘-monophosphate waves inDictyostelium discoideum: a demonstration by isotope dilution– fluorography. Science212:443–446.
70.Uchida, K. S., T. Kitanishi-Yumura, and S. Yumura.2003. Myosin II con-tributes to the posterior contraction and the anterior extension during the retraction phase in migratingDictyosteliumcells. J. Cell Sci.116:51–60. 71.Varnum, B., and D. R. Soll.1984. Effects of cAMP on single cell motility in
Dictyostelium. J. Cell Biol.99:1151–1155.
72.Varnum-Finney, B., K. Edwards, E. Voss, and D. R. Soll.1987. Amoebae of
Dictyostelium discoideumrespond to an increasing temporal gradient of the chemoattractant cAMP with a reduced frequency of turning: evidence for a temporal mechanism in amoeboid chemotaxis. Cell Motil. Cytoskelet.8:7–17. 73.Varnum-Finney, B., E. Voss, and D. R. Soll.1987. Frequency and orientation
of pseudopod formation ofDictyostelium discoideumamoebae chemotaxing in a spatial gradient: further evidence for a temporal mechanism. Cell Motil. Cytoskelet.8:18–26.
74.Wang, F., P. Herzmark, O. D. Weiner, S. Srinivasan, G. Servant, and H. R. Bourne.2002. Lipid products of PI(3)Ks maintain persistent cell polarity and directed motility in neutrophils. Nat. Cell Biol.4:513–518.
75.Wessels, D., D. R. Soll, D. Knecht, W. F. Loomis, A. De Lozanne, and J. Spudich.1988. Cell motility and chemotaxis inDictyosteliumamebae lacking myosin heavy chain. Dev. Biol.128:64–177.
76.Wessels, D., H. Vawter-Hugart, J. Murray, and D. R. Soll.1994. Three-dimensional dynamics of pseudopod formation and the regulation of turning during the motility cycle ofDictyostelium. Cell Motil. Cytoskelet.27:1–12. 77.Wessels, D., and D. R. Soll.1998. Computer-assisted characterization of the
behavioral defects of cytoskeletal mutants ofDictyostelium discoideum, p. 101–140.InD. R. Soll and D. Wessels (ed.), Motion analysis of living cells. Wiley-Liss, Inc., New York, NY.
78.Wessels, D., E. Voss, N. Von Bergen, R. Burns, J. Stites, and D. R. Soll.1998. A computer-assisted system for reconstructing and interpreting the dynamic three-dimensional relationships of the outer surface, nucleus and pseudo-pods of crawling cells. Cell Motil. Cytoskelet.41:225–246.
79.Wessels, D., D. F. Lusche, S. Kuhl, P. Heid, and D. R. Soll.2007. PTEN plays a role in the suppression of lateral pseudopod formation during Dictyoste-liummotility and chemotaxis. J. Cell Sci.120:2517–2531.
80.Wessels, D. J., H. Zhang, J. Reynolds, K. J. Daniels, P. Heid, S. Lu, A. Kuspa, G. Shaulsky, W. F. Loomis, and D. R. Soll. 2000. The internal phosphodiesterase RegA is essential for the suppression of lateral pseudo-pods duringDictyosteliumchemotaxis. Mol. Biol. Cell11:2803–2820. 81.Yumura, S., H. Mori, and Y. Fukui.1984. Localization of actin and myosin
for the study of ameboid movement inDictyosteliumusing improved immu-nofluorescence. J. Cell Biol.99:894–899.
82.Yumura, S., and T. Q. P. Uyeda.2003. Myosins and cell dynamics in cellular slime molds. Int. Rev. Cytol.224:173–225.