STABILITY-INDICATING HPLC METHOD DEVELOPMENT AND VALIDATION FOR THE DETERMINATION OF LACIDIPINE IN TABLETS
5
0
0
Full text
(2) Sanmuga Priya E et al. IRJP 2 (5) 2011 157-161 studies were carried out in a photo stability chamber. Thermal stability studies were carried out in a dry air oven (Thermolab, India). Chromatographic conditions A phenomenex Luna C18, 250 mm × 4.6 mm, 5 µm column was used with a mobile phase containing an isocratic elution. The buffer was composed of ammonium acetate, with its pH adjusted to 4.5 with glacial acetic acid. Buffer and methanol in the ratio of 300:700 (v/v) was used as mobile phase. The column temperature was maintained at 40°C, sample Cooler temperature 10°C, Flow rate 1.2 mL /min. and the detection wavelength was set at 240 nm. The injection volume was 20µl. Preparation of standard stock and standard solution Standard stock solution was prepared by dissolving 40.0 mg Lacidipine reference standard in 100 mL of methanol to get concentration of 400µg/mL. 5ml of standard stock solution was than diluted to 50 mL with methanol to get standard solution of Lacidipine. Preparation of sample solution Twenty tablets were accurately weighed. An amount of powder equivalent to 25 mg of Lacidipine was accurately weighed and transferred to a 50 mL volumetric flask. Methanol (35 mL) was added and the mixture was sonicated for 20 minutes. And the solution was diluted volume with methanol. The solution was filtered through a 0.45 µm nylon filter. Placebo preparation Weighed accurately and transferred Placebo of each strength equivalent to 25 mg of Lacidipine in to 50 mL volumetric flask. Methanol (35 mL) was added and the mixture was sonicated for 20 minutes. And the solution was diluted volume with methanol. The solution was filtered through a 0.45 µm nylon filter. Stress Degradation studies Specificity is the ability of the method to measure the analyte response in the presence of its potential impurities8. Forced degradation studies were performed on Lacidipine to provide an indication of the stabilityindicating property and specificity of the proposed method9. Unstressed Sample preparation Twenty tablets were accurately weighed. An amount of powder equivalent to 25 mg of Lacidipine was accurately weighed and transferred to a 50 mL volumetric flask. Methanol (35 mL) was added and the mixture was sonicated for 20 minutes. And the solution was diluted volume with methanol. The solution was filtered through a 0.45 µm nylon filter. Acid Hydrolysis. IRJP 2 (5) May 2011. Twenty tablets were accurately weighed. An amount of powder equivalent to 25 mg of Lacidipine was accurately weighed and transferred to a 50 mL volumetric flask. 1N HCL (5 mL) was added and stressed in ambient temperature for 12 hrs. The above solution was then refluxed for 1hour at 80°C, then 35 mL of methanol was added and the mixture was sonicated for 20 minutes. After cooled the above solution to room temperature the solution was diluted volume with methanol. The solution was filtered through a 0.45 µm nylon filter. Alkali Hydrolysis Twenty tablets were accurately weighed. An amount of powder equivalent to 25 mg of Lacidipine was accurately weighed and transferred to a 50 mL volumetric flask. 1N NaoH (5 mL) was added and stressed in ambient temperature for 12 hrs. The above solution was then refluxed for 1hour at 80°C, then 35 mL of methanol was added and the mixture was sonicated for 20 minutes. After cooled the above solution to room temperature the solution was diluted volume with methanol. The solution was filtered through a 0.45 µm nylon filter. Peroxide oxidation Twenty tablets were accurately weighed. An amount of powder equivalent to 25 mg of Lacidipine was accurately weighed and transferred to a 50 mL volumetric flask. 30 % H2O2 (5 mL) was added and stressed in ambient temperature for 12 hrs. The above solution was then refluxed for 1hour at 80°C, then 35 mL of methanol was added and the mixture was sonicated for 20 minutes. After cooled the above solution to room temperature the solution was diluted volume with methanol. The solution was filtered through a 0.45 µm nylon filter. Thermal degradation Twenty tablets were accurately weighed. An amount of powder equivalent to 25 mg of Lacidipine was accurately weighed and stressed in hot air oven at 105°C for 24 hrs. This added into 50 mL volumetric flask, then 35 mL of methanol was added and the mixture was sonicated for 20 minutes. Then the solution was diluted volume with methanol. The solution was filtered through a 0.45 µm nylon filter. Photo degradation (controlled) Twenty tablets were accurately weighed. An amount of powder equivalent to 25 mg of Lacidipine was accurately weighed and wrapped in aluminium foil then stressed at 1.2 million lux hours. This sample added into a 50 mL volumetric flask, then 35 mL of methanol was added and the mixture was sonicated for 20 minutes. Then the solution was diluted volume with methanol. The solution was filtered through a 0.45 µm nylon filter. Photo degradation (uncontrolled). Page 157-161.
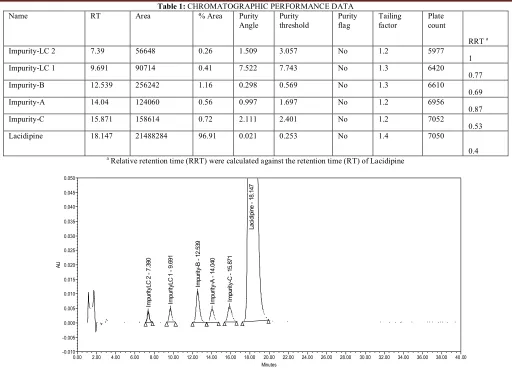
(3) Sanmuga Priya E et al. IRJP 2 (5) 2011 157-161 Twenty tablets were accurately weighed. An amount of powder equivalent to 25 mg of Lacidipine was accurately weighed stressed at 1.2 million lux hours. This sample added into a 50 mL volumetric flask, then 35 mL of methanol was added and the mixture was sonicated for 20 minutes. Then the solution was diluted volume with methanol. The solution was filtered through a 0.45 µm nylon filter. Validation of the method The proposed method was validated per ICH guidelines10. Stability of analyte in solution The stability of Lacidipine in the mobile phase was assessed by injecting the standard solution (4ppm) at 0, 9, 15, 24 hours. Precision and accuracy System precision was evaluated by performing six consecutive injections of 4ppm Lacidipine standard solution. Method precision was determined by six repeated assays of the same lot of the tablet formulations. The accuracy of the proposed method was determined by recovery experiments using tablets from the same lot of the commercial and developed formulations. The recovery was assessed at three levels (50, 100 and 150 %). Limit of detection (LOD) and limit of quantitation (LOQ) The LOD and LOQ concentrations were determined at signal-to-noise ratios of 3:1 and 10:1, respectively. Linearity Linearity test solutions for the assay and related substance method were prepared by diluting stock solution to the required concentrations. The solutions were prepared at six concentration levels from LOQ to 150 % of the specification level. Specificity The specificity of method was ascertained by peak purity profiling studies. Purity of drug peak was ascertained by analyzing the spectrum at peak start, meddle, and at peak end. Robustness To determine the robustness of the developed method, the experimental conditions were slightly altered and the resolution between Lacidipine and impurity-A, impurityB, impurity-C, impurity-LC1 and impurity-LC2 was evaluated. The flow rate of the mobile phase was slightly changed by ± 10 %. The effect of pH on the resolution of the impurities was studied by varying the pH by ± 0.2 units. The effect of the column temperature on the resolution of the impurities was studied by varying the temperature by ± 5°C. The effect of organic content in mobile phase on the resolution of the impurities was. IRJP 2 (5) May 2011. studied by varying the organic content in mobile phase by ± 2 %. The effect of wavelength on the resolution of the impurities was studied by varying the wavelength by ± 2nm. RESULTS AND DISCUSSION Method development and optimization The main objective of the chromatographic method was to separate impurity-A, impurity-B, impurity-C, impurity-LC1 and impurity-LC2 from the analyte peak during stress studies. Impurities and degradation products were co-eluted by using different stationary phases, such as C8, cyano and phenyl with various mobile phases with buffers, such as phosphate, sulfate and acetate with different pH values (3–7). A buffer was composed of ammonium acetate, with its pH adjusted to 4.5 with glacial acetic acid. Buffer and methanol in the ratio of 300:700 (v/v) was used as mobile phase, the column temperature was maintained at 40°C and the detection wavelength was set at 240 nm. The injection volume was 20 µl, flow rate of 1.50 mL/min was chosen for the test with a phenomenex Luna C18, 250 mm × 4.6 mm, 5 µm column. When an impurity-spiked solution was injected, the resolution between the impurities and analyte was good. The effect of the buffer pH was also studied under the above conditions. The results are shown in Table: 1 and figure: 1. Method validation Precision The percentage RSD of Lacidipine during the assay method precision study was within 1.4 % and the percentage RSD values of the area of impurity-A, impurity-B, impurity-C, impurity-LC1 and impurity-LC2 in the related substance method precision study were within 1.5 %. The percentage RSD of the results obtained in the intermediate precision study was within 0.7 %. Linearity The linear calibration plot for the assay method was obtained over the tested calibration range (LOQ–150 %) and the obtained correlation coefficient was greater than 0.999. The results revealed an excellent correlation between the peak area and analyte concentration. The slope and y-intercept of the calibration curve were 49786,-827.45 respectively. The linear calibration plot for the related substance method was determined over the calibration ranges (LOQ-150 %) for impurity-A, impurity-B, impurity-C, impurity-LC1 and impurityLC2, a correlation coefficient of greater than 0.999 was obtained. The linearity was checked for the related substance method over the same concentration range for 3 consecutive days. These results showed an excellent correlation between the peak areas and concentrations of. Page 157-161.
(4) Sanmuga Priya E et al. IRJP 2 (5) 2011 157-161 impurity-A, impurity-B, impurity-C, impurity-LC1 and impurity-LC2. Accuracy The percentage recovery of Lacidipine in the drug substance and product ranged from 98.9 to 100.6 and from 98.2 to 102, respectively. The percentage recoveries of impurity-A, impurity-B, impurity-C, impurity-LC1 and impurity-LC2 in the drug substance and product ranged from 98.0 to 101.5, 98.8 to 101.1, 99.5 to 102.1, 91.9 to 103.7 and 102.5 to 104.1 respectively. Robustness Robustness of the method was determined by making slight changes in the chromatographic conditions, such as change in mobile phase composition, pH, column temperature, wavelength and flow rate. The tailing factor for Lacidipine and five impurities was found to be less than 2 and the resolution for Lacidipine and five impurities was found to be good. Which demonstrated that the RP-HPLC method developed is robust. Solution stability and mobile phase stability The percentage RSD of the Lacidipine and five impurities was calculated for the mobile phase and solution stability experiments. The solution stability of Lacidipine and its impurities in the related substance method was carried out by leaving a spiked sample solution in a tightly capped volumetric flask at room temperature for 24 hours. The content of impurity-A, impurity-B, impurity-C, impurity-LC1 and impurity-LC2 was determined at 6 hours intervals up to the study period. The mobile phase stability was also investigated for 24 hours by injecting the freshly prepared sample solutions for every 6 hours interval. The content of impurity-A, impurity-B, impurity-C, impurity-LC1 and impurity-LC2 was determined in the test solutions. The prepared mobile phase remained constant during the study period. Cumulative percentage RSD was 0.7 for peak area of Lacidipine in standard. Cumulative percentage RSD was 1.4 for peak area of known impurities in sample solution. Results of forced degradation Peak purity test results derived from the PDA detector, confirmed that the Lacidipine peak and the degraded peaks were homogeneous and pure in all of the analyzed stress samples. Assay studies were carried out for the stress samples (at 4ppm) against a qualified reference standard of Lacidipine .The mass balance of the stressed samples was close to 99.6 %. The assay of Lacidipine was unaffected in the presence of impurity-A, impurityB, impurity-C, impurity-LC1 and impurity-LC2 and its. IRJP 2 (5) May 2011. degradation products, confirming the stability-indicating power of the developed method. CONCLUSION A sensitive, specific, accurate, validated and well defined stability-indicating HPLC method for the determination of Lacidipine in the presence of degradation products and its process-related impurities was described. The behavior of Lacidipine under various stress conditions was studied. All of the degradation products and process impurities were well separated from the drug substance and drug product demonstrates the stability-indicating the method. The information presented in this study could be very useful for quality monitoring of active pharmaceutical ingredients in their, dosage forms and be used to check drug quality during stability studies. ACKNOWLEDGMENT The authors are thankful to Shasun pharmaceuticals limited, Department of analytical development, Formulation division, Puducherry, India. REFERENCES 1. Martindale, The Extra Pharmacopeia. 31st ed. Royal Pharmaceutical Society: London; 1996. p. 898. 2. Lee CR, Bryson HM. Lacidipine. A review of its pharmacodynamic and pharmacokinetic properties and therapeutic potential in the treatment of hypertension. Drugs 1994; 48(2): 274-96. 3. De Filippis P, Bovina E, Da Ros L, Fiori J, Cavrini V. Photo degradation studies on Lacidipine in solution: basic experiments with a cis–trans reversible photo equilibrium under UV-A radiation exposure. Journal of Pharmaceutical and Biomedical Analysis 2002; 27(5): 803-812. 4. Erdal Dinc, Gaetano Ragno, Giuseppina Ioele, Dumitru Baleanu. Fractional Wavelet Analysis for the Simultaneous Quantitative Analysis of Lacidipine and Its Photo degradation Product by Continuous Wavelet Transform and Multilinear Regression Calibration. J. AOAC int. 2006; 89(6): 1538-1546. 5. Meyyanathan SN, Tresa Tonio M, Rama Sarma GVS, Suresh B. Spectrophotometric determination of Lacidipine in its dosage forms, Indian Drugs 1999; 36(9): 572-575. 6. Kharat VR, Verma KK, Dhake JD. Determination of Lacidipine from urine by HPTLC using off-line SPE, Journal of Pharmaceutical and Biomedical Analysis 2002; 28(3-4): 789793. 7. Belal Fathalla, Elbrashy Amina, Eid Manal, Nasr Jenny Jeehan. Stability-Indicating LC Method for the Determination of Lacidipine in Tablets. Application to Degradation Kinetics and Content Uniformity Testing, Chromatographia 2009; 69(11-12): 1201-1209. 8. ICH, Q1 (R2) (2000) Stability Testing of New Drug Substances and Products, International Conference on Harmonization, IFPMA, Geneva, Switzerland. 9. Bakshi M, Singh S. Development of validated stability indicating assay methods-critical review, Journal of Pharmaceutical and Biomedical Analysis. Anal 2002; 28(6): 1011-1040. 10. ICH, Q2 (R1) (2005) Validation of Analytical Procedures: Text and Methodology, International Conference on Harmonization, IFPMA, Geneva, Switzerland .. Page 157-161.
(5) Sanmuga Priya E et al. IRJP 2 (5) 2011 157-161 Table 1: CHROMATOGRAPHIC PERFORMANCE DATA % Area Purity Purity Purity Angle threshold flag. Name. RT. Area. Impurity-LC 2. 7.39. 56648. 0.26. 1.509. 3.057. Impurity-LC 1. 9.691. 90714. 0.41. 7.522. Impurity-B. 12.539. 256242. 1.16. Impurity-A. 14.04. 124060. Impurity-C. 15.871. Lacidipine. 18.147. Tailing factor. Plate count. No. 1.2. 5977. 7.743. No. 1.3. 6420. 0.298. 0.569. No. 1.3. 6610. 0.56. 0.997. 1.697. No. 1.2. 6956. 158614. 0.72. 2.111. 2.401. No. 1.2. 7052. 21488284. 96.91. 0.021. 0.253. No. 1.4. 7050. RRT a 1 0.77 0.69 0.87 0.53 0.4 a. Relative retention time (RRT) were calculated against the retention time (RT) of Lacidipine Lacidipine - 18.147. 0.050 0.045 0.040 0.035. 0.010 0.005. Impurity-C - 15.871. 0.015. Impurity-A - 14.040. 0.020. ImpurityLC 1 - 9.691. ImpurityLC 2 - 7.390. AU. 0.025. Impurity-B - 12.539. 0.030. 14.00. 16.00. 0.000 -0.005 -0.010 0.00. 2.00. 4.00. 6.00. 8.00. 10.00. 12.00. 18.00. 20.00 Minutes. 22.00. 24.00. 26.00. 28.00. 30.00. 32.00. 34.00. 36.00. 38.00. 40 .00. Figure 1: Typical chromatograms of Lacidipine spiked with its five impurities from method development. Source of support: Nil, Conflict of interest: None Declared. IRJP 2 (5) May 2011. Page 157-161.
(6)
Figure
Related documents
Interestingly, predictions made by IPA were pointing towards directional changes in functions which may lead to a decreased risk of cancer among individuals with high scores for
Department; PORALG: President ’ s Office - Regional Administration and Local Government; PPP: Public-Private Partnership; PPRA: Public Procurement Regulatory Authority; PV:
The current endeavors for the sustainable development of metal free processes employing visible light has evoked considerable interest in organic synthesis [9-12],
round TMA retainers bonded only to the canines survived without any failures 10 – 15 years after debonding in comparison with the mandibular .016 ″ × .022 ″ braided SS wires bonded
In the case of volcanic forcing it appears that the amplitude of the temperature response to volcanic eruptions over tropical South America is larger than the rather weak and
Objectives: The identification of the problems and characteristics of geriatric patients at the beginning of post-acute rehabilitation therapy which predict the worsening of
Increased viability of fibroblasts when pretreated with ceria nanoparticles during serum deprivation
For this purpose, human dermal fibroblast cells received cell culture media with concentrations of 250 µ g/mL and 500 µ g/mL of nano-cerium oxide before being exposed to 24, 48,
It consists of: Phase 1: Discover candidate item s ets that are having a TWU ≥ minutil Phase 2: For each candidate, calculate its exact utility by scanning the database..
