“Assessment of Quality Objectives in a
Manufacturing Organization”-A Case
Study at ABC Industry
Prof.R.T.Salunkhe* Assistant Professor,
Mechanical Engineering Department, T.K.I.E.T. Warananagar, Dist.-Kolhapur, India 416113 [email protected]
Prof. J.S. Bagi Associate Professor,
Production Engineering Department, K.I.T’s College of Engineering Kolhapur,
Dist.- Kolhapur, India [email protected]
Abstract:
The design and implementation of an organization's quality management system is influenced by varying needs, particular objectives, the products provided, the processes employed and the size and structure of the organization. ISO 9001:2008 specifies requirements for a quality management system where an organization needs to demonstrate its ability to consistently provide product that meets customer requirements, and aims to enhance customer satisfaction through the effective application of the system, including processes for continual improvement of the system. This paper focused on the methods for assessment of quality objectives at ABC industry. This is useful for them not just for improving their supply chain performance but for improving their outsourcing strategies and approach. The quality level is also increased from 3.83σ to 4.15σ. The organization continually improves the effectiveness of the Quality Management System through the use of quality policy, quality objectives, analysis of data, corrective and preventive action etc.
Keywords: QMS-Quality Management System, SCM-Supply Chain Management, Customer Satisfaction,
Rejection, Rework
Introduction:
Nearly 900,000 organizations in 170 countries have adopted the ISO 9001 Quality Management System standard, a remarkable figure given the lack of rigorous evidence regarding how the standard actually affects organizational practices and performance. Implementing a quality management system that conforms to ISO 9001 requires companies to document operating procedures, training, internal auditing, and corrective action procedures. It also requires companies to implement procedures to improve existing procedures. [5]
The literature has identified several controversies in defining the nature of relationship between ISO 9000 QMS, manufacturing parameters, competitive priorities and firm performance. The first research question deals with the performance improvement of firms as a result of ISO 9000 QMS certification. The second research question deals with how the performance is improved. In order to examine the research questions a research framework was developed. [4]
The Research framework (fig.1) shows that ISO 9000 is an initiatory Phase of affecting firm performance. Model suggests that the relationship of ISO 9000 QMS, manufacturing parameters and competitive priorities is linked to firm performance through customer satisfaction. The exploitation of ISO 9000 QMS standards is expected to generate new manufacturing capabilities that influence competitive priorities. This situation increases customer satisfaction that leads to firm performance improvement.
Fig.1. Research Framework
Based on the research framework, the study firstly will focus on the first research question that deals with the performance improvement of firms as a result of ISO 9000 certification.Therefore the study will examine if there is a significant difference between the ISO 9000 certified and non-certified firms in relation to the firm performance. Secondly, the benefits of ISO 9000 QMS on manufacturing parameters will be investigated [4].
Case Study Implemented at ABC Industry
Brief Introduction of ABC Industry:
ABC has more than 35 years experience of producing web offset and sheet fed offset presses. Over the years, ABC has emerged as a thriving, nimble, printing machinery enterprise, due to its ability to transform itself rapidly to meet the challenges of a highly competitive global economy and its commitment to become a supplier of choice by delighting customers with services and products. Constant modernization and introduction of state-of-the-art technology at ABC has enabled it to stay ahead in the industry and successfully surpass all expectations.
meet and exceed their customer’s needs with precision quality, while their commitment to excellence in every phase of their business reflects in the quality of their products.
In its relentless efforts to meet and exceed the needs and demands of its customers ABC has made rapid progress in the international market. Leading publishers from South America, Europe, Middle East & Asia have all invested in their presses. Their customers count on them to give them a product of superior quality at the lowest cost. Their technical expertise and unrelenting thrust towards continuous quality improvement are the principal strengths of ABC. Product of the company is printing machineries, having huge structures. Follows job order or build to order production, Less accessibility to metropolitan cities, location of vendors at various parts of the state, Components required for assembly are very costly, manufactured through vendor, abide with customer specifications, Follow to keep minimum inventory level at the industry level, Relies on the vendor delivery for the particular item, Fail in commitment given to customer, moreover it sometimes also cause to loose their order.
Quality Objectives of the ABC Industry:
1. Total Customer Satisfaction.
2. To Ensure Effective Supply Chain Management.
3. To Establish Proper Value Stream Across the Organization.
4. To Enhance Human Resource Utilization by Implementing Result Oriented HR Practices.
5. To Evolve as Responsible Corporate Sector, Nurturing Human Values and Concern for Society and the Environment.
At ABC industry monitoring, measurement, analysis and improvement in processes are carried out in order to:
1. Demonstrate conformity of the product.
2. Ensure conformity of the quality management system.
3. Continually improve the effectiveness of the quality management system.
In this paper first two Quality Objectives of the Organization are studied, also the product rejections/reworks are studied with reference to measurement, analysis and improvement.
Part A:
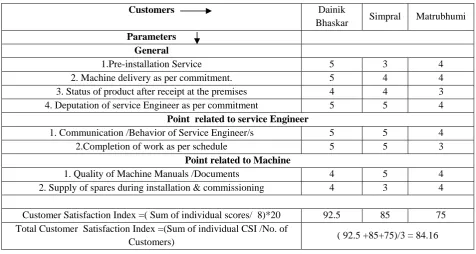
1. Monitoring and measurement of Customer Satisfaction Index:
Table 01 Method for obtaining Customer Satisfaction Index
The following fig. shows Graphical representation of Total Customer Satisfaction Index for the years 2004-05, 2005-06, 2006-07, and 2008-09.
Fig.2. Total Customer Satisfaction Index –Trend Analysis
From this graph it is observed that Customer Satisfaction Index is less i.e. 81.71% for the year 2006-07.
The analysis of this Customer Satisfaction Index is discussed in depth in the Management Review Committee Meeting and some corrective actions are taken. The decreasing trend of Customer Satisfaction was discussed in depth.
1. CEO instructed to arrange quarterly visits of senior officers from CSD and ASSLY initially to the dissatisfied customers and submit report to CEO, GM and M.R.
2. CEO instructed to take necessary actions against the free supply due to design defects
3. G. M. also instructed to review the procedure for analysis of customer satisfaction and change the format, after discussion with counterpart.
For the above actions the target dates are given to the responsible persons.
Customers Dainik
Bhaskar Simpral Matrubhumi
Parameters General
1.Pre-installation Service 5 3 4
2. Machine delivery as per commitment. 5 4 4
3. Status of product after receipt at the premises 4 4 3
4. Deputation of service Engineer as per commitment 5 5 4
Point related to service Engineer
1. Communication /Behavior of Service Engineer/s 5 5 4
2.Completion of work as per schedule 5 5 3
Point related to Machine
1. Quality of Machine Manuals /Documents 4 5 4
2. Supply of spares during installation & commissioning 4 3 4
Customer Satisfaction Index =( Sum of individual scores/ 8)*20 92.5 85 75 Total Customer Satisfaction Index =(Sum of individual CSI /No. of
Due to these corrective actions of measurement, it is found that Customer Satisfaction Index is increased in the subsequent years i.e. above 80%.
2. Ensure Effective Supply Chain Management.
Supply Chain Management is a set of approaches utilized to efficiently integrate suppliers, manufacturers and stores, so that product is produced and distributed at the right quantities, to the right locations and at the right time in order to reduce cost and satisfying the requirements. SCM is the processes from initial raw materials to the ultimate consumption of the finished product, linking across supplier-user companies.
2.1Supplier evaluation and selection method:
While selecting supplier various criteria have to be considered in the decision making process. Preference for a given supplier is generally assumed to be depends on an assessment, case-by-case, of the quality, price, delivery & service he can provide. The relative importance of these selection criteria has been estimated in various procurement situations. The selection of right source of supply is an important aspect in materials management. The vendor is to be examined with respect to his capability and competency to supply right quality of material at right time and at a competitive price.
Suppliers Performance Assessment is done on the following basis:- 1. On the basis of delivery time.
2. On the basis of Quality 3. On the basis of cost/price.
2.2 Supplier Gradation on the basis of delivery time:
The performance on the above criteria is evaluated against the purchase order during the period from 01/04/2008 to 30/06/2008.After processing purchase order as per work instructions & duly approved is sent to supplier for manufacturing as per quality norms agreed and mentioned in purchase order. The analysis on the basis of actual delivery against scheduled delivery is made once in three month and feed back is given to supplier to made once in three month and feed back in given to supplier to improve upon.
The following table shows the delivery status of goods. If the material received as per the chart given in the table it is treated as material supplied in time.
Table 02 Delivery Status of Goods
Area Difference Between S.D. To Actual Delivery
Local (Kolhapur +Shiroli+Gokul Shirgaon
+Kodoli+Warananagar+Pargaon +Vadgaon) 8 Days
Ichalkaranji+Miraj+Sangli +Belgaum
15 Days
A) Mumbai+Pune+Bangalore +Mysore
+Coimbatore
B) All other items including casting.
30 Days
Table 03 Delivery Status of Goods
The following table shows the Supplier Gradation on delivery basisagainst purchase orders during the period from 01/04/08 to 30/06/08.
Table04 Supplier Gradation on the basis of Delivery
For Example: Delivery status for thePeriod from 01/04/08 to 30/06/08. No of lots received in time: - 157
No of lots delayed : - 6
Percentage of lots received in time: - 96.32% Supplier classification as per records: - A
2.3 Supplier Gradation on the basis of Quality:
Supplier Quality assessment for the quarter April-2008 to June -2008
Procedure:-
Quality rating (Qr) for a lot is to calculate by following formula Qr =Q1 +(X*Q2)/Q*100
Where,
Q =Total Qty.Supplied. Q1=Qty.Accepted.
Q2=Qty. Accepted with deviation.
X =Demerit factor when material is accepted with deviation. If Major deviation Demerit factor=0.5
Minor deviation Demerit factor=0.8
Major means for critical components which requires due attention while production. Minor means requires less or no attention during further processing.
Suppliers are categorized once in three months on their current performance basis. A- Performance having acceptance above 90%
B- Performance having acceptance between 81 to 90% C- Performance having acceptance between 61 to 80% D- Performance having acceptance below 60%
All suppliers will be informed about there present Performance also suppliers in categories C and D will be informed, to improve there present Performance. The Performance of suppliers in C and D Class in next months shall be assessed and informed.
Drawing. No. Purchase Order
No. Sch. Date Sch Qty.
G.R.
Qty. GR No. G.R. Date Delay In Time
22W30.11526-0001 KS-137793/0-1 02/04/08 138 138 396034 29/01/08 - YES
22W30.1899 KS-139884/0-1 01/04/08 5 1 417771 06/07/08 96 NO
Grade In Time Supply
Grade A On And Above 70%
Grade B 60% To 70%
Grade C 50% To 60%
The following table shows the Gradation of Suppliers on the basis of Quality.
Table 05 Supplier Gradation on the basis of Quality
Supplier Code Name of Supplier Cum. Rating Cum. Class
PVXYZ Supplier-1 68.52 C
PVLMN Supplier-2 53.79 D
PVABC Supplier-3 71.13 C
PVPQR Supplier-4 77.22 C
Example of Supplier -4
Total Inspected Quantity = 468 Total Accepted Quantity = 266 Total Re-work Quantity = 159 Total Rejected Quantity = 43
Quality Rating = 266+ (0.6*159)/468=77.22%
Hence Gradation of Supplier -4 is in C Class.
2.4 Guide-Lines for Actions to Be Taken On D Class Suppliers:
If the suppliers rating observed in class D for quarterly analysis report, the reasons for poor quality are to be studied by Materials Department along with Quality Assurance dept.The feed –back regarding poor quality supply, is to be discussed OR communicated to the supplier by Quality Assurance dept. Necessary technical guidance to be provided to the supplier for improvement in the supply by Materials Department or Quality Assurance dept.Suppliers performances for three-quarters are to be analyzed and if the suppliers rating observed in D class then again, that supplier is to be treated as Temporary Supplier and it is deleted from the list of Approved Suppliers. Such suppliers to follow the same route to qualify for the list of Approved Suppliers. During the detailed study /enquiry /observations, if the supplier is found observing wrong business practices, as detailed below, then the supplier is declared as a Black-listed Supplier.
1. Supply of Non-genuine brand/make materials. 2. Submission of false inspection reports.
3. Supply of our parts to others to others like competitors, customers. 4. Disobey of secrecy agreement.
5. Unethical practices in commercial dealings.
Such incidences are to be recorded by Quality Assurance dept.and brought to the notice of Materials Department and the supplier. The list of Black-listed Suppliers is to be finalized jointly by HOD PUR, /HOD VRD & HOD QA. Materials Dept. PUR/VRD will not procure any material from the Black-listed Suppliers.
2.5 Supplier gradation on the basis of cost /price:
The following table shows supplier gradations on the cost basis. The Supplier which gives products at minimum cost will be considered as the best supplier, but at the same time it is also necessary to see that whether the supplier is capable to deliver the same at the right time, at right quality and in right quantity or not.
Table 06 Supplier Gradation on the basis of cost
Drawing No Description Supplier-1 Supplier-2
Supplier Gradation on cost basis
A Grade B grade
L361.10-4831.1/3 Helical gear 5088 5499 Supplier -1 Supplier -2
Part B:
Monitoring and measurement of product:
The organization monitors and measures the characteristics of the product to verify that product requirements have been met. This is carried out at appropriate stages of the product realization process in accordance with the planned arrangements. Evidence of conformity with the acceptance criteria will be maintained. Records will indicate the person authorizing release of product. Product release and service delivery will not proceed until the planned arrangements have been satisfactorily completed, unless otherwise approved by a relevant authority and, where applicable, by the customer.
1. The details of Rejection / Rework at final inspection in Machine Shop in July -2006:
The following table shows the details of Rejection / Rework at final inspection in Machine Shop for the month of July -2006
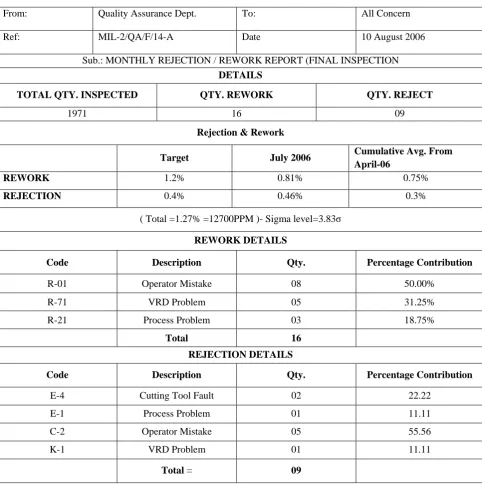
Table 07 Details of Rejection / Rework
From: Quality Assurance Dept. To: All Concern
Ref: MIL-2/QA/F/14-A Date 10 August 2006
Sub.: MONTHLY REJECTION / REWORK REPORT (FINAL INSPECTION
DETAILS
TOTAL QTY. INSPECTED QTY. REWORK QTY. REJECT
1971 16 09
Rejection & Rework
Target July 2006 Cumulative Avg. From April-06
REWORK 1.2% 0.81% 0.75%
REJECTION 0.4% 0.46% 0.3%
( Total =1.27% =12700PPM )- Sigma level=3.83σ
REWORK DETAILS
Code Description Qty. Percentage Contribution
R-01 Operator Mistake 08 50.00%
R-71 VRD Problem 05 31.25%
R-21 Process Problem 03 18.75%
Total 16 REJECTION DETAILS
Code Description Qty. Percentage Contribution
E-4 Cutting Tool Fault 02 22.22
E-1 Process Problem 01 11.11
C-2 Operator Mistake 05 55.56
K-1 VRD Problem 01 11.11
From Table 07 it is observed that, Rework is 0.81% against target of 1.2%. Rejection is 0.46% against target of 0.4% Sigma level achieved =3.83 σ
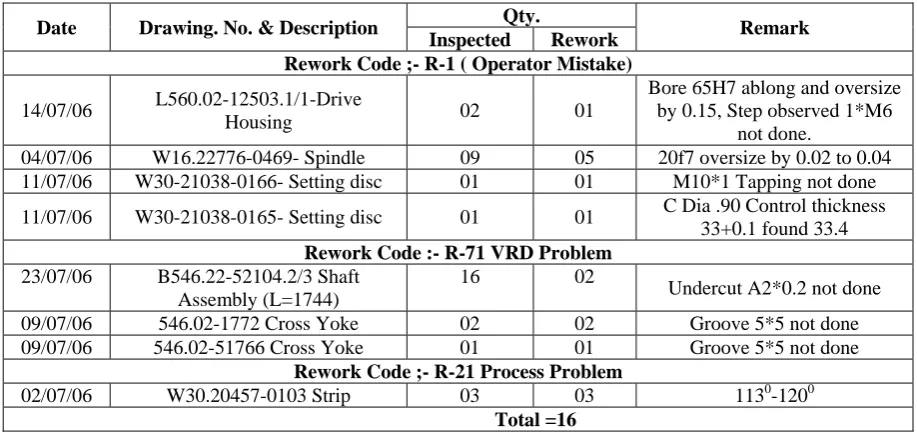
1.1 Rework Report for the month of July 2006 final Inspection at Machine Shop:
The following table shows Rework Report for the month of July 2006 at Machine Shop
Table 08 Rework Report
1.2 Rejection Report month of July 2006 final Inspection at Machine Shop:
The following table shows Rejection Report for the month of July 2006 at Machine Shop
Table 09 Rejection Report
The reports of rework and rejection are observed and the corrective actions are taken as follows: 1. The Operator has noticed their mistake and instructions are given to prevent reoccurrence. 2. The Vendor has noticed their mistake.
3. To remove process problems in process inspection is carried out. 4. To provide proper training to the operators.
Date Drawing. No. & Description Qty. Remark Inspected Rework
Rework Code ;- R-1 ( Operator Mistake)
14/07/06 L560.02-12503.1/1-Drive
Housing 02 01
Bore 65H7 ablong and oversize by 0.15, Step observed 1*M6
not done.
04/07/06 W16.22776-0469- Spindle 09 05 20f7 oversize by 0.02 to 0.04 11/07/06 W30-21038-0166- Setting disc 01 01 M10*1 Tapping not done 11/07/06 W30-21038-0165- Setting disc 01 01 C Dia .90 Control thickness
33+0.1 found 33.4
Rework Code :- R-71 VRD Problem
23/07/06 B546.22-52104.2/3 Shaft Assembly (L=1744)
16 02
Undercut A2*0.2 not done
09/07/06 546.02-1772 Cross Yoke 02 02 Groove 5*5 not done
09/07/06 546.02-51766 Cross Yoke 01 01 Groove 5*5 not done
Rework Code ;- R-21 Process Problem
02/07/06 W30.20457-0103 Strip 03 03 1130-1200
Total =16
Date Drawing. No. & Description Qty. Remark Inspected Rejected
Rejection Code ;- E-4 Cutting Tool Fault
18/07/06 L361.10-4224.1/4 Worm 48 02 M8*1 Damaged
Rejection Code ;- E-1 Process Problem
21/07/06 W16.22776-0469 02 01 Flat 20f7 -19.75-19.80
Rejection Code :- C-02 Operator Mistake
23/07/06 W30.19576-0104 Threaded Spindle 05 01 TR16*4 Threading Damaged
28/07/06 W30.20422-0138 04 04 //ty 0.01 found o.1to0.3
Rejection Code :-k1 VRD Problem
28/07/06 361.10-4224 61 01 Hex punching size O/s by 0.5
2. The details of Rejection / Rework at final inspection in Machine Shop for the month of Feb.2009are as follows:
The following table shows the details of Rejection / Rework at final inspection in Machine Shop for the month
Table 10 Details of Rejection / Rework
From Table 10, it is observed that, Rework is 0.28% against target of 1.2%. Rejection is 0.13% against target of 0.4% Sigma level achieved =4.15 σ
2.1 Rework Report for the month of February 2009 final inspection at Machine shop:
The following table shows Rework Report for the month of February 2009.
Table 11 Rework Report for the month of February 2009
From: Quality Assurance Dept. To : All Concern
Ref.: MIL-2/QA/F/14-A Date 03 March 2009
Sub.: MONTHLY REJECTION / REWORK REPORT (FINAL INSPECTION)
DETAILS
TOTAL QTY. INSPECTED QTY. REWORK QTY. REJECT
721 02 01
Rejection & Rework
Target Feb. 2009 Cumulative Avg.
REWORK 1.2% 0.28% 0.24%
REJECTION 0.4% 0.13% 0.16%
( Total = 4100PPM )- Sigma level= 4.15 σ
REWORK DETAILS
Code Description Qty. Percentage Contribution
R-1 Operator Mistake 02 100.00%
Total = 02 REJECTION DETAILS
Code Description Qty. Percentage Contribution
C-2 Operator Mistake 01 100.00%
Total = 01
Date Drawing. No. & Description Qty. Remark
Inspected Rework
Rework Code ;- R-1 ( Operator Mistake)
05/02/09 546.23-14860 –Cutting Cylinder 02 01 Chamfer 3*15 degree found oversize by 2mm.
06/02/09 875.35-1101-Cylinder body 01 01 Flat 46+0.1 oversize by 0.4mm.
2.2 Rejection Report month of Feb.09Final Inspection at Machine Shop:
The following table Rejection Report for the month of February 2009.
Table 12 Rejection Report month of Feb.09
2.3 Analysis of Rework and Rejection:
The following table shows the analysis of Rework and Rejection are carried out. Once the defect is observed the root cause analysis is done and the corrective actions are suggested. To achieve this target date for the
responsible person is given.
Table 13 Analysis of Rework and Rejection
Sr. No.
Drawing No./Description
Qty. Defect Observed Cause Analysis Corrective Action Suggested
Target Date
01 578.22-12222
Friction Cylinder 01
42e8 &36j5 step OD U/S by
0.18mm
Recoating job size not checked while grinding by
operator
Confirm grinding allowance before finish
grinding by operator.
Immediate
02 546.02-25349
Eccentric bush 01
Bore 47M6 o/s by 0.005 & taper by
0.02
Fouling of location pin in clamping fixture
to be avoided.
Clamping fixture of locating pin
modification required. Immediate
03 546.23-14860 01
Balancing hole done near slot observed less wall
thick
Balancing weight removed at wrong
location
Drawing modification required to reduce the
slot length as cast
condition. Immediate
Results and Discussions:
With the globalization of the world economy, the delivery and environmental factors that influence a company’s global strategies and approach. The case study implemented at ABC industry, is useful for them not just for improving their outsourcing strategies and approach but also high customer satisfaction, very low inventory level and increase in profit.
From the reports of rework and rejection it is observed that there is considerable reduction in the rework and rejection. Major issues are discussed in the management review committee meeting and the corrective and preventive actions are taken to eliminate the cause of non-conformities in order to prevent recurrence. The quality level is also increased from 3.83σ to 4.15σ. From this the effectiveness of quality management system is observed.
Acknowledgement:
First of all, I would like to express utmost gratitude to my Co-author Prof.J.S.Bagi, for his continued support, encouragement and guidance provided in articulating this paper.
Finally, I am very much thankful to all those who extended their help directly or indirectly in preparation of this paper.
Date Drawing. No. & Description Qty. Remark Inspected Rejected
Rejection Code ;- C2Operator Mistake
24/02/09 H546.02-25349 1/3Eccentric Bush 08 01 Bore 47M6 oversize by 0.005 & taper by 0.02mm.
References:
[1] K.R.Beattie, A.S.Sohal, Implementing ISO 9000: a study of its benefits among Australian organizations, Total Qual. Manage.10 (1) (1999) 95-106.
[2] H.Liao, D.enke, H.Wiebe, An expert advisory system for the ISO 9001 quality system, Expert syst.Appl.27 (2) (2004) 313-322. [3] M.Ebrahimpour, B.E.Withers, N. Hikmet, Experiences of US-and foreignowned firms: A new perspective on ISO 9000
implementation, Int.J.Prod. Res.35 (2) (1997) 569-576.
[4] Tufan Koc, The impact of ISO 9000 quality management systems on manufacturing-- Journal of Materials Processing Technology 186 (2007) 207–213.
[5] David I. Levine Michael W. Toffel - Quality Management and Job Quality: How the ISO 9001Standard for Quality Management Systems Affects Employees and Employers-Hass School of Business, University of California, Berkeley, CA 94720, Levine@hass,berkeley.edu & Harvard Business School ,Boston, A 02163, [email protected]
[6] An IS/ISO 9001:2000, Manual of Quality Management Systems general requirements.
[7] ABC Industry : Documents for Assessment of Quality Objectives, monitoring and measurement of Product for rework and rejection.