Strategic Optimization and Investigation
Effect Of Process Parameters On
Performance Of Wire Electric Discharge
Machine (WEDM)
ATUL KUMAR1, DR.D.K.SINGH2
Mechanical Engineering Department Madan Mohan Malaviya Engineering College
Gorakhpur U.P. India - 273010 [email protected], [email protected]
Abstract—Wire electrical discharge machining (WEDM) is widely used in machining of conductive materials when precision is of primary significance. Wire-cut electric discharge machining of Skd 61alloy has been considered in the present work. Experimentation has been completed by using Taguchi’s L18 (21x37) orthogonal array under different conditions of parameters. Optimal combinations of parameters were obtained by this technique. The study shows that with the minimum number of experiments the complete problem can be solved when compared to full factorial design. Experimental results make obvious that the machining model is proper and the Taguchi’s method satisfies the practical conditions. The results obtained are analyzed for the selection of an optimal combination of WEDM parameters for proper machining of Skd 61 alloy to achieve better surface finish. Different analysis was made on the data obtained from the experiments.
Keywords-- Wire-cut EDM, Taguchi’s method, Orthogonal Array, Design of experiment etc
1. INTRODUCTION
The wire-cut electrical discharge machining plays an main role in manufacturing sectors especially industries like aerospace, ordinance, automobile and general engineering etc [1-2]. Conventional machining is more efficient than unconventional machining like wire-cut EDM process but it is difficult to obtain complicated and complex shapes of the components [3-8] as it is required in the above mentioned applications. In addition machine tool tables provided by the manufacturer often do not meet the requirements in machining a particular material [4-9]. Thus to obtain various shapes of components the wire-cut EDM process is important in several cases, but it requires the improved machining efficiency. But wire-cut EDM consists of a number of parameters, which makes it not easy to obtain optimal parametric combinations for machining different materials for various responses like surface roughness, etc. Taguchi robust design has been used in various applications to obtain optimum parametric combinations [4-5] for wanted responses. Various researchers were attempted previously to improve the surface roughness [5-6] on a variety of materials. Hence, wire-cut electrical discharge machining of Skd 61 alloy has been considered in the present set of research work with cutting speed, dimensional deviation and surface roughness as response output parameters. The main objective of this paper is to study the effect of different parameters of WEDM using Taguchi design methodology. To prepare the models for machining of Skd 61alloy using standard matrix experiments L18 (21x37) orthogonal array.
2. EXPERIMENTAL SET-UP
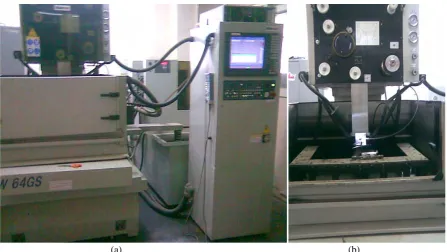
Experiments have been performed on five axis CNC Wire cut EDM (CHMER- CW64GS) at Process and Product Development Centre (PPDC) Agra U.P. (India). The photographic view of CNC Wire cut EDM and experimental set-up are shown in Figure 1. A 0.25 mm diameter brass wire used in this experiment as a cutting tool and Skd 61 alloy steel plate of 100mm x 80mm x 10mm size is mounted on the CHMER-CW64GS WEDM machine tool and specimens of 12mmx10mmx10mm size are cut according to Taguchi L18 design. Chemical composition of material is given in Table 1.
Table 1 Chemical composition of Skd 61 alloy steel
Material C Si Mn P S Cr Mo Cu V
(a) (b)
Figure 1 CNC Wire cut EDM (a) and experimental set-up(b)
2.1 Cutting Speed
For WEDM, cutting speed is a desirable characteristic and it should be as high as possible to give least machine cycle time leading to increased productivity. In the present study cutting speed is a measure of job cutting which is digitally displayed on the screen of the machine and is given quantitatively in mm/min.
2.2 Surface Roughness measurement
It was measured on Subtronic-10 surface tester giving Ra value in microns. Ra is measured along four different lines on the surface and the average value is considered for further analysis.
2.3 Dimensional Deviation Measurement
The specimen cross-section is measured with the help of a Mitutoyo digital micrometer having the least count of 0.001 mm and the deviation of the measured dimension is calculated in percentage using the following expression:
Dimensional Deviation
=
x 100
3. OPTIMIZATION TECHNIQUES
3.1 Taguchi Method
The quality engineering method proposed by Taguchi is commonly known as the Taguchi method or Taguchi approach. This approach provides a new experimental strategy in which a modified and standardized form of design of experiment ( DOE ) is used. In other words, the Taguchi approach is a form of DOE with special application. The concept of the Taguchi method is that the parameter design is performed to reduce the sources of variation on the quality characteristics of product, and reach a target of process robustness Taguchi designs experiments using specially constructed tables known as “orthogonal array” ( OA ).It utilizes the orthogonal arrays from experimental design theory to study a large number of variables with a small number of experiments. This technique helps to study effect of many factors (variables) on the desired quality characteristic most reasonably. By studying the effect of individual factors on the results, the best factor combination can be determined. The standardized Taguchi-based experimental design used in this study is an L18 orthogonal array.
3.2 Signal-to-Noise ratios (S/N ratio)
the S/N ratio is the ratio of the mean to the S.D. S/N ratio is used to measure the quality characteristic deviating from the desired value. The S/N ratio η is defined as
1
. Larger the Better:S/N = -10log(1/n)
1/
---(1)
2. Smaller the Better:
S/N = -10log(1/n)
---(2)
Where n = no of repetition
3.2 Design Of Experiment
Eight machining parameters were selected as control factors, one parameter have two levels and seven parameters have three levels, denoted by 1, 2, and 3. The experimental design was based on L18 orthogonal array
based on Taguchi method. Minitab 15 software was used for graphical analysis of the obtained data.
Table 2 Wire EDM parameters and their levels
S.No Parameters Symbol Level 1 Level 2 Level 3 Units
1 Pulse On time T ON 5 10 - µsec
2 Pulse Off time TOFF 22 37 52 µsec
3 Open voltage OV 5 10 15 volt
4 Feed Rate override FR 10 20 30 mm/min
5 Wire feed WF 5 10 15 mm/sec
6 Servo voltage SV 35 55 75 volt
7 Wire tension WT 5 10 15 N
8 Flushing pressure WP 3 5 7 Kg/cm2
Table 3 Experimental design using L18 orthogonal array
S.NO TON TOFF OV FR WF SV WT WP
1 5 22 5 10 5 35 5 3
2 5 22 10 20 10 55 10 5
3 5 22 15 30 15 75 15 7
4 5 37 5 10 10 55 15 7
5 5 37 10 20 15 75 5 3
6 5 37 15 30 5 35 10 5
7 5 52 5 20 5 75 10 7
8 5 52 10 30 10 35 15 3
9 5 52 15 10 15 55 5 5
10 10 22 5 30 15 55 10 3
11 10 22 10 10 5 75 15 5
12 10 22 15 20 10 35 5 7
13 10 37 5 20 15 35 15 5
14 10 37 10 30 5 55 5 7
15 10 37 15 10 10 75 10 3
16 10 52 5 30 10 75 5 5
17 10 52 10 10 15 35 10 7
3. RESULTS AND DISCUSSION
Table 4 Experimental results of Cutting Speed, Surface Roughness and Dimensional Deviation
Trail No.
Cutting speed (mm/min)
S/N Ratio Surface roughness (µm)
S/N Ratio Dimensional deviation (%)
S/N Ratio
1 4.81 13.6429 1.82 -5.221 0.55 5.1927
2 5.12 14.1854 2.03 -6.168 0.60 4.437
3 4.28 12.6289 2.50 -7.961 0.51 5.8486
4 4.16 12.3819 2.54 -8.119 0.41 7.7443
5 4.11 12.2768 1.89 -5.549 0.59 4.583
6 3.86 11.7317 2.60 -8.289 0.63 4.0132
7 3.98 11.9977 1.59 -4.063 0.61 4.2934
8 3.12 9.8831 2.74 -8.744 0.45 6.9357
9 3.14 9.9386 2.93 -9.338 0.43 7.3306
10 5.86 15.3580 2.07 -6.332 0.49 6.1961
11 5.75 15.1934 2.90 -9.258 0.44 7.1309
12 5.10 14.1514 3.24 -10.229 0.38 8.4043
113 5.72 15.1479 3.65 -11.249 0.23 12.7654
14 4.32 12.7097 3.13 -9.902 0.22 13.1515
15 4.80 13.6248 2.88 -9.188 0.37 8.4043
16 4.17 12.4027 1.91 -5.606 0.23 12.7654
17 4.59 13.2363 2.73 -8.743 0.45 6.9357
18 4.50 13.0643 3.09 -9.819 0.51 5.8486
4.1.1 Effect of process parameters on Cutting Speed
In order to see the effect of process parameters on the cutting speed, experiments were conducted using L18 OA (Table 3). The experimental data is given in Table 4. Figure 2 show that the cutting speed increases with the increase in pulse on time and decreases with increase in pulse off time and open voltage. The effects of feed rate override, wire feed, servo voltage, wire tension and fluid pressure on cutting speed are not very significant.
10 5
14
13
12
52 37
22 5 10 15
30 20
10 14
13
12
15 10
5 35 55 75
15 10
5 14
13
12
7 5
3 T O N
M
e
an
o
f S
N
r
a
ti
o
s
T O F F O V
F R WF S V
WT WP
Main Effects Plot for S N ratios
Data Means
S ignal-to-noise: Larger is better
4.1.2 Selection of optimal levels
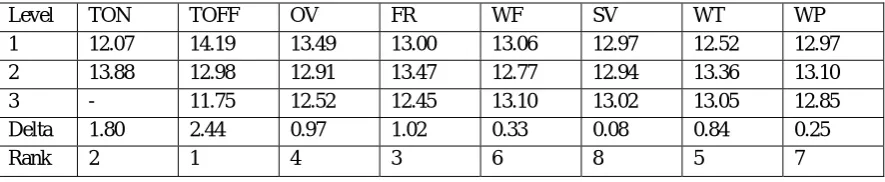
The response table 5 show the average of each response characteristic for each level of each factor. The tables include ranks based on delta statistics, which compare the relative magnitude of effects. The delta statistic is the highest minus the lowest average for each factor. Minitab assigns ranks based on delta values; rank 1 to the highest delta value, rank 2 to the second highest, and so on. The ranks indicate the relative importance of each factor to the response. The ranks and the delta values show that pulse off time have the greatest effect on cutting speed and is followed by pulse on time , feed rate override and open voltage in that order. As cutting speed is the “higher the better” type quality characteristic, it can be seen from Figure 2 that the second level of pulse on time, first level of pulse off time, first level of open voltage, second level of feed rate override, third level of wire feed, third level of servo voltage, second level of wire tension and second level of fluid pressure provide maximum value of cutting speed.
Table 5 Response Table for Signal to Noise Ratios for cutting speed Larger is better
Level TON TOFF OV FR WF SV WT WP
1 12.07 14.19 13.49 13.00 13.06 12.97 12.52 12.97 2 13.88 12.98 12.91 13.47 12.77 12.94 13.36 13.10
3 - 11.75 12.52 12.45 13.10 13.02 13.05 12.85
Delta 1.80 2.44 0.97 1.02 0.33 0.08 0.84 0.25
Rank 2 1 4 3 6 8 5 7
4.2.1 Effect of process parameters on Surface Roughness
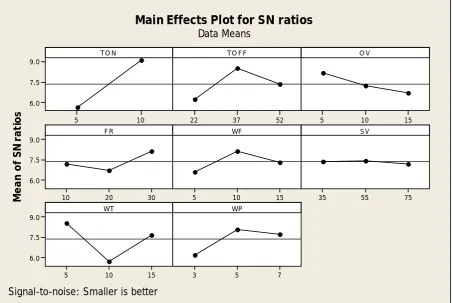
In order to see the effects of process parameters on the surface roughness, experiments were conducted using L18 OA (Table 3). The experimental data are given in Table 4. It is seen from the Figure 3 that surface roughness decrease with the increase of pulse on time, open voltage and wire feed and increases with increase in feed rate override and servo voltage. Surface roughness first decrease then increase with pulse off time. Surface roughness first increase then decrease with wire tension. The effect of other parameter is not significant.
10 5
-7
-8
-9
52 37
22 5 10 15
30 20
10 -7
-8
-9
15 10
5 35 55 75
15 10
5 -7
-8
-9
7 5
3 TO N
M
e
a
n
of S
N
r
a
ti
os
TO FF O V
FR WF SV
WT WP
Main Effects Plot for SN ratios
Data Means
Signal-to-noise: Smaller is better
4.2.2 Selection of Optimal Levels
The response table 6 show the average of each response characteristic for each level of each factor. The Table include ranks based on delta statistics, which compare the relative magnitude of effects. The delta statistic is the highest minus the lowest average for each factor. Minitab assigns ranks based on delta values; rank 1 to the highest delta value, rank 2 to the second highest, and so on. The ranks indicate the relative importance of each factor to the response. The ranks and the delta values for various parameters show that open voltage has the greatest effect on surface roughness and is followed by wire tension, pulse on time, servo voltage, pulse off time, fluid pressure, feed rate over ride and wire feed in that order. As surface roughness is the “lower the better” type quality characteristic, from Figure 3 it can be seen that the first level of pulse on time, first level of pulse off time, first level of open voltage, third level of feed rate over ride, first level of wire feed, third level of servo voltage, second level of wire tension and first level of fluid pressure result in minimum value of surface roughness.
Table 6 Response Table for Signal to Noise Ratios for surface roughness Smaller is better
Level TON TOFF OV FR WF SV WT WP
1 -7.040 -7.515 -6.752 -8.299 -7.748 -8.739 -7.635 -7.465
2 -9.918 -8.712 -8.053 -7.827 -8.004 -8.269 -7.118 -8.317
3 - -7.711 -9.132 -7.811 -8.186 -6.929 -9.184 -8.155
Delta 1.879 1.197 2.380 0.488 0.438 1.811 2.066 0.852
Rank 3 5 1 7 8 4 2 6
4.3.1 Effect of process parameters on Dimensional Deviation
In order to see the effects of process parameters on the dimensional deviation, experiments were conducted using L18 OA (Table 3). The experimental data are given in Table 4.
Figure 4 show that dimensional deviation increases with increase in pulse on time, pulse off time, wire feed and fluid pressure increases, the dimensional deviation first increases and then decreases. With the increase in open voltage and servo voltage decrement in the value of dimensional deviation is observed. Increasing wire feed and wire tension value dimensional first decrease then increase.
10 5
9.0
7.5
6.0
52 37
22 5 10 15
30 20
10 9.0
7.5
6.0
15 10
5 35 55 75
15 10
5 9.0
7.5
6.0
7 5
3 TO N
Me
a
n
o
f S
N
r
a
ti
o
s
TO F F O V
F R WF SV
WT WP
Main Effects Plot for SN ratios
Data Means
Signal-to-noise: Smaller is better
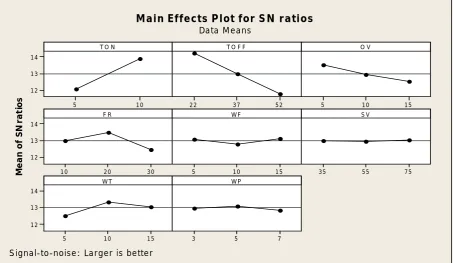
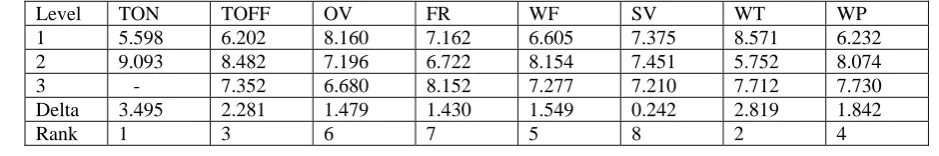
4.3.2 Selection of optimal levels
The response table 7 show the average of each response characteristic for each level of each factor. The tables include ranks based on delta statistics, which compare the relative magnitude of effects. The delta statistic is the highest minus the lowest average for each factor. Minitab assigns ranks based on delta values; rank 1 to the highest delta value, rank 2 to the second highest, and so on. The ranks indicate the relative importance of each factor to the response. The ranks and the delta values for various parameters show that pulse on time has the greatest effect on dimensional deviation and is followed by wire tension, pulse off time, fluid pressure, wire feed, open voltage, feed rate override and servo voltage in that order. As dimensional deviation is the “lower the better” type quality characteristic. from Figure 4 it can be seen that the second level of pulse on time, second level of pulse off time, first level of open voltage, third level of feed rate over ride, second level of wire feed, second level of servo voltage, first level of wire tension and second level of fluid pressure result in minimum value of dimensional deviation.
Table 7 Response Table for Signal to Noise Ratios for dimensional deviation Smaller is better
Level TON TOFF OV FR WF SV WT WP
1 5.598 6.202 8.160 7.162 6.605 7.375 8.571 6.232 2 9.093 8.482 7.196 6.722 8.154 7.451 5.752 8.074
3 - 7.352 6.680 8.152 7.277 7.210 7.712 7.730
Delta 3.495 2.281 1.479 1.430 1.549 0.242 2.819 1.842
Rank 1 3 6 7 5 8 2 4
5. CONCLUSION
1. The effects of pulse on time, pulse off time, open voltage, feed rate override, wire feed, servo voltage, wire tension and fluid pressure on cutting speed, surface roughness and dimensional deviation are experimentally investigated in machining of Skd 61 alloy using CNC Wire-cut EDM process.
2. The optimal sets of process parameters were obtained for various performance measures using
Taguchi design of experiment methodology.
3. From the present analysis it is obvious that the optimal parametric combination will be helpful for the people
working on materials of Skd 61 alloys.ACKNOWLEDGMENT
This work is supported by the Process and Product Development Centre Agra U.P. India. The authors are extremely thankful to Mr. Dinesh Kushwah he has technically assisted in experimental work.
REFERENCES
[1] Garg R. and Singh H. “Effects of process parameters on output characteristics in WEDM, International Journal of Manufacturing Science and Technology”, Vol.2, No.2, Dec.2008, pp. 103-112
[2] Garg R.et al (2009), “Effects of process parameters on material removal rate in WEDM, Journal of Achievements in Materials and Manufacturing Engineering”, Vol. 32, Issue-1, Jan., pp.70-74
[3] K.K. Choi, W.J. Nam and Y.S. Lee, “Effects of heat treatment on the surface of a die steel STD 11 machined by W-EDM”, J Mater Process Technol, 2008, Vol. 201, pp. 580-584.
[4] Liao Y.S. et al “A study on the machining parameters optimization of wire electrical discharge machining”, J Mater Process Techno Vol 71, pp. 487-493.
[5] Parmeswara, C.V.S. and Sarcar, M.M.M. (2009), “Evaluation of optimal parameters for machining brass with wire cut EDM”, Journal of Scientific and Industrial Research, 68, 32-35.
[6] Rao P.S. et al, “Effect of WEDM conditions on surface roughness, a parametric optimization using Taguchi method”, IJAEST, 2011 Vol. No, 6, Issue No.1, pp.41-48.
[7] Ross P. J. “Taguchi techniques for quality engineering”, McGraw-Hill Book Company, New York
[8] Sanchez J.A. et al, “On the influence of cutting speed limitation on the accuracy of wire-EDM corner-cutting”, J Mater Process Techno, 2007, Vol. 182, pp. 574-579.