Original Research
CGCD technique to find the kinetic parameters of TL glow curves
L. Robindro Singh1*, S. Dorendrajit Singh2* and T. Dwijen Singh3
1 Department of Physics, PUC, Mizoram University, Aizawl 796001, India 2 Department of Physics, Manipur University, Canchipur 795003, India
3 Department of Physics, Birmangol College, Sawombung, India
Received 6 March 2011 | Revised 20 June 2011 | Accepted 24 June 2011
ABSTRACT
The behavior of ZnS:Mn,Cu,Cl phosphor by the effect of pressure was studied on the thermolumi-nescence (TL). Two prominent peaks were visible, increasing pressure the prominent peaks were also shifting to the higher temperature. Kinetic parameters of the glow curves were determined by computerized glow curve deconvolution (CGCD) technique. The order of kinetics (b) was found to be independent of pressure. All the peaks can be fitted with b=1.5. Computerised glow curve decon-volution (CGCG) method was used to determine the activation energy (E) order of kinetics (b) and frequency factor (s) of the different peaks present in the phosphor.
Key words: Computerized glow curve deconvolution; glow curve; kinetics; thermoluminescnece.
Corresponding authors:
E-mail: [email protected] (SDS)
[email protected] (LRS) INTRODUCTION
Thermoluminescence (TL) appears as a very complex phenomenon. It is an indispen-sible tool for the exhaustive study of the na-ture, thermal stability and concentration of electron and hole trapping centres in lumines-cent materials. Extensive studies on the pho-toluminescence (PL) and TL properties of ZnS have been carried out since the past dec-ades for both bulk as well as nanocrystalline form. ZnS is a direct band gap II-VI com-pound semiconductor having a band gap of 3.6 eV at room temperature with low phonon energy which is suitable for applications in display devices. Chen et al.1 could successfully
erized glow curve deconvolution (CGCD) technique for the analysis of a composite TL glow curve into its individual glow peaks has been applied.4 Many functions describing a single glow peak have been proposed, which are summarized extensively.5-9
Lang et al.10 recorded high pressure and low temperature TL glow curve of ZnS:Mn,Cu,Cl phosphor with a linear heating rate of (b) = 0.74°Cs-1. They reported the pres-ence of two-peak system. As pressure in-creases new shallower traps are appeared. The pressure dependence of four traps are estab-lished. By comparison with pressure measure-ments on ZnS doped Mn+2 and only with de-fects Cu+ and Cl-, they established that the deepest trap is associated with defects intro-duced by Mn+2, while the two traps next lower in energy are associated with defects introduced by Cl-. The shallowest trap could not be assigned to a specific defect.
A number of methods are developed to determine the kinetic parameters such as acti-vation energy, frequency factor and order of kinetics. The value of activation energy of a TL peak indicates the stability of the electrons trapped in a defect centre. This concept has implications about the applicability of the ma-terial for dating and dosimetry purposes. In this paper, we used the CGCD to decode the different trap levels of the ZnS:Mn,Cu,Cl phosphor. The glow curves were subjected to CGCD in the kinetics formalism.
THEORY
The equation of motion governing traffick-ing of charge carriers can be written as11
(1)
(2)
(3)
where m, ncand n represent the concentration
of holes trapped in recombination centres, electrons in the conduction band and electron traps of density N. E and s denote the activa-tion energy and frequency factor. Am and An are respectively recombination and retrapping probabilities respectively. The TL intensity I (t) is directly proportional to the rate of de-creasing the number of holes in the recombi-nation centres. As one uses linear heating pro-file (T=T0+βt) in recording TL glow curves, it is convenient to express the rate equation in terms of temperature in absolute scale involv-ing heatinvolv-ing rate β.
When the recombination probability domi-nates the retrapping probability the expression for TL intensity follow the first order kinetics (b=1) and rate equations (1-3) gives the ex-pression for TL intensity as12
(4) where n0 is the initial concentration of trap electrons, T0 the initial temperature before heating the sample, s the frequency factor, E the activation energy, k the Boltzmann con-stant and β the linear heating rate.
When the retrapping probability is the same as recombination probability then the expression for TL intensity following the sec-ond order kinetics becomes13
(5)
where s=Ns' and N is the number of electron traps.
For the non-first order kinetics (b≠1). Gar-tia et al.13 and Rasheedy14 reported an expres-sion for TL intensity as
(6) ( ) m c E kT c n c dm
I(t) A mn
dt dn
sne N n n A dt
dn dm dn dt dt dt
] exp exp exp 0
0 ( E/kT)dT
β s [ E/kT) ( s n I(T) T T
T T T d T k E s n kT E s n T I 0 2 0 2 0 ] ) / exp( ) / ( 1 /[ ) / exp( ) (
T T T d T k E s n kT E s n T I 0 2 0 2 0 ] ) / exp( ) / ( 1 /[ ) / exp( ) ( ) 1 ( 1 exp( / ) ]) 1 ( 1 )[ / exp( ) ( 0
b bT
T b
bs E kT b f s E kT dT
Nf T I ) 1 ( 1 ] ) / exp( ) 1 ( 1 )[ / exp( ) ( 0
b bwhere filling factor f=n0/N.
The condition for maximum intensity for the glow curve obeying equation (6) is given by
(7)
The shape factor μg, of the glow curve can also be determined from the relation8
μg=δ/ω = (T2 – Tm)/ (T2 – T1 ) (8)
where Tm is the peak temperature of the glow curve and T1,T2 are the temperatures at half of the maximum intensity on the raising and fal-ling sides of the glow curves. Equation (4-6) are conveniently used in fitting TL glow peaks. Nonlinear least square fitting is gener-ally used in curve fitting . Chi squared test or figure of merit7 was used for the criteria of best fitting.
RESULTS AND DISCUSSION
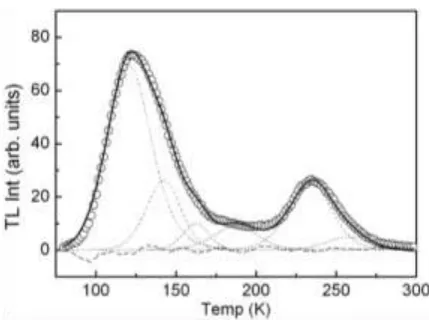
Figure 1 shows typical set of TL glow curves of ZnS:Mn,Cu,Cl recorded with a lin-ear heating rate β=0.74 K/sec10. As reported,
there is an intense TL peak at 133 K and a less intense peak at 236 K at ambient pres-sure. These peaks shift to higher temperature with increasing pressure. At 10 kbar pressure a new peak appears at low temperature. At 25 kbar another peak appears between 133 and 236 K. Lang et al.10 evaluated the activation energy of TL peaks using various heating rate method. The values of activation energies are 0.15, 0.3 and 0.5 eV. For the same peak the activation energies are reported to increase with increase of pressure.
m
T
T
m b
m
b f E kT
E bskT T
d T k E s
f b
0
) / exp( )
/ exp( ) ( ) 1 (
1 1
2 1
m
T
T
m b
m
b f E kT
E bskT T
d T k E s
f b
0
) / exp( )
/ exp( ) ( ) 1 (
1 1
2 1
Figure 1. Deconvolution TL glow curves of
ZnS:Mn,Cu,Cl phosphor of pressure =0 kbar. The sym-bols ooo indicates the experimental curves, ….. the deconvoluted curves and ____ Sum of the deconvo-luted curves.
Tm (K) Energy (eV) b (order) S (sec-1) FOM
120.56 142.4 162.68 187.64 234.44 257.84
0.1 0.19 0.34 0.26 0.42 0.52
1.5 1.5 1.5 1.5 1.5 1.5
8.2x10²
4.0x10⁵
3.6x10⁹
5.7x10⁵
6.7x10⁷
9.4x10⁸
0.000946
117.2 154.5 179.2 204 225.7 247.4 273.2
0.1 0.18 0.28 0.42 0.53 0.72 0.72
1.5 1.5 1.5 1.5 1.5 1.5 1.5
1.1x10³
4.5x10⁴
5.3x10⁶
1.9x10⁶
5.9x10¹⁰
4.3x10¹³
1.7x10¹²
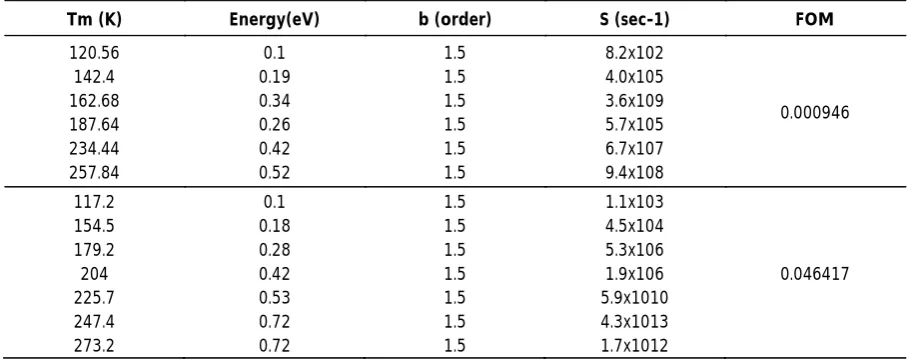
TL glow curve of ZnS:Mn,Cu,Cl phosphor without giving any pressure shows the pres-ence of two prominent low temperature TL peaks at around 133 K and 234 K. The full width at half peak intensity points is consid-erably large. Large value of FWHM indicates that the glow curve is a composite one. The shape factor of the glow peak is also found to be above 0.48. This glow curve is deconvo-luted with the conventionalglow curve deconvolu-tion technique to find out the trapping pa-rameters of the glow curve. The composite curve appearing only two peaks can be decon-voluted into six TL peaks (Fig. 2). All the curves can be fitted with the same order of kinetics b=1.5. The kinetics parameters such as activation energy E, frequency factor s and order of kinetics are shown in Table 1. The figure of merit implies the validity of CGCD to extract kinetic parameters.
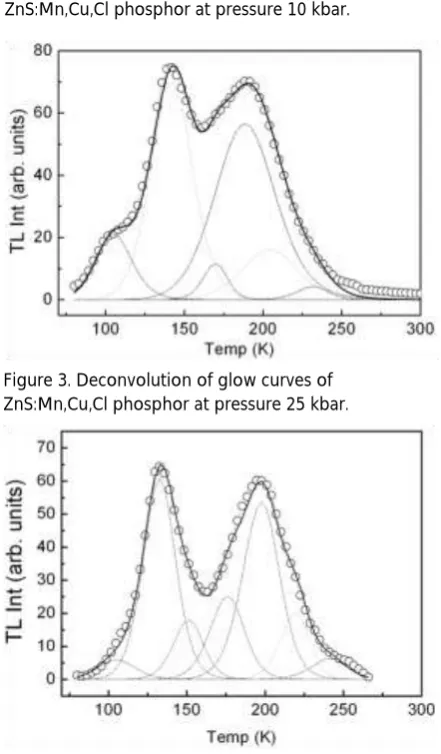
In order to study the effect of pressure on the characteristics of TL glow curves, a num-ber of TL glow curves were recorded with dif-ferent values of pressure. New TL peaks were observed after the application of pressure. Lang et al.10 reported change in activation en-ergy of TL peaks with the change of pressure. In this context, it is to be noted that the acti-vation energy of a TL peak is an intrinsic pa-rameter of the trap. This fact inspires us to investigate whether there is change in activa-tion energy with increase of pressure. Accord-ingly CGCD technique is again applied to the TL peaks recorded with a pressure of 10 kbar. The glow curve clearly shows the presence of three TL peaks. The prominent peak is around 154 K shifting to the higher tempera-ture followed by the shoulder peaks at 120 K and 272 K (Fig. 2). When CGCD is used it is evident that the glow curve can be deconvo-luted to 7 peak systems. The trapping parame-ters of the seven peaks in Figure 2 along with the figure of merit are again given in Table 1.
S i m i l a r l y T L g l o w c u r v e s o f ZnS:Mn:Cu:Cl phosphor ( Pressure = 25 kbar & 58 kbar) have been analysed by CGCD. It has been demonstrated that glow curves in
Figure 2. Deconvolution of glow curves of ZnS:Mn,Cu,Cl phosphor at pressure 10 kbar.
Figure 3. Deconvolution of glow curves of ZnS:Mn,Cu,Cl phosphor at pressure 25 kbar.
reality are composite, consisting of a number of elementary peaks following general order (GO) of kinetics. The glow curve can be de-convoluted to 6 peak systems for pressure = 25 kbar (Fig. 4). The similar second curve for pressure 58 kbar is also shown (Fig. 5). It can be deconvoluted to 7 peak systems. The trap-ping parameters (E, s and b) and figure of merit (FOM) are quite acceptable and justifies the fitting (Table 2). In all cases it is observed that the order of kinetics remains constant. There is not much change in the values of ac-tivation energies with or without pressure.
CONCLUSION
The thermoluminescence (TL) glow curves of ZnS:Mn,Cu,Cl can be fitted to general or-der (GO) kinetics formalism. The oror-der of kinetics of all the peaks was found to be 1.5 irrespective of pressure. The effect of pressure was manifested mainly in the location of the glow peak temperature. The activation energy was found to be independent of pressure.
ACKNOWLEDGMENT
LRS acknowledged UGC-NER, Guwahati
for financial assistance under minor project No. F.5-309/2009-10(MRP/NERO)/5846.
REFERENCES
1. Chen W, Wang Z, Lin Z & Lanying L (1997). Absorption and luminescence of the surface states in ZnS nanoparti-cles. J Appl Phys, 82, 3111-3115.
2. Singh SD & Singh TD (2001). National Seminar on Lumi-nescence & (NSLA-2001) Jan 17-18. Determination of kinetic parameters of ZnS nanoparticles using CGCD. Osmania University, Hyderabad, India, pp. 423-429. 3. Singh LR & Singh SD (2003). On the shape of TL glow
curves. Proceedings of NSLA-2003 14-14 Feb. 2003, NPL, New Delhi, India, pp. 209-211.
4. Gartia RK & Singh SD (1003). Analysis of peak V of LiF TLD-100 by curve fitting. Phys Stat Sol (a), 135, K83-K91. 5. Chen R & Kirsh Y (1981). Analysis of Thermally Stimulated
Processes. Pergamon, UK, pp. 39-325.
6. McKeever SWS (1985). Thermoluminescence in Solids. Cambridge University Press, pp. 89-209.
7. Horowitz YS & Yossian D (1995). Computerised glow curve decomvolution: application to thermoluminescence dosimetry. Rad Prot Dosim, 60, 290-295.
8. Bos AJJ, Piters TM, Gomez RJM & Delgado A (1993). Suc-cess and failure of the Randall-Wilkins Model for Ther-moluminescence in LiF(TLD). Rad Prot Dosim, 47, 41-47. 9. Bos AJJ, Piters TM, Gomez Ros JM & Delgado A (1994).
An intercomparison of glow curve analysis computer
Tm (K) Energy(eV) b (order) S (sec-1) FOM
120.56 142.4 162.68 187.64 234.44 257.84
0.1 0.19 0.34 0.26 0.42 0.52
1.5 1.5 1.5 1.5 1.5 1.5
8.2x10² 4.0x10⁵ 3.6x10⁹ 5.7x10⁵ 6.7x10⁷ 9.4x10⁸
0.000946
117.2 154.5 179.2 204 225.7 247.4 273.2
0.1 0.18 0.28 0.42 0.53 0.72 0.72
1.5 1.5 1.5 1.5 1.5 1.5 1.5
1.1x10³ 4.5x10⁴ 5.3x10⁶ 1.9x10⁶ 5.9x10¹⁰ 4.3x10¹³ 1.7x10¹²
programs: II. measured glow curves. Rad Prot Dosim,51, 257-264.
10. Lang JM, Dreger ZA & Drickamer HG (1992). High-pressure thermoluminescence and photoluminescence study of ZnS:Mn:Cu:CB phosphor. J Appl Phys, 71, 194-197.
11. Halperin A & Braner AA (1960). Thermal activation ener-gies in NaCl and KCl crystals. Phys Rev, 117, 416-422.
12. Randall JT & Wilkins MHF (1945). The phosphorescence of various solids. Proc Royal Soc London A,184, 347-364. 13. Gartia RG, Singh SD & Mazumdar PS (1993). On the glow
curve shape and plateau test. The case of non-first-order kinetics. Phys Stat Sol, 138, 319-326.
14. Rasheedy MS (1993). On the general-order kinetics of the thermoluminescence glow peak. J PhysCondens Matter,