©2014 JNAS Journal-2014-3-11/1262-1267 ISSN 2322-5149 ©2014 JNAS
Predicting the price index and cash return of
Tehran stock exchange using linear and
non-linear methods
Saeedeh Rezaee
*and Abolfazal Ghadiri Moghadam
Mashhad Branch, Islamic Azad University, Mashhad, Iran
Corresponding author:
Saeedeh Rezaee
ABSTRACT: This research investigates the price index and cash return of Tehran stock exchange using ant colony algorithm and the support vector machine method. First, thirty financial relations were selected as the primary independent variable and after a stepwise test it was revealed that fourteen relations had a significant relationship with the abovementioned index, which were selected as the final independent variables. The statistical population of this research includes all the listed companies in Tehran stock exchange that: 1) have active during a 4-year period from 1387 to 1390; 2) the end of their fiscal year is at the end of Esfand; 3) they have no financial period change during the studied period; 4) they are not investing companies, financial broking companies, banks leasing companies; and 5) their required data are available. Ultimately, given the mentioned limitations a total of 130 companies (520 fiscal years) were selected as the statistical sample of the research. The results of this research indicate that linear algorithms such as the support vector machine method perform better in predicting the price index and the cash return than non-linear ones such as ant colony algorithm.
Keywords: price index and cash return of Tehran stock exchange, prediction, support vector machine, Ant colony algorithm.
INTRODUCTION
The problems pertain to transactions and financial markets are one of the domains which its modeling and description is attractive for human and the human was tried to select his financial properties to predication future situation so that increase profits obtained. Ahangari 2010. The investors in effort for predication supposed that processes of future of stock exchange are based on events ad current and past data. Majehei and 2009. Exact predications are difficult since it is not possible to modeling, quantity or know previous cause like external events. Asadi and , 2010. Time series predications are considered because of different specifications which are cited on it like irregular, instability and disorder. Because of it, many statistical models are suggested to predicate financial events based on historical data. Arayjoo and , 2009. The aim of time series predication is to use figures observed from quantity considered for making model in which is used for predication of future figures during long or short term period. Time series predication was performed in different courses like physics, engineering and financial affairs. Modarres Najafabadi, 2009. Restoration of predication is remained as first predication problem especially for predication of stock exchange, yet little restoration ca influence positively on investment interest. Support vector machine was proposed by Vikin firstly, in one side, vast range of applied programs like predication of stock exchange was used. Experimental results showed that support machine have better performance than traditional and neural networks and clustering methods. Hag Cheng and Vang 2007, Chen ad Sahine 2006, Lee 2007 and Manish and Tenmouzhi 2006.
Background
1263
networks. In fact, a first evaluation of neuron networks was expanded for assembling to LM algorithm. Also, they used pre processing data like data transfer and select entrance variables for restoring model. Ability of method proposed like operation of predication of index are tested in press. The results showed that their method proposed can cope with fluidity of stock exchange and offer perfect of exit. Then, it can be used for modeling complex relations between entrance and exit for finding data pattern whereas, perform financial predications. Kara and 2011,used two models for efficient predication of National 100 Istanbul stock exchange and compared their performance. The models are based on two models of clustering like artificial neural networks and support vector. The experimental results showed that performance of artificial neural networks 75.74% is better than support vector 71.52%. fitchang 2010 presented new learning method which is named as Regression Vector Support, RVM and is effective learning technique for clustering problems and regression and applied it for predication of fluidity of Shanghai composite index based on GARCH. Returning vector support, minimum vector support and GRACH 1 was used. The experimental results showed that performance of vector regression machine is better than other methods. Ritanjoo and 2009 compiled a model based on FLANN for short term predication, one day, one months, two months about indices of DJIA and S&P. vast simulation and results showed use of FLANN offered market predication which is comparable to optical methods. Egli and 2003, predicated ISE and its network entrance were rate of conversion of dollar into lire I yesterday, number of index in yesterday, rate of night interest and five virtual variables for five days of week. The results showed that neural; networks had exact predication than five en ten days. Demori and 2011, predicated total index of stock with use of birds flight algorithm and compared its performance to traditional patterns. Sampling period is ten years from 1999 to 2008 in which index of total price was used for predication and patterning. For this, firstly, an intelligent framework was designed and then birds flight algorithm and simple traditional pattern , Helt Winters, auto regression, metric average and Arma were used, similarly in comparison of birds flight algorithm to Arim was recognized that predication error is a few than Arima that is used for predication of future index of exchange. Sheraee and Saneealam 2010 discussed long term memory in time series of Tehran stock exchange. Results of statistical society confirmed long term memory in yield and total frequency of Tehran stock exchange. They compared specifications of models that don’t consider long term memory GACRH and Arma with similar models like FIGRACH and ARFIMA to sliding window method in time series yield. The results showed that simple model of ARMA is better than other models one day after that but offered better results in predication of weekly, monthly, seasonal, and six months periods of FIGARCH.
Hypothesizes:
Support vector method has better ability than ants algorithm for predication of prices and cash yield.
Research Domain
Subjective domain: subjective domain of current research is pertaining to financial researches that discussed and recognize ability of predication by support vector method and ant colony algorithm.
Spatial domain: this research is about determination of statistical society, select statistical society and test of hypothesis of Tehran stock exchange.
Time domain: the time domain is between 2008 till 2011 for 4 years in order to collecting data.
Statistical society:
Statistical society consisted of all companies accepted in Tehran stock exchange which had activity during 4 years from 2008 to 2011 and their financial years were ended to Esfand and did not change financial period and are not investment, broker, banks and leasing and their data are available at last, as for limitations, 130 companies are selected statistical society.
Variables
Dependant variables:
1264
= current rate = rate of property ROA
=fixed property circulation = cash rate
= possessed rate = capital yield ROE
= yield of sale ROS = current rate of debt to special value
= circulation of yields = rate of cash circulation
= evaluation of loan suitability = rate of fixed property to special value
= rate of debt = rate of article to circulation capital
=margin of fixed interest = rate of cash
= circulation of properties = circulation capital into net of operational expenses
= rate of debt coverage Current debt, current property=circulation capital
= gross interest margin = debt to owners of stocks DER
= sale to circulation capital = circulation of current capital
= course of remit of debts = interest stock (EPS)
= immediate rate = invoices circulation
= rate of obtain capital =interest coverage
Method for reduction variables:
For selecting optimal variables between 30 independent variables, Pearson correlation test with use of SPSS version 19 was used and variables had the highest correlation were selected for discussion of hypothesis by ant algorithm and support vector machine.
Analysis results showed that 14 rates had the highest correlation are presented following.
Rate of obtain capital Evaluation of loan suitability
Debt to owners of stock Properties yield
Remittance circulation Capital yield
Interest of every stock Capital in net circulation
Sale of yield Margin net interest
Rate of cash suitability Course of remittances
Circulation of fixed property Interest coverage
Collections
For collecting data, two sources are used.
1. The librarian method is used for providing of theoretical bases and background of research.
2. Information, data required for extraction of high variables is extracted by Rahavard Nowin software by Tehran stock exchange.
Analyzing data
In this research, descriptive and conferred statistics were used simultaneously. Descriptive statistics offer some estimation in sample and with use of conferred statistics, we can judge about total statistical society based on results. For testing hypothesis, T test was used. Also, for discussion ant colony algorithm, and support vector machine were used.
For evaluation of predication models, medium percent error MPW was used. This scale is calculable by percent of errors and real values. model of medium percent error is as following:
In said model,
MPE = Medium of average error
ft = Predicated value at = Error value N = Number of data discussed
Ever MPE is close to zero, it is more close to reality the predication of algorithms.
Use of research algorithm for predication
For assembling algorithms MTLAB software version R2011a 12/7 was used.
1265
Support vector machine
It is one group of classified algorithms that predicate a sample of class, suppose that n educational sample is
located in real; space with dimensions p, for every we can write
where ci is exit of every class for educational sample. We want to find that class points of ci=1 separates for educational sample of I. equation of this page is as wx=b=0 which w is normal vector and b is distance from
destination to normal vector. For every sample, is true. Thus, sample of xi belonging to second class is
true. Otherwise, if is true, sine sample xi belongs to second class, b and w values are selected as if
maximum condition is supplied. In optimal problem of two said relations, is relation one which is minimize bw that is maximize distance is based on soft classification. From variable c, which is incorrect scale of
classification, is used, then relation 1 is written as , for which this is soft classification method
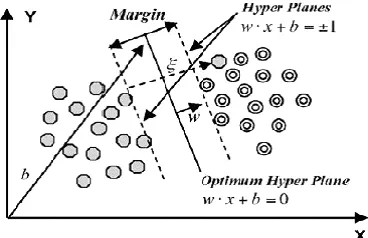
which its inaccuracy is recognized then relation 2 is confronted with it, which is minimized its w and Lagrange factors is formed. Figure 3 shows Covers and Colecsion 2009.
Figure 3. Display support vector machine
Optimization algorithm of ant colon
Ant colony algorithm or ant algorithms is inspired from natural ants that live in a great collections. In ant algorithms, one collection of colony is solved a collection of ants as well as discreet with use of its definition as a
graph. The data which is stored by searching is offered by Fermone as on . In fact, fermone values are a long term memory for saving data of all ants. Regard to definition of problem, they can make on all or part of graph yawls. In some of problems, first data is defined by quantities pertain to yales. These quantities are named as mental
or non reasonable values, for yale it is defined as . These data are used by ants but its resource is not ants itself. But it is an external factors or problem which is derived by using of ants. Orlario and Zomiya 2006, Glover and Kochenberger 2003 and Alfonezti and 2007, as simplicity, ants activity is summated. Sum of ants moved as non coordinated on graph as simultaneously which make saved data on the top of graph. When the solution is made by ant or during making is evaluated, and ant informed quality of its response by splitting fermone on its lane to others, the information which are in fermones, will be directed searching for next ants. Brabazone and Nil 2006, Olario and Zomaria 2006, Glover and Gochenberg 2003 and Ingelberge 2007 and Koing 2003 and Fernandez and 2007.
1266
Experimental Results of Research:
Results of predication of linear and non linear model in example 2 are evaluated. As for this table, SVM model is performed by non linear model.
Figure 2. Results of predication performance of different models
Rate of vector support machine Rate of recognition of ants algorithm
19608/90 52941/23
07843/96 2549/37
38462/90 61538/34
46154/88 23077/44
23077/94 46154/38
03922/98 09804/45
46154/88 53846/36
07692/98 53846/36
07843/96 41176/29
15385/96 69231/32
61614/93 8371/35
Research hypothesis of vector support machine has high ability than predication of prices and cash yield. As for the results which is shown in figure 2, predication of price index and cash yield have rate of recognition as 61/93% and ants algorithm 83/35% and, first hypothesis is accepted.
Method Rate of recognition
Result
Ants algorithm 83/35%
Confirmation
Support vector machine 61/93 %
Concluding
Support vector machine which was proposed by Vickin firstly is used in vast range of applied programs like financial of stock exchange. The experimental results showed that support vector machine has better performance than traditional and neural networks and clustering. Hang Cheng and Vang 2007 and Chen and Shon 2006 and Lee 2007, Manish and Tenmozi 2006.
In this research we used price index and cash yield TEDPIX from SVM models and ant colony algorithm. Rate of predication of SVM is 93/61% and rate of predication of ant algorithms is 83/35%.
Persian References:
Ahangari Mahnaz, 2010, p0redication of financial depression of companies with use of Lojit model and fuzzy neural networks in Tehran stick exchange, Thesis for master degree course, Islamic Azad University, Neyshabour Branch, p 2-7 Demori Daryoush, Farid Daryoush, Ashhar Morteza, 2010, predication of total price with use of birds flight algorithm and its comparison with traditional patterns , accounting knowledge magazine, second year, no,5, p 7-30
Sharaee Saeed and Sanaee alam Mohsen, 2010, discussion of nature of long term memory in Tehran stock exchange and evaluation of models that consider long term memory. Financial accounting research magazine, second year. No.4, 6, p 173-186.
REFERENCES
Alfonzetti S, Dilettoso E and Salerno N. 2007. "Simulated Annealing With Restarts for the Optimization of Electromagnetic Devices", IEEE Transactions on Magnetics, vol 42, no. 4, April 2007
Araujo de A, Ferreira R and Tiago AE. 2009. ” A Morphological-Rank-Linear evolutionary method for stock market prediction” Information Sciences journal homepage: www.elsevier.com/locate/ins pp1-6
Asadi SH, Hadavandi E, Mehmanpazir F & Nakhostin MM. 2012. ” Hybridization of evolutionary Levenberg–Marquardt neural networks and data pre-processing for stock market prediction” Knowledge-Based Systems journal homepage: www.elsevier.com/ locate/knosys pp2-12
Brabazon A and O’Neill M. 2006. "Biologically Inspired Algorithms for Financial Modeling",Springer-Verlag Berlin Heidelberg, 2006.
Chen WH & Shih JY. 2006.” A study of Taiwan’s issuer credit rating systems using support vector machines”. Expert Systems with Applications, 30(3), pp427–435.
1267
Birgale E. 2003. « stock market prediction using Artificial Neural Networks », Web: WWW. Hicbusiness. Org / BIZ 2003 proceedings. market Index”, European Journal of Economic and social system, 14, No 1, PP. 81-91.
Engelbrecht AP. 2007. "Computational Intelligence, 2nd Edition", John Wiley & Sons Ltd.
Fama EF. 1970. “Efficient capital market: A review of theory and Empirical work”, the Journal of finance No, 2. pp. 383-417. Fernandez JM, Gil JM and Zapata J. 2007. "Ultra wide band Optimized Profile Monopole Antenna by Means of Simulated
Annealing Algorithm and the Finite Element Method", IEEE Transactions on Antennas and Propagation, vol 55, no. 6. Glover F and Kochenberger GA. 2003. "Handbook of Met heuristics", Kluwer Academic Publishers.
Huang CL, Chen MC & Wang CJ. 2007.” Credit card scoring with a data mining approach based on support vector machine”. Expert Systems with Applications, 33(4),pp 847–856.
Kara Y, Boyacioglu MA & Baykanomer K. 2011. “Predicting direction of stock price index movement using artificial neural networks and support vector machines: The sample of the Istanbul Stock Exchange” Expert Systems with Applications 38 journal homepage: -www.elsevier.com/locate/eswapp 5311-5314
Kavzoglu T and Colkesen I. 2009. A kernel functions analysis for support vector machines for nd cover classification, International Journal of Applied Earth Observation and Geoinformation, 352-359.
Kim MJ, Nelson CR and starts R. 1991. “Mean Reversion in stock price? A. Reappraisal of the empirical Evidence”. Review of Economic studies, Vol 58 (3), No. 195. PP. 515-528.
Lee YL. 2007.” Application of support vector machines to corporate credit rating prediction”. Expert Systems with Applications, 33(1),pp 67–74.
Majhi Ritanjali Panda G and Sahoo G. 2009. ” Development and performance evaluation of FLANN based model for forecasting of stock markets” Expert Systems with Applications 36 journal homepage: %%www.elsevier.com/locate/eswa pp 6800-6805
Manish K & Thenmozhi M. 2005. ” Forecasting stock index movement: A comparison of support vector machines and random forest”. In Proceedings of ninth Indian institute of capital markets conference, Mumbai, India. <http://ssrn.com/abstract=876544>. Pp 1526-1530
Najafabadi M & Sayed R. 2009. “Prediction of Stock Market Indices using Machine Learning” Your file Votre reference ISBN: 978-0-494-56856-9 pp10-26
PhichhangOu and Hengshan W. 2010. Predict GARCH Based volatility of shanghai composite Index by recurrent relevant vector machines and recurrenlaest square support vector machine Journal of Mathematics research vol 2 no 2 pp 11-19 Olariu S and Zomaya AY. 2006. "Handbook of Bioinspired Algorithms and Applications", Taylor &Francis Group, LLC Press,
2006.