Maps for Easy Paths (MEP): Accessible Paths Tracking
and Reconstruction
S. Comai
1,*, E. De Bernardi
1, M. Matteucci
1, F. Salice
11Dipartimento di Elettronica Informazione e Bioingegneria, Politecnico di Milano – Piazza L. da Vinci 32, 20133 Milano,
Italy
Abstract
MEP (Maps for Easy Paths) is a project for the enrichment of geographical maps with information about accessibility of urban pedestrian pathways, targeted at people with mobility problems. In this paper, we describe the tools developed to collect data along the paths travelled by target people and the algorithms for a good quality reconstruction of the path developed to overcome the intrinsic limitation of the sensors available on mobile devices. Experimental results show the feasibility of the approach.
Keywords: City accessibility, path reconstruction, motor impairments, mobile application.
Received on 28 September 2016, accepted on 07 December 2016, published on 31January 2017
Copyright © 2017 S. Comai et al., licensed to EAI. This is an open access article distributed under the terms of the Creative
Commons Attribution licence (http://creativecommons.org/licenses/by/3.0/), which permits unlimited use, distribution and reproduction in any medium so long as the original work is properly cited.
doi: 10.4108/eai.31-8-2017.153050
1. Introduction
According to World Health Organization, about 15% of the world’s population has some form of disability and traveling through cities is one of the main concerns for people with mobility impairments [19]. Some help could come from an adaptive navigating system capable of considering their needs and taking into account the (mapped) accessibility of urban routes. Nevertheless, mapping accessible paths in a sustainable way is still an open challenge. Indeed, the most cumbersome activity in providing a map enriched with accessibility information is gathering such information through field surveys, typically done manually by users or volunteers.
Maps for Easy Paths (MEP) is an ongoing project [11] aiming to overcome the limitations of current collaborative approaches in mapping accessible routes by easing the surveying effort through the collection of motion data from sensors commonly available in mobile devices. The accessibility of city routes, e.g., sidewalks, walkways, etc., is defined through the active contribution and participation
*Corresponding author. Email: [email protected]
of target users, which include people with permanent or temporary motor disabilities and, possibly, active citizens. To ease target users and volunteers in data collection, we developed a set of tools to track, and automatically reconstruct, paths travelled by target users. In particular, we developed a mobile application called MEP Traces that automatically stores mobile sensors data such as position estimates from GNSS satellites (Global Navigation Satellite System) and motion data coming from accelerometers, magnetometers, and gyroscopes. When users travel through the city, they just need to start the app at the beginning of their journey and stop it when they arrive. The underlying idea is that the route travelled by a person with some sort of disability can be considered accessible also for other persons having the same (or a lower) type of disability. More in general, we assume that a path taken mostly by people with disabilities can be perceived as a friendlier route; this allows us to automatically identify accessible paths without the need of an ad-hoc field survey simply because the traveller who captures the data has been register to have some specific sort of disability.
2 Once sensors data of a route have been collected, they are processed by means of different algorithms: sensor fusion techniques improve the sparseness of GNSS data; mapping on cartography can improve the quality of the paths; clustering techniques can merge different traces over the same route.
After reporting related works in Section 2, in Section 3 we provide an overview of the MEP project: in particular, we describe the MEP Traces application and the overall process to extract the accessible paths. In Section 4 experimental results of a survey done in Cernobbio (Como, Italy) are reported, while in Section 5 we draw our conclusions and outline future plans.
2. Related work
Several collaborative projects proposed in the literature aim to improve city accessibility, through the Web or, more recently, through smartphones/tablets applications, as surveyed in [5]. Different types of barriers, but also of facilitators, have been identified and classified in several studies [10][12], such works are at the basis of our analysis for the collection of data about accessibility of city pedestrian pathways.
Considering the status of Web/Android/iOS applications available to the public, almost all of them focus on accessibility of points of interest (e.g., museums, restaurants, etc.). Among them, Wheelmap [20] is a map for finding and marking wheelchair accessible places of daily life, based on Open Street Map.
Only some of available apps include also information about condition of sidewalks and pedestrian crosswalks, or about the presence of cobblestones, curb ramps, and street lighting, such as RotaAccesivel [17], Comuni per tutti [6] and Mapability [9]. These proposals are very general and try to address all the disabilities. However, the collection of data is quite heavy, being mainly manual.
In the literature, solutions for the identification of accessible paths and sidewalk conditions have been considered only by few approaches, like, e.g., [4][8][14][18]. Cardonha et al. [4] adopted an approach, in part, similar to MEP: the Breadcrumb application was developed to periodically capture a sequence of measurements based on the device geo-location (i.e., longitude and latitude) without any need for user intervention. To enhance the quality of the collected data, Breadcrumb applies a simple moving average of the last 10 estimates of the velocity of the device to identify slowdowns as obstacles. Compared to Breadcrumb, in our approach we try to extract as much as information as possible from the available sensors fusing the GNSS (Global Navigation Satellite System, at present GPS and GLONASS) with the inertial data in order to reconstruct the exact path of the user, supposed to be accessible as explained in Section 3.
Karimi et al. [8] propose a routing module which tracks the shuttles available in the main campus of the University of Pittsburgh and, given an accessibility map built
manually, they provide turn-by-turn directions distinguishing among sidewalks along a street, along a building, and crosswalks along a building. Also [14] collects GPS data to determine the users’ trajectories and provides an algorithm to determine an accessible path between two locations for users with a certain disability: however, to the best of our knowledge, only a prototype has been produced. Finally, also the authors in [18] consider sidewalks, by providing a mobile application to capture pictures and upload data about some observable aspects of sidewalk conditions such as holes, presence of steps, etc.
3. MEP Traces and Path Reconstruction
In the MEP project we adopted a user-centered design approach involving target users from the early phases of the project being them the main actors of the data collection besides being the beneficiaries of the collected data.
3.1. Requirements of the Application
Users’ requirements were collected with focus groups involving both manual and electric wheelchair users, as well as elderly people with mobility issues. The main requirements that emerged from the focus groups include easiness in using the app, interactive interfaces, easy to click and to understand icons and interactive buttons. With respect to this last point, some of the wheelchair users of the focus group had finger movement limitations, for example when performing zoom in and out or in typing with digital keyboards: simple single click commands are therefore required.
Regarding the information to be collected along the pathways, and therefore to display on the map, they highlighted that they would prefer an app telling them the accessible paths to follow, and that they would not like to hear about obstacles. Among possible accessible elements, they are interested in accessible toilets, transportation stops, and parking lots, as well as any building or point of interest of the city. In this project, we have mainly focused on the paths and on the algorithms for their reconstruction; however, our tools include the possibility to notify and consider obstacles and accessible elements.
In case of obstacles, it should be possible to signal them together with pictures that may give a better idea of the obstacle for the specific disability; simple and not-long-to-fill obstacles’ evaluation forms should be offered by the application. Finally, personalized maps according to typical disabilities (e.g., manual vs. electric wheelchair) should be provided; the collected data should therefore take into account also the users’ characteristics, so that, for example, a path travelled by a user requiring step-free accessibility can be considered accessible also for users able to climb low curbs.
The whole mapping process should take into account the different kinds of users: not only the interface should be suitable for users with motor impairments, but also
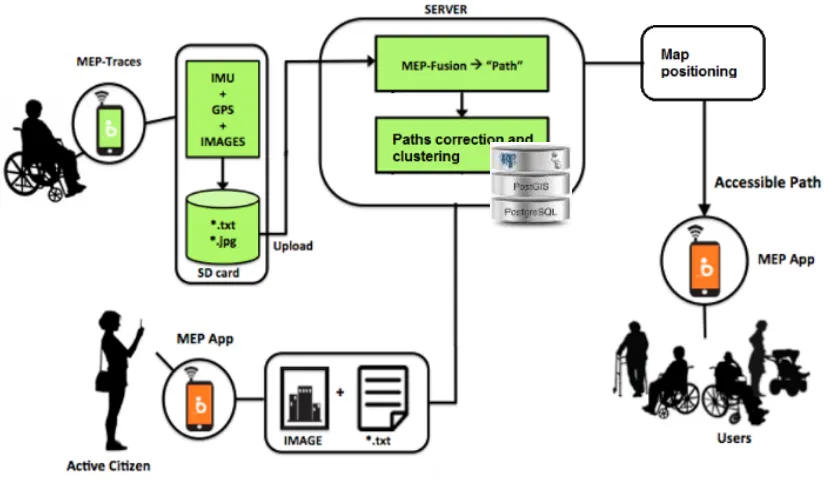
Figure 1. Overview of the process for data collection and processing
essing algorithms should take into account mobility problems: in particular, when using sensor fusion techniques, they should be suitable for data collected on wheelchairs and cannot exploit step detection or similar techniques to improve the reconstruction of the path.
3.2. Data Collection and Processing
Overview
Figure 1 describes the process for the collection of paths data and for their reconstruction; when a user starts a route, s/he activates a mobile app called MEP-Traces to collect along the whole path data needed to its reconstruction. Such data include GNSS positions estimates, motion sensors data (e.g., accelerometer, gyroscope, etc.) and, possibly, images; all the data are stored on the device SD-card and then uploaded on the server in a PostGIS spatial database [16] for further processing. On the server, since the accuracy in positioning of GNSS data is quite low for mobile device GNSS receivers, we fuse GNSS positions with motion data to provide a better estimate of the path, especially in those parts of the route where GNSS satellites are not visible. The output is a path, which is further corrected exploiting the cartography and possibly merged with other paths on the same route, and is positioned in a geographical map. All the collected data are displayed in a different application, called MEP-App, for the target users. Besides collecting sensors’ data along the path in an implicit way, without the intervention of the user, both MEP-Traces and MEP-App allow also the notification of explicit data. In particular, it is
possible to notify (geolocalized) obstacles met along the path. Moreover, it is possible to enrich maps also with accessible elements (e.g., parking lots for disabled people, accessible transport, accessible entrances and presence of elevators, etc.). The users must explicitly signal such data.
3.3. MEP-Traces Application
MEP-Traces is the application for the collection of data from common hardware sensors like GPS, accelerometer, magnetometer, gyroscope, and barometer, embedded in the current generation of smartphones and tablets. Data are collected simultaneously, at the highest possible frequency, and locally stored in the mobile device SD-card.
4 specified (Figure 2.d). Optionally, some pictures and a description can be included. In a similar way, also accessible elements are notified.
a) b)
c) d)
(c) (d)
Figure 2. Some snapshots of the MEP Traces app
(a) main menu, (b) sensor recording, (c) obstacle type selection, (d) obstacle description and
notification.
The application has been developed to dynamically recognize all the motion sensors in the device (e.g., step detector, orientation, proximity, rotation vector, etc.), but only accelerometer, gyroscope and magnetic field sensors are acquired by default. To retrieve the device position, the GPS sensor is used. The application automatically starts the sensor monitoring as soon as the GPS geo-location is obtained. For each acquisition phase, a specific folder is created, to store the files containing all the information of the sensors changes during the movement. Collected data need to be explicitly sent by the user to the server for
further processing and sharing. Before sending them, we minimize the upload effort by compressing each acquisition folder. The upload operation is forced to happen with a connection between the device and our server over WiFi using the SFTP (SSH File Transfer Protocol), as in Figure 3. During this task, the acquisitions uploaded correctly to the server (after a client/server check) are automatically deleted from the mobile device while the upload proceeds.
a) b)
Figure 3. MEP-Traces upload interface example: (a)
automatic selection of all the acquisitions, (b) data compression and connection/uploading task
3.4. System Architecture
The back-end of the application exploits Policloud [15], the cloud infrastructure of Politecnico di Milano.
The back-end server begins a multithreading elaboration as soon as each single acquisition (paths, obstacles) is completely uploaded and available. An articulated workflow precisely defines the intervention’s sequence to build accessible paths over the map.
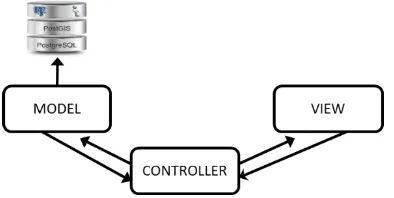
Figure 4 shows the MVC (Model-View-Controller) block schema.
Figure 4. The MVC design pattern general block
schema.
The Model represents the core element: it contains the whole knowledge, i.e., the logic, data, state and rules of the application. The View builds a visual representation of the Model, while the Controller operates as a link between them.
The main service on the server starts by creating a Controller, responsible of the workflow management and aiming at building an accessible path. In particular, it is composed of the following three main elements:
1. An Observer element, having the goal of discovering new elements and adding them to the data set.
2. A Cluster element, performing the clustering of many acquired data sets, and aiming at representing sets of paths on the same route as a single accessible path.
3. One or many Worker element/s, managing the sequential/parallel multithreading process of the main workflow, to finalize the insertion of the reconstructed accessible path into the PostGIS database.
The first two processes run over two or more separate threads (depending on the CPU architecture); the third process is activated when there is at least one task, i.e., new data have been uploaded.
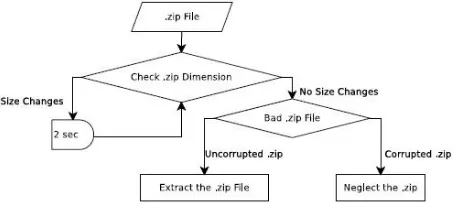
Initially, the Observer monitors the main folder where data are uploaded, providing an immediate response if a new acquisition has to be processed. The compressed acquisition files are passed to a Worker that begins the elaboration process. First, a decompression procedure is applied to the data, as described in Figure 5. For each acquisition file, the system checks every two seconds if the uploaded file size changes; if it changes, it waits until the upload is completed. Then, a corruption check is performed. The decompression procedure extracts all the files that contain relevant information of sensor data for the path acquired with MEP-Traces.
Figure 5. Decompression procedure.
After the decompression phase, the main workflow (graphically depicted in Figure 6) starts. Given a path composed of a sequence of GPS points, the first task computes the geometry of each GPS point and inserts it in a specific table into PostGIS, together with other parameters such as: the device id, the email account and the name of the user, the timestamp of the acquisition, the UTC
(Universal Time Coordinated), city, latitude and longitude. Then, GPS points are fused with motion data such as accelerometer, magnetometer, etc. provided by the device sensors to improve path reconstruction quality; motion data are correlated with GPS data by means of timestamps (this process is detailed in Section 3.5). The output geometry of the MEP-Fusion algorithm is a sequence of corrected points. The last step of the Worker implements a cartographic correction of the fused GPS data (explained in detail in Section 3.6).
Figure 6. Worker general process task.
The three steps represent the pre-processing stage for the MEP-Clustering algorithm task (described in Section 3.7). Each GPS point of the cartographic correction is stored in the database in order to keep track of the cities already clustered. The clustering process of a specific city is repeated every time new points affecting the cluster are uploaded.
All the algorithms run on our server as a 24/7 service in a remote Unix Machine with 4GB of RAM, and a dual core CPU (4 parallel threads). The main Worker can elaborate in parallel 4 paths.
3.5. Path Reconstruction
Data collected with the MEP-Traces application are used by the MEP-Fusion engine to reconstruct the path followed by MEP-Traces users. The approach used in the reconstruction is based on the fusion of information coming from multiple sensors to overcome issues related to the poor quality of the mobile sensors [13]: indeed, the GPS and the internal Inertial Measurement Unit of the mobile device could single-handedly provide an absolute position and orientation for the device, but measurement noise produces inaccurate results.
6 position and orientation of a mobile robot. Details of the approach can be found in [1]. Since the ROAMFREE library is able to reconstruct the trajectory using the absolute reference frame of the GNSS and the orientation provided by the Earth magnetic field recorded by the magnetometer, the device during the route can be held freely by the user. However, a swinging device, produces less accurate results. Experimental results show that accuracy depends on GPS accuracy, since the other sensors provide relative positions; instead, the approach improves the path reconstruction in case of missing or sparse GPS measurements [1].
3.6. Path Correction
Even though the MEP-Fusion engine operates to clean GPS trajectories by fusing mobile sensors data, the reconstructed paths can still present some intrinsic errors when the reconstructed path is mapped on a cartographic map: in many cases, paths cross buildings. Fusing each single point corrected by MEP-Fusion algorithm with static information contained into the OSM (OpenStreetMap) database can lead to interesting improvements for this kind of problem.
The Global Navigation Satellite System (GNSS) trajectory-building superposition correction developed at the Environmental and Civil Engineering Department at Politecnico di Milano [3][13], employs a real time triggering technique over our GPS points table. A dedicated trigger is activated whenever new points are inserted into the database, performing a simple check of the points coordinates’ superposition with respect to the coordinates of the buildings around it. If the trigger detects the occurrence of a superposition, the point rigidly projects outside the building’s area considering the closest “road pipe” as reference.
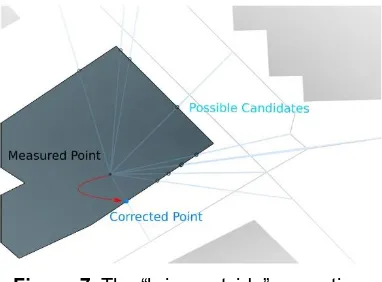
Figure 7. The “bring-outside” correction.
Figure 7 shows the initial situation where the trigger detects a new measured point overlying the building. A number of possible candidates on the border of the building are identified. The corrected point is associated to the one that reflects the closed road pipe to which it belongs in the original path. Applied to the whole path, this method produces the results shown in Figure 8.
a)
b)
Figure 8. Cartographic correction of GNSS
trajectories
All the points occurring over a building are rigidly shifted to its border. The original measured points can even occur over large portions of buildings, due to large errors in the surveys and there may be critical situations that can lead to a completely unwanted result: for example, in Figure 8 (b) the obtained path is discontinuous. To solve such problems, in case of discontinuity, it is possible to shift all the points to the closest sidewalk instead of to the border of the building.
3.7. Paths Clustering
As explained in Section 3.4, the Worker element performs all the pipeline tasks from the decompression phase of the acquisition, passing through the MEP-Fusion algorithm and the geographic correction of the GNSS trajectories. Each process tries to perform a path reconstruction as reliable as possible with respect to the original user walk. When many acquisitions are stored on the database, the paths visualization of the same road is represented as overlapped trajectories, as shown in Figure 9: the sequences of green points represent different paths performed by different people. The main idea of the paths clustering is to generate a set of nodes, belonging to a connected graph, obtained from the learning of the trajectories points (in Figure 9 they are represented by blue points). As a result, a single trajectory can be extracted clustering different paths sampled from a single accessible route.
EAI Endorsed Transactions on
Internet of Things 12 2016 - 08 2017|Volume3|Issue9|e3 EAI Endorsed Transactions on
Figure 9.Neurons computation from trajectories.
The MEP-Clustering engine implements the Adaptive Incremental Growing Neural Gas Network algorithm [2] with slightly modifications in order to adapt it to the geospatial dataset. Indeed, despites Neural Gas Network approach represents a very effective method to perform topology learning, it lacks an automatic procedure to detect an a priori suitable number of neurons and adaptation steps, requiring a human intervention.
The Growing Neural Gas Network approach adds new units over time starting from a small network; then a local statistical measure (obtained throughout the adaptation step) can be evaluated. Using the computed statistical measure, the network topology can be generated incrementally adopting the competitive Hebbian learning method [2]. The final dimension of the network depends on the local statistical behaviour of the input.
Topology learning process starts by placing randomly two units into the space that has to be learned. Successively, an input signal, i.e., a sample from a path, is generated according to its probability distribution. According to that signal, the two closest units can be identified. Each unit contains a local counter, responsible for the tracking of the distance between the inputs and the unit itself. At each step, the local counter of the closest unit is updated by incrementing the aging of all emanated edges. Each edge in the Growing Neural Gas has an associated age used to remove the old ones in order to keep the topology dynamically updated. With this method, while the decision of introducing a new neuron is taken upon a fixed parameter, such decision is computed upon an adaptive free distance threshold. An excessive growth of neuron numbers is avoided by considering the use of a probabilistic criterion; in such a way, a new topology arises to preserve memory constraints.
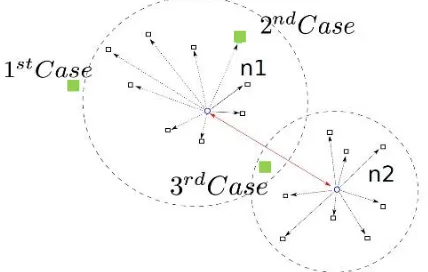
Be better understand the whole process, let us consider a simple case where a new input point has to be processed to generate (or update) a previous neuron. Three different cases (see Figure 10) perfectly relates to the three possible situations of new neurons creation:
1. The input point is far enough from n1: a new
neuron joins the graph; the sample’s position and a sample node join locally to the new neuron
sample’s list. Considering the new sample the threshold of the new node is updated.
2. The input point is close enough to n1 but far
enough from n2: a new neuron joins the graph at
the sample’s position and a new link connects node n1 with the newly created node. The sample point gets into the new neuron sample’s list and the threshold of the node n1 is updated.
3. The input point is close to both n1 and n2: then,
move n1 and its neighboring neurons toward the input point;
increase the age of n1’s emanating edges; link n1 and n2 with a new edge whose age
is equal to 0;
remove old edges from the graph if they exist;
update the threshold of both n1 and n2 accordingly.
When the number of neurons increases above a maximum nodes threshold, a merging process tries to reduce the dimension of the graph by fusing some elements together. The merging process starts by creating a new empty graph. Two randomly picked nodes get out from the node list of the old graph and join to the new graph. These two nodes correspond to the initialization vector supplied as input of the Adaptive Incremental Growing Neural Gas Network algorithm to accomplish the final goal.
Figure 10. Green square points correspond to the
three possible cases representing the creation of a new neuron or the assignment to an existing one of the input point. The black square points are the samples assigned to a neuron node (the blue one).
4. Experimental results
8
Figure 11. GPS data collected in Cernobbio (Como,
Italy) with MEP Traces.
To evaluate the quality of the data acquired from mobile devices, the collected GPS data have been compared with the data of a high-cost geodetic device – in our case a Leica GPS 1200 receiver. Figure 12 shows the acquisitions for the same path of the geodetic device (in black) and the low cost GNSS receiver of a Google Nexus 6P GPS sensor (in purple); it can be noticed how it is affected by a lot of noise. To provide a better estimation of the correct path, we have fused our GPS data with the motion sensors data.
Figure 12. Details of two different acquisitions with
a geodetic device – Leica GPS 1200 receiver (black route) and a low cost GNSS receiver - Nexus 6P
(purple route).
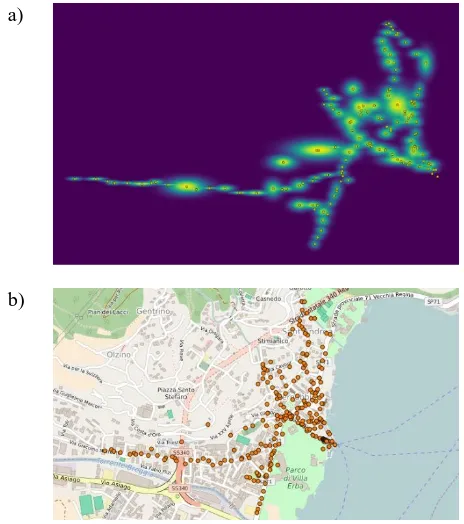
Figure 13 shows the application of the cartographic correction of GNSS trajectories on the data collected in Cernobbio. In blue and yellow lines represent, respectively, roads and building borders downloaded from the OSM database. It is possible to notice how data points over buildings have been successfully shifted at their borders. Figure 14 (a) visualizes the result of the MEP-Clustering algorithm described in Section 3.6. The yellow points indicate the neurons generated by the algorithm. The union of the neurons forms a single trajectory. The more a centroid is colored in yellow, the more the neuron owns points grouped in its cluster. Figure 14 (b) shows the neurons over the map of Cernobbio.
The 3D representation of the neurons in Figure 15 shows a Gaussian representation of the clustering result where the mean and variance of the data points at each single neuron is computed and plotted.
a)
b)
Figure 13. Cartographic correction of GNSS
trajectories. From left to right (a) raw dataset of Cernobbio, (b) cartographic GNSS correction.
a)
b)
Figure 14. a) MEP-Clustering algorithm result and b)
cluster visualization in Cernobbio
Figure 15. Gaussian 3D visualization of neurons using MEP-Clustering algorithm.
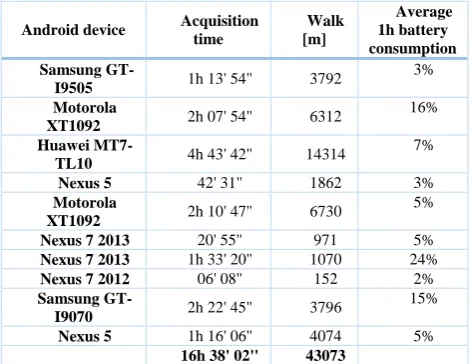
The average battery consumption of MEP-Traces has also been computed for each device. The application is designed to run in background trying to use the minimal Android system resources, allowing the user to do any other task (e.g., calls, receiving SMS and emails, using the internet, etc.). Table 1 shows the total acquisition time and the total length of the walked path (expressed in meters).
Table 1. Average battery consumption for each
device in using MEP-Traces during the experiments in Cernobbio (Como, Italy) with total acquisition time
and the total length (in meters).
Android device Acquisition time
Walk [m]
Average 1h battery consumption Samsung
GT-I9505 1h 13' 54'' 3792
3%
Motorola
XT1092 2h 07' 54'' 6312
16%
Huawei
MT7-TL10 4h 43' 42'' 14314
7%
Nexus 5 42' 31'' 1862 3% Motorola
XT1092 2h 10' 47'' 6730
5%
Nexus 7 2013 20' 55'' 971 5% Nexus 7 2013 1h 33' 20'' 1070 24%
Nexus 7 2012 06' 08'' 152 2% Samsung
GT-I9070 2h 22' 45'' 3796
15%
Nexus 5 1h 16' 06'' 4074 5% 16h 38' 02'' 43073
A total acquisition time of 16h 38' 02'' was done, reaching about 43 Km as the total length of the walked path. The battery consumption of MEP-Traces has also been computed considering one hour of acquisition: the battery consumption of the application is about 5-6% in one hour varying among the different devices. For some devices (omitted from our computation) we have used power banks; in such cases the battery consumption was 0%.
All the acquisitions were taken with the application running in background. In order to consider a common user in a daily device usage, mobile data connection was enabled. Most of the used devices were personal devices, therefore the consumption could have been affected also by other applications running on them. Several factors may affect the results of the battery consumption and for personal devices it is difficult to have homogeneous conditions. Indeed, results may depend also from the Android OS version installed on the device, the Linux Kernel version and its optimization, the hardware device composition like CPU and RAM, the read/write SD-card speed, etc. However, since the applications are thought to be used by any user with any Android device, these data can be considered as approximations of possible behaviours.
5. Conclusions and Future Work
In this paper we have described the results of data acquisitions done in Cernobbio (Como, Italy) for the MEP (Maps for Easy Path) project. The tools developed for the project have been illustrated and in particular the app MEP-Traces has been described in more detail: it retrieves raw GNSS data from low cost GPS sensor installed on commercial mobile devices, together with other sensor data like accelerometer, magnetometer etc. Then the entire path is reconstructed. Each reconstructed path is associated with the user’s profile (e.g., wheelchair type, requirements like “no-step”, etc.), to build accessible paths for different users’ types. Consistency and reliability of the collected data can be increased if more users trace the same routes. At this aim, we are improving the path reconstruction using clustering techniques on a set of paths. The visualization of the collected data with the cartographic correction of the GNSS and the MEP-Clustering algorithm applied on our collected dataset have also been discussed.
Experiments have shown that the MEP-Traces application performance running in background on different devices is good, with a battery consumption of about 5-6% for an hour of acquisition.
Future works of the project include the MEP-Fusion optimization on our main real time computing service and a heatmap visualization of the paths clustering fusing also reported obstacles. This last step aims to compute in real time the visualization of the accessibility level, by colouring from red to green the clustered neurons belonging to a path when a user notifies an obstacle during his/her traveling in the city.
10
References
[1] Bardaro G., Vali A., Comai S., Matteucci M.. “Accessible Urban Routes Reconstruction by Fusing Mobile Sensors Data”, G. (2015) - 13th International Conference on Advances in Mobile Computing & Multimedia (MoMM2015), Bruxelles, Belgium [2] Fritzke, B. (1995) “A Growing Neural Gas Network
Learn Topologies”. Proceedings of the 7th International Conference on Neural Information Processing System, p. 625-632
[3] Biagi L, Negretti M. (2016) “Correzione cartografica di traiettorie GNSS da periferiche a basso costo” FOSS4G-it 2016 Workshop (Italian - Free and Open Source For Geospatial Europe Conference), in Geomatics Workbook n. 13 – Parma, Italy
[4] Cardonha, C., Gallo, D., Avegliano, P., Herrmann, R., Koch, F., Borger, S. (2013) “A crowdsourcing platform for the construction of accessibility maps”. In
Proceedings of the 10th International Cross-Disciplinary Conference on Web Accessibility, W4A ’13, pages 26:1–26:4. ACM.
[5] Comai, S., Kayange, D., Mangiarotti, R., Matteucci, M., Ugur Yavuz, S., Valentini, F. (2015) “Mapping City Accessibility: Review and Analysis”. In
Proceedings 13th International Conference on Advancing Assistive Technology and eAccessibility for People with Disabilities (AAATE’15), Budapest, Hungary.
[6] Comuni per tutti. (2016, July 25). Retrieved from
http://www.comunipertutti.it/maps/# - Italian Web site. [7] Cucci, D. A., Matteucci, M. (2014) “On the development of a generic multi-sensor fusion framework for robust odometry estimation”. Journal of Software Engineering for Robotics, 5(1):48–62 [8] Karimi, H.A, Zhang, L., Benner,J.G. (2013)
“Personalized Accessibility Maps (PAMs) for Communities with Special Needs” Web and Wireless Geographical Information Systems, LNCS Vol, 7820 pp 199-213
[9] Mapability. (2016, July 25). Retrieved from
http://www.mapability.org - Italian web site
[10] H. Matthews, et al. (2003)Modelling Access with GIS in Urban Systems (MAGUS): capturing the experiences of wheelchair users, Area, vol. 35, pp. 34-45.
[11] MEP Project. (2016, July 25). Retrieved from http://mep5x1000.wix.com/mepapp
[12] Meyers, A. R. et al. (2002) Barriers, facilitators, and access for wheelchair users: substantive and methodologic lessons from a pilot study of environmental effects, Social Science & Medicine, vol. 55, pp. 1435-1446.
[13] Negretti, M. (2017) “Low cost GNSS receiver: navigation and monitoring activities.” PhD Thesis, Politecnico di Milano
[14] Palazzi, C. E., et al. (2010) “Path 2.0: A participatory system for the generation of accessible routes”, ICME, pp. 1707-1711.
[15] Policloud Project (2017, February 21) Retrieved from http://policloud.polimi.it/
[16] PostGIS (2017, February 21) Retrieved from http://www.postgis.net/
[17] Rota Accesivel. (2017, February 21). Retrieved from
https://itunes.apple.com/it/app/ibm-rota-acessivel/id644712974?mt=8
[18] Shigeno, K. et al. (2013) “Citizen sensing for collaborative construction of accessibility maps”.
Proceedings of the 10th International Cross-Disciplinary Conference on Web Accessibility, p. 24 [19] USCensus. (2014). Mobility is Most Common
Disability Among Older Americans, Census Bureau Reports. 2014. United Census Bureau -
http://www.census.gov/newsroom/press-releases/2014/cb14-218.html
[20] Wheelmap (2017, February 21) Retrieved from https://wheelmap.org