GSJ: Volume 7, Issue 4
,
April
2019, Online: ISSN 2320-9186
www.globalscientificjournal.com
ENERGY
EFFICIENCY
Okorieimoh Chibuisi. C is currently pursuing Doctor of Philosophy (PhD) degree programme in Electrical and Electronic Engineering in Technological University Dublin, Ireland, +353879350129, +353899806724. [email protected], [email protected],
Abstract
Energy is a measure of system‟s ability to do work. The need for energy in all sectors of life which include industry, transportation, hospital, home, etc, cannot be over-emphasized. This is because of its universal importance to mankind. The use of energy pervades every aspect of modern society but it is not efficiently used in many sectors of life. In view of this, there is an incessant increase in fuel costs; energy efficiency studies are thus rapidly becoming more important. Considering the population of Nigeria and quantity of power supply, there should be need for energy efficiency. This paper assesses alternative fuels, energy conservation, building design, appliances, industry and vehicles.
Keywords: Energy, Energy efficiency, Energy conservation, Nigeria.
Introduction
The problem of energy scarcity hits global scale. This is due to the fact that most of the energy production depends on non-renewable sources. As in supply and demand law, the lower the amount of energy provided, the more expensive it becomes, causing a major problem for industry in general, which is dependent on it. It is therefore important that these industries become more energy efficient in the interests of competitiveness and the global environment (Brown 2013; Greenough 2013; Vikhorev 2013). Costs on electricity to an industry like the automotive represent a large part of the company expenses. For this reason, looking for ways to reduce spending is vital to its economic sustainability. Considering this, there are areas of study such as energy efficiency; seeking ways to optimize the use of energy within the environment is being used. Several authors study this area and look for different ways to propose application models:
Çengel (2011) states that “Energy efficiency is to reduce energy use to the minimum level, but to do so without reducing the standard of living, the production quality, and the profitability.”
According to Patterson (1996), energy efficiency is a generic term and there is no quantitative measure of "energy efficiency" that is not equivocal. On the contrary, one should rely on a number of indicators to measure changes in energy efficiency. Studies claim that there are a number of barriers that inhibit the adoption of cost-effective energy efficiency measures (Sardianou 2008). Although there is a need for industrial energy efficiency, studies indicate that the measurements for efficient energy
conservation in relation to costs are not always implemented, which indicates the existence of an energy efficiency gap. This gap is explained by the existence of barriers to energy efficiency (Brown 1990; Hirst 1990). An industrial energy program aims to reduce barriers that prevent energy efficiency. For this reason, it is extremely important to detect obstacles that restrict markets for energy efficient technologies in order to effectively reduce these barriers (Dotzauer 2010; Thollander 2010).
May et al. (2015) and Zhang and Chiong (2015) use a genetic algorithm (GA) to improve energy efficiency on the performances of a job-shop. The first considers the objectives for productivity and energy consumption to investigate the effects of production scheduling policies and the second
incorporates it with two problem-specific local improvement strategies to minimize energy consumption into the job-shop scheduling. Salido et al. (2015) use the GA to solve a job-shop scheduling problem, in which machines can consume different amounts of energy to process tasks at different rates. Frigerio and Matta (2015a) propose a machinery management method through an algorithm in order to find ways to turn off the machines when they are not being used and connect them again when they are needed, thus generating energy savings. The authors continue the previous study by analyzing the machinery management in accordance with product production lines (Frigerio 2015b; Matta 2015b).
A lot of models and frameworks were proposed to improve energy efficiency and management. Ngai et al. (2012) use the soft systems methodology (SSM) to identify management support system opportunities for managing energy and utility usage. Ngai et al. (2013) propose an energy and utility maturity framework that measures systematically the consumption of natural resources and guides organizational advancement in energy and utility management. Sundberg and Wene (1994) propose a nonlinear programming model, called MIMES (Model for description and optimization of Integrated Material flows and Energy systems), in order to provide a tool to assist decisions on systems with nested materials and energy flows. Arigliano et al. (2014) propose a framework to help modeling and optimizing systems of energy production, storage and consumption. Lee and Prahbu (2015) propose an energy-aware feedback control model for production scheduling and capacity control.
Uluer et al. (2015) propose a framework for reducing energy use in manufacturing through three pillars: creating an energy profile of a process chain, energy-aware part designs and process plans based on ISO/STEP 10303 AP224 standards. Vikhorev et al. (2013) present a framework for energy monitoring and management of each individual productive asset and related energy using processes in the factory. Raileanu et al. (2015) present an agent-based approach for measuring in real time energy consumption of resources in job-shop manufacturing processes in order to seek for easier and fastest ways to optimize energy consumption. O‟Driscoll et al. (2013) endorse that the manufacturing sector should focus on energy transparency being achieved by connecting an effective energy metering system to monitor and control the energy requirements of a manufacturing plant. With more energy visibility, it turns out to become easier to identify opportunities to improve energy efficiency. Li et al. (2014) come up with a framework that analyses energy consumption characteristics in machining manufacturing systems from a holistic point of view, seeking a more energy efficient machines.
Energy Efficiency Potential
The International Energy Agency (IEA) estimated the potential for efficiency improvements to be in the range of approximately 20–50 % of the total final energy consumption. According to the IEA, energy efficiency policies in 11 Organisation for Economic Co-operation and Development (OECD) countries (US, Japan, Australia, UK, France, Italy, Germany, Denmark, Norway, Sweden,
And Finland) between 1973 and 1998 had saved approximately 49 % of the actual energy use (IEA 2007). Jollands et al. (2010) showed that energy efficiency policies would help save an average of 20 % of the final energy consumption from 2010 to 2030 in five major sectors, namely buildings, equipment, lighting, transport, and industry, in OCED countries. If other sectors are considered, the saving potential would be more than 20 %.
A review of the IEA literature on the potential for energy efficiency improvements in the past and the future demonstrates that energy efficiency potentials in selected IEA/OECD countries from 1975 to 2030 would be within a range of 20–50 %.
The potential for energy efficiency savings in developing countries could be higher than IEA/OECD countries because of the widespread use of inefficient energy technologies.
Energy efficiency does not mean that we should not use energy, but we should use energy in a manner that will minimize the amount of energy needed to provide services (Agharese 2009; Etiosa 2009; Matthew 2009; Ogbemudia 2009; Osazee 2009; Ose, 2009). This is possible if we improve in practices and products that we use. If we use energy efficient appliances, it will help to reduce the energy necessary to provide services like lighting, cooling, heating, manufacturing, cooking, transport,
is 60 watts per hour). A compact fluorescent light bulb would provide the same or better light at 15 W and only use 15 W/h. This means that 45 W (75% of energy) is saved for each hour the light is turned on.
Adoption of end-use efficiency will make energy efficiency to be more proactive. End-use efficiency refers to technologies, appliances or practices that improve the efficient use of energy at the level of the final user. For instance, the appliances we use in our homes and offices. Though this term is not limited to electrical appliances, it can also be used for other areas of efficiency such as measures to improve the ability of houses to absorb and retain heat in winter and keep out heat in the summer.
On the other hand, utility companies, providing electricity, can also devise ways and technologies to promote the efficient use of energy. This is known as demand-side efficiency or management.
Demand-side management can be policies implemented by utilities and energy planners that encourage consumers to use energy more efficiently (Agharese 2009; Etiosa 2009; Matthew 2009; Ogbemudia 2009; Osazee 2009; Ose, 2009). An example of this is shifting of load, which include encouraging consumers to move their energy use away from peak period.
There are two important ways we can approach the efficient use of energy. The first one is the
technological approach while the second is the behavioral approach. For the technological approach, we need to change the type of technology we use to a more efficient one. A good example is the one we cited above on the light bulbs; replacing incandescent bulbs with energy efficiency bulbs (also known as energy saving bulbs). The behavioral approach entails changing the ways we do things. An example is switching off appliances when not in use.
Energy efficiency has become the key driver of sustainable development in many economies in the world. If we use energy efficiently, it will lead to the saving of personal income; families will not have to spend so much money paying for energy. It will help to reduce the building of more power stations, thus the money for building power stations will then be spent on other sectors of the economy. People will have access to energy; if we save energy in one part of the country, the energy saved can be made available in another region. In Nigeria, where the utility companies do not have enough energy to meet the needs of everybody at the same time, energy supply is alternated. With good energy management at the residential, public and private sectors, there will be no need to alternate electricity supply. Most of the energy we generate in Nigeria comes from the burning of fossil fuel (oil and gas) which is a non-renewable energy.
For every kilowatt of electricity we consume, there is an equivalent emission of green house gases (GHGs) especially on the use of fossil fuel generating sets. Energy efficiency can help to reduce the emission of GHGs and reduce the reliance on petroleum to drive our economy. The negative
environmental impacts associated with the generation of energy will also be reduced if we use energy efficiently.
From 2008 ECN (Energy Commission of Nigeria) report, there are nine electricity generating stations in Nigeria. Three of these stations are hydro based while six are thermal based and they are all owned by the government under the former Enugu Electricity Distribution Company of Nigeria (EEDC). All of them have an installed capacity of 6000MW (www.credcentre.org). However, for many reasons ranging from shortage of gas supply to lack of maintenance, these stations are performing far below the installed capacity. In the past, Nigeria is generating 2000MW of electricity (Punch September 11 2009). Part of the electricity generated is exported to neighboring Niger Republic.
Currently, there are two main types of power plants operating in Nigeria: hydro-electric and thermal or fossil fuel power plants. With a total installed capacity of 8457.6MW in early 2014, thermal power plants (gas-fired plants) dominate the Nigerian power supply mix (Ali 2017). Electricity production from hydroelectric sources in Nigeria was reported at 17.59% in 2014, according to the World Bank collection of development indicators, compiled from officially recognized sources.
Recently, The Transmission Company of Nigeria (TCN) said the nation‟s power generation capacity dropped from 3,959MW on January 4 to 2,662MW on January 22 (Premium times January 22 2017).
Reason for the study
Energy policies in many developing countries including Nigeria have not really put into consideration, the importance and gains of energy efficiency to the environment and economic development. This could be that the concept is poorly developed in these countries. In many developing countries, there is inadequate data or record that will guide the development of policy which will strengthen regulatory measures to use energy efficiently. The research was conducted to deduce information that will guide the development of policy and legislation which will strengthen regulatory measures to use energy
efficiently in Nigeria. In this study, our focus is in the management of electrical energy.
Objectives of Study
To deduce information that will serve as a guide to draft policy that will strengthen regulatory measures to use energy more efficiently in Nigeria;
To identify commercially and behaviorally low-cost ways of reducing energy consumption in the residential, public and private sectors in Nigeria;
To identify renewable energy potentials in the different regions of Nigeria.
Materials and Methods
During the study, we made use of questionnaires, focused group discussions, interview with key informants, physical survey and review of existing documents from relevant agencies and academic institutions. All our respondents were drawn from the urban areas, the reason being that these places have more access to electricity. The study was conducted in three major cities in Nigeria – Enugu, Owerri and Portharcourt. A total of 180 respondents were randomly selected in these cities and interviewed. Data were subjected to statistical analysis using the appropriate statistical packages.
Results and Discussions
From our study, we found out that a lot of energy is wasted in Nigeria because households, public and private offices and industries use more energy than is actually necessary to fulfill their needs. One of the reasons is that they use old and inefficient equipment and production processes. The other reasons are unwholesome practices that lead to energy wastage.
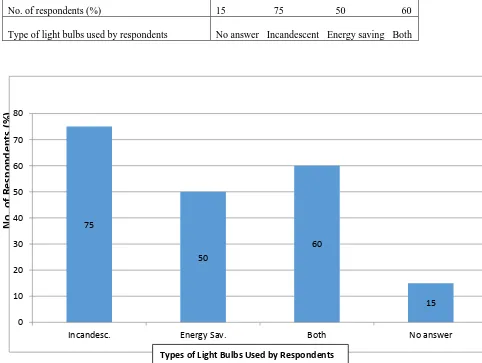
The common name for incandescent bulb in Nigeria is “yellow bulb” because of the yellowish colour of the light rays from the bulbs. Many Nigerians are not familiar with the name „incandescent‟. This could be the reason why 15% of respondents did not provide any answer in Table 1.0. From our study, 75% of our respondents claim they use incandescent bulbs (Fig. 2.1). The use of incandescent bulbs for lighting is energy intensive. Only about 5% of total energy used by an incandescent bulb is converted to light energy, the remaining 95% is converted to heat energy (Lebot 2009). This is against the potential for efficiency improvements estimated by the International Energy Agency (IEA) which was estimated to be in the range of approximately 20–50 % of the total final energy consumption (IEA 2007).The energy rating of the incandescent bulbs found in the Nigerian market range from 60W to 200W, thus we have the ones for 60W, 100W and 200W.
No
. of Resp
ondent
s (%)
Energy consumed in Nigeria can be drastically reduced if Nigerians replace their incandescent bulbs with energy efficiency bulbs (energy saving bulbs). The energy saving bulbs we found in the market was those of 15W, 20W and 25W. If a particular household using 20 incandescent bulbs of 60W decides to replace them with energy saving bulbs of 15W, instead of spending 1200W/h (20 x 60W) for lighting, they will be spending 300 watts per hour (20 x 15W). Thus this saves approximately 75% of energy for lighting alone. This is a huge saving. On a larger scale, if Nigeria as a country phase out one million incandescent bulbs and replace them with energy saving bulbs, the country will be saving about 300MW of electricity. This is enough to provide electricity to many communities in Nigeria. If each of the 36 states and the FCT replace one million incandescent bulbs each, we can save up to 11100MW of electricity. The works of May et al. (2015) and Zhang and Chiong (2015), Matta (2015a), Ngai et al. (2012) and Uluer et al. (2015) should be adopted in order to reduce the rate of energy consumption and improve the potentials for energy efficiency.
Table 1.0: Prevalent Use of Incandescent Light Bulbs
No. of respondents (%) 15 75 50 60
Type of light bulbs used by respondents No answer Incandescent Energy saving Both
Fig. 2.1: Bar chart showing the types of light bulbs use by respondents
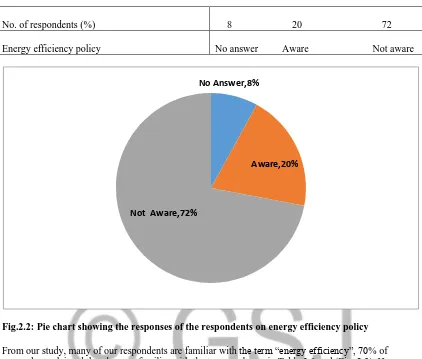
From our study, 72% of respondents are not aware of any policy on energy efficiency made by government while only 20% is aware and 8% has no answer as shown in Table 2.0 and (Fig. 2.2). This was due to lack of policy and legislation to address the inefficient use of energy. Policy and legislation will help to change behavior towards an energy efficient economy. Also in cases where policies and legislations are not forth coming, I suggest the works of Ngai et al. (2013), Sundberg and Wene (1994), Vikhorev et al. (2013), Raileanu et al. (2015), O‟Driscoll et al. (2013) and Agrigliano et al. (2014) should be used to help program the extent energy should be consumed or used by applying a modeling technique or using a prepaid digital metering technique.
75
50
60
15
0 10 20 30 40 50 60 70 80
Incandesc. Energy Sav. Both No answer
Table 2.0: Policy and Legislation
No. of respondents (%) 8 20 72
Energy efficiency policy No answer Aware Not aware
Fig.2.2: Pie chart showing the responses of the respondents on energy efficiency policy
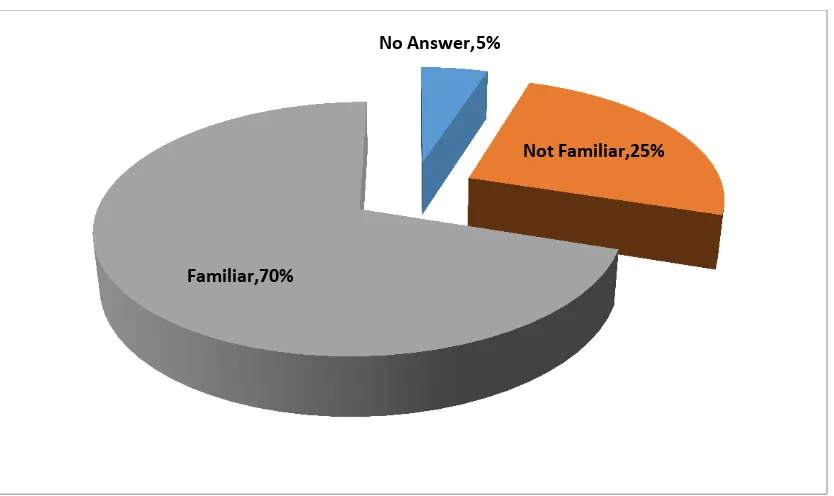
From our study, many of our respondents are familiar with the term “energy efficiency”, 70% of respondents claimed that they are familiar with the term as shown in Table 3.0 and (Fig. 2.3). However, many of these who claim they are familiar with the term could not really define it properly.
Table 3.0: Awareness creation on energy efficiency
No. of respondents (%) 5% 25% 70%
Awareness No answer Not familiar Familiar
No Answer,8%
Aware,20%
Fig. 2.3: Pie chart showing how familiar our respondents are with the term “energy efficiency”
A total of 75% of our respondents said that no member of their offices has been trained on energy efficiency management. This is because of lack of inadequate trained personnel and energy efficiency professionals as shown in Table 4.0. The Figure below (Fig. 2.4) shows the response to the question “if any member of your office had been trained on energy efficiency management?”
Table 4.0: Trained Personnel and Energy Efficiency Professionals
No. of respondents (%) 10 15 75
Trained Personnel and Energy Efficiency Professionals
No Answer Yes No
No Answer,5%
Not Familiar,25%
Familiar,70%
No Answer,10%
Yes,15%
No.
of
R
esp
on
d
en
ts
(%)
Fig.2.4: Pie chart showing the response to the question “Has any member of your office been trained on energy efficiency management?”
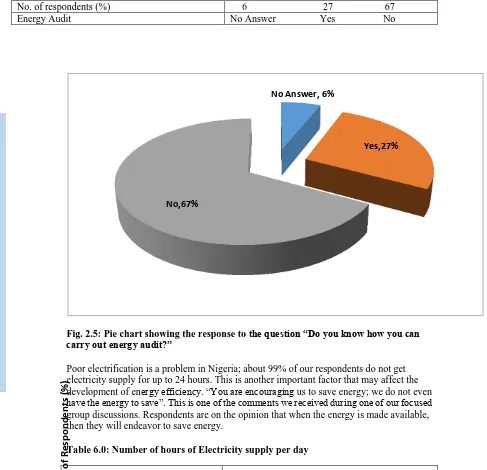
Our study revealed that 67% of our respondents claimed that they do not know how to carry out energy audit in their homes and offices (Fig.2.5). This may suggest that many people do not bother to check the energy an appliance consumes before purchasing one as shown in Table 5.0.
Table 5.0: Energy Audit
No. of respondents (%) 6 27 67 Energy Audit No Answer Yes No
Fig. 2.5: Pie chart showing the response to the question “Do you know how you can carry out energy audit?”
Poor electrification is a problem in Nigeria; about 99% of our respondents do not get electricity supply for up to 24 hours. This is another important factor that may affect the development of energy efficiency. “You are encouraging us to save energy; we do not even have the energy to save”. This is one of the comments we received during one of our focused group discussions. Respondents are on the opinion that when the energy is made available, then they will endeavor to save energy.
Table 6.0: Number of hours of Electricity supply per day
No. of respondents (%) 40 45 10 8 6 4 4.5 3.5 18
No. of hours per day 0-3 4-6 7-9 10-12 13-15 16-18 19-21 22-24 No ans
No Answer, 6%
Yes,27%
Fig.2.6: Bar charts showing the number of hours respondents get electricity supply per day
Some of the factors identified during our study are listed below:
Beauty of the appliances, the price of the appliance, the manufacturer‟s name, durability, and efficiency of the appliance.
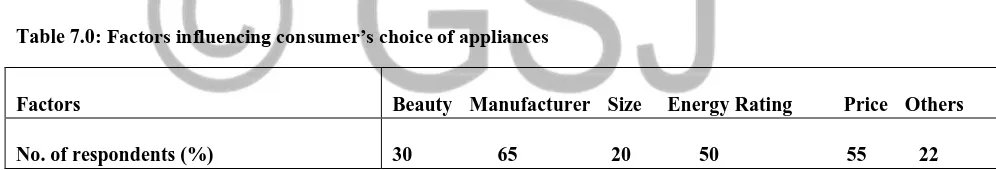
Beauty of the Appliance: A total of 30% (Table 7.0) of our respondents said that they look out for the beauty when purchasing any appliance. The most beautiful equipment may not be the most efficient in terms of energy consumption. Equipment that is beautiful and very attractive to the eye may also be very expensive compared to the one that is less attractive. A better understanding of this factors and how it relates to consumers behavior is important in the crusade to change consumer‟s behavior towards imbibing energy efficient culture.
Table 7.0: Factors influencing consumer’s choice of appliances
Factors Beauty Manufacturer Size Energy Rating Price Others No. of respondents (%) 30 65 20 50 55 22
Price of the Appliance: Price is a very strong economic factor influencing the demand for goods and services. 55% of our respondents agreed that they consider the price of an appliance before they purchase one. This will be a very good tool to influence the behavior of consumers to purchase more efficient appliance. Even if the prices of less efficient appliances are low compared to the more efficient ones. Government can come up with policy that will encourage people to go for the more efficient ones.
Size of the Appliances: Only few of our respondents consider the size of the appliances before making purchases; 20% of our respondents claimed that they consider the size. Our finding revealed that the size do not necessarily mean that it consumes more energy, the same way the smaller the appliance does not mean that it consumes less energy. Consumers should be enlightened to know this fact.
The Manufacturer’s Name: From our survey, 65% of our respondents purchase their appliance putting into consideration the manufacturer of the appliance. This is another very strong factor influencing consumer‟s choice of appliances. Many consumers believed that the products of certain manufacturers are more durable than others. Irrespective of the price of these appliances, the consumers go for these products thinking that it will last longer and are of better quality. This assumption may not always be correct. Many dubious traders have taken advantage of this notion to exploit consumers. Dealers on electrical materials capitalize on this factor to deceive their consumers to think that they are buying from the manufacturer they cherish.
40 45
10 8 6
4 4.5 3.5
18
0 5 10 15 20 25 30 35 40 45 50
0 to 3 4 to 6 7 to 9 10 to 12 13 to 15 16 to 18 19 to 21 22 to 24 No
Answer
The Amount of Energy an Appliance Consume/Energy Rating: Only 50% of our respondents stated that they take this factor into consideration. As stated earlier, 67% of our respondents do not know how to access this information from their electronics. Consumers should be enlightened on how to access this information. Manufacturers of electrical appliances should devise ways of making this information more vivid for consumers to access.
Durability: Some of the respondents claimed that they also look at the durability of any appliance before buying it. This is also linked to the product name or manufacturer. We do not know how they can precisely determine the durability of any product at the time of purchase.
Efficiency of the Appliance: Some others consider the efficiency of the appliance before they purchase one. Here in Nigeria, the government is yet to come with standards for determining the efficiency of the various appliances. Policy is needed to address this. Again, the Standard Organization of Nigeria (SON) should be properly equipped to define energy efficiency standards.
Price list of Some Selected Home and Office Appliances in Nigeria
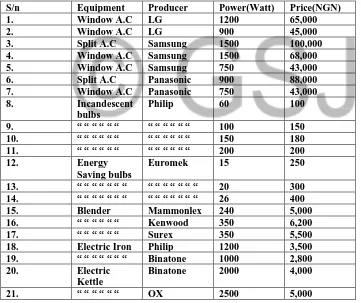
From our study, we establish the level of correlation between the price of some home and office appliances such as air conditioners and their power. The price lists below are subjects for change; this is what we came across during our study.
Table 8.0: Table showing some appliances with their price lists
S/n Equipment Producer Power(Watt) Price(NGN)
1. Window A.C LG 1200 65,000
2. Window A.C LG 900 45,000
3. Split A.C Samsung 1500 100,000
4. Window A.C Samsung 1500 68,000
5. Window A.C Samsung 750 43,000
6. Split A.C Panasonic 900 88,000
7. Window A.C Panasonic 750 43,000
8. Incandescent
bulbs
Philip 60 100
9. “ “ “ “ “ “ “ “ “ “ “ “ 100 150
10. “ “ “ “ “ “ “ “ “ “ “ “ 150 180
11. “ “ “ “ “ “ “ “ “ “ “ “ 200 200
12. Energy
Saving bulbs
Euromek 15 250
13. “ “ “ “ “ “ “ “ “ “ “ “ “ “ 20 300
14. “ “ “ “ “ “ “ “ “ “ “ “ “ “ 26 400
15. Blender Mammonlex 240 5,000
16. “ “ “ “ “ “ Kenwood 350 6,200
17. “ “ “ “ “ “ Surex 350 5,500
18. Electric Iron Philip 1200 3,500
19. “ “ “ “ “ “ “ Binatone 1000 2,800
20. Electric
Kettle
Binatone 2000 4,000
21. “ “ “ “ “ “ OX 2500 5,000
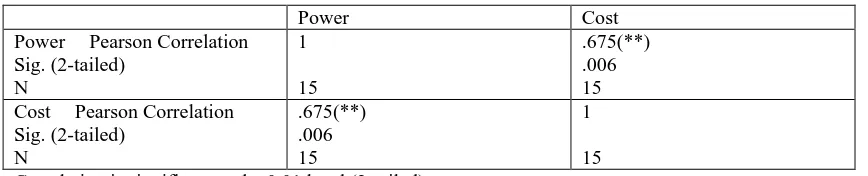
Table 9.0: Correlation analysis between power and cost (Air conditioners)
Power Cost
Power Pearson Correlation Sig. (2-tailed)
N
1
15
.675(**) .006 15 Cost Pearson Correlation
Sig. (2-tailed) N
.675(**) .006 15
1
15 Correlation is significant at the 0.01 level (2-tailed).
Conclusion
Energy is becoming an asset increasingly scarce and expensive, and because of this, it is necessary to consider ways to use energy more efficiently. Considering this, the study focused on finding ways of improving potentials of energy efficiency, models and methods to apply energy efficiency in homes and offices reduce the high consumption of energy using metering technique. The materials and methods used in this paper are questionnaires, focused group discussions, interview with key informants, physical survey and review of existing documents from relevant agencies and academic institutions.
From the result, it is showed that as the power increases, the price also increases which suggests that more efficient appliances do not necessarily mean increase in price.
Acknowledgement
The author wish to thank Enugu Electricity Distribution Company (EEDC) of Nigeria and
References
Agharese, E., Etiosa, U., Matthew, A., Ogbemudia, O.G., Osazee, P.U., and Ose, G.O., (2009). Community Research and Development Centre. pp. 6.
Ali, Y., (2017). The shortage of natural gas for power generation in Nigeria: counting the costs. Premium Times. Retrieved 20th July.
Arigliano, A., Caricato, P., Grieco, A., Guerriero, E., 2014. Producing, storing, using and selling renewable energy: The best mix for the small medium industry. Computers in Industry 65(3): 408-418. Brown, N., Greenough, R., Vikhorev, K.., 2013. An advanced energy management framework to promote energy awareness. Journal of Cleaner Production 43: 103-112.
Brown, M.A., Hirst, E., 1990. Closing the efficiency gap: barriers to the efficient use of energy.
Resources, Conservation and Recycling 3(4): 267-281.
Çengel, Y. A. 2011. Energy efficiency as an inexhaustible energy resource with perspectives from the U.S. and Turkey. International Journal of Energy Research 35(2): 153-161.
Dotzauer, E., Thollander, P., 2010. An energy efficiency program for Swedish industrial small- and medium-sized enterprises. Journal of Cleaner Production 18: 1339-1346.
Frigerio, N., Matta, A., 2015a. Analysis on Energy Efficient Switching of Machine Tool With Stochastic Arrivals and Buffer Information. IEEE Transactions on Automation Science and Engineering. Available online
Frigerio, N., Matta, A., 2015b. Energy-efficient control strategies for machine tools with stochastic arrivals. IEEE Transactions on Automation Science and Engineering 12(1): 50-61.
International Energy Agency (IEA). (2007). Mind the gap: Quantifying principal-agent problems in energy efficiency ISBN: 978-92-64-03884-4. Paris France.
International Energy Agency (IEA). (2012). Energy efficiency: Policies and measures database.
http://www.iea.org/textbase/pm/?mode=pm. Accessed 19 April 2012.
Jollands, N., Waide, P., Ellis, M., Onoda, T., Laustsen, J., Tanaka, K., et al. (2010). The 25 IEA energy efficiency policy recommendations to the G8 gleneagles plan of action. Energy policy, 38(11), 6409–6418.
Lebot, B. (2009). Energy Efficiency and Market Transformation: A Short Overview of Best Practices. A paper presented during the Inception Workshop of the UNDP-GEF Project to Promote Energy Efficiency in Residential and Public Building in Nigeria, 14th July 2009.
Lee, S., Prabhu, V.V., 2015. Energy-aware feedback control for production scheduling and capacity control. International Journal of Production Research: 1-13.
Li, Y., He, Y., Wang, Y., Yan, P., Liu, X., 2014. A framework for characterizing energy consumption of machining manufacturing systems. International Journal of Production Research 52(2): 314-325. May, G., Stahl, B., Taisch, M., Prabhu, V., 2015. Multi-objective genetic algorithm for energy-efficient job shop scheduling. International Journal of Production Research 50(23): 7071-7089.
Ngai, E. W. T., To, C.K.M., Ching, V.S.M., Chan, L.K.., Lee, M.C.M., Choi, Y.S., Chai, P.Y.F., 2012. Development of the conceptual model of energy and utility management in textile processing: A soft systems approach. International Journal of Production Economics 135(2): 607.
Ngai, E. W. T., Chau, D.C.K.., Poon, J.K.L., To, C.K.M., 2013. Energy and utility management maturity model for sustainable manufacturing process. International Journal of Production Economics
146(2): 453-464.
Premium Times Newspaper, January 22nd, 2017.
Patterson, M. G., 1996. What is energy efficiency? - Concepts, indicators and methodological issues.
Energy Policy 24(5): 377-390.
Raileanu, S., Anton, F., Iatan, A., Borangiu,T., Anton, S., Morariu, O., 2015. Resource scheduling based on energy consumption for sustainable manufacturing. Journal of Intelligent Manufacturing: Available Online
Sardinou, E. 2008. Barriers to industrial energy efficiency investments in Greece. Journal of Cleaner Production 16: 1416-1423.
Salido, M., Escamilla, J., Giret, A., Barber, F., 2015. A genetic algorithm for energy-efficiency in job-shop scheduling. The International Journal of Advanced Manufacturing Technology: : Available Online
Sundberg, J., Wene., C. O., 1994. Integrated modelling of material flows and energy systems (MIMES).
International Journal of Energy Research 18(3): 359-381.
Uluer, M. U., Unver, H.O., Gok, G., Fescioglu-Unver, N., Kilic, S.E., 2015. A framework for energy reduction in manufacturing process chains (E-MPC) and a case study from the Turkish household appliance industry. Journal of Cleaner Production: http://dx.doi.org/10.1016/j.jclepro.2015.09.106.
Zhang, R., Chiong, R., 2015. Solving the energy-efficient job shop scheduling problem: a
multi-objective genetic algorithm with enhanced local search for minimizing the total weighted tardiness and total energy consumption. Journal of Cleaner Production:
http://dx.doi.org/10.1016/j.jclepro.2015.09.097.