R E S E A R C H A R T I C L E
Open Access
Global lung function initiative 2012
reference values for spirometry in Asian
Americans
Jingzhou Zhang
1,2, Xiao Hu
1,3, Xinlun Tian
1and Kai-Feng Xu
1*Abstract
Background:Spirometry reference values specifically designed for Asian Americans are currently unavailable. The performance of Global Lung Function Initiative 2012 (GLI-2012) equations on assessing spirometry in Asian Americans has not been evaluated. This study aimed to assess the fitness of relevant GLI-2012 equations for spirometry in Asian Americans.
Methods:Asian subjects who never smoked and had qualified spirometry data were extracted from the National
Health and Nutrition Examination Survey (NHANES) 2011–2012. Z-scores of forced expiratory volume in 1 s (FEV1), forced vital capacity (FVC), and FEV1/FVC were separately constructed with GLI-2012 equations for North East (NE) Asians, South East (SE) Asians, and individuals of mixed ethnic origin (Mixed). In addition, Proportions of subjects with observed spirometry data below the lower limit of normal (LLN) were also evaluated on each GLI-2012 equation of interest.
Results:This study included 567 subjects (250 men and 317 women) aged 6–79 years. Spirometry z-scores (z-FEV1, z-FVC, and z-FEV1/FVC) based on GLI-2012 Mixed equations had mean values close to zero (−0.278 to−0.057) and standard deviations close to one (1.001 to 1.128); additionally, 6.0% (95% confidence interval (CI) 3.1–8.9%) and 6.4% (95% CI 3.7–9.1%) of subjects were with observed data below LLN for FEV1/FVC in men and women, respectively. In contrast, for NE Asian equations, all mean values of z-FEV1and z-FVC were smaller than−0.5; for SE Asian equations, mean values of z-FEV1/FVC were significantly smaller than zero in men (−0.333) and women (−0.440).
Conclusions:GLI-2012 equations for individuals of mixed ethnic origin adequately fitted spirometry data in this sample of Asian Americans. Future studies with larger sample sizes are needed to confirm these findings.
Keywords:Asian Americans, Lung function, LLN, Spirometry, Z-score
Background
Accurate interpretation of pulmonary function test results, which requires valid spirometry reference values, is of ma-terial importance to respiratory medicine. In addition to gender, age, and height, race/ethnicity acts as another
major determinant of lung function [1–3]. Therefore, it is
recommended that spirometry reference values estab-lished with healthy people of similar race/ethnicity be ap-plied to a certain population whenever possible. The European Respiratory Society (ERS)/American Thoracic
Society (ATS) recommended spirometry reference values that were based on a sample from the third National Health and Nutrition Examination Survey (NHANES III)
for population aged 8–80 years in US [4,5]. Nonetheless,
limited by race/ethnicity classification in NHANES III, spirometry reference values for Asian Americans were
un-able to be produced through Hankinson et al.’s study [5].
Previous studies showed that Asian Americans had clinic-ally significantly lower forced expiratory volume in 1 s
(FEV1) and forced vital capacity (FVC) compared with
Cau-casian people in US [6–11]. Accordingly, a correction factor
for FEV1and FVC has been developed and calibrated to be
applied to NHANES III Caucasian equations when asses-sing spirometry in Asian Americans. Specifically, 0.94 and
* Correspondence:[email protected]
1Department of Respiratory Medicine, Peking Union Medical College
Hospital, Peking Union Medical College & Chinese Academy of Medical Sciences, Beijing 100730, China
Full list of author information is available at the end of the article
© The Author(s). 2018Open AccessThis article is distributed under the terms of the Creative Commons Attribution 4.0
International License (http://creativecommons.org/licenses/by/4.0/), which permits unrestricted use, distribution, and
0.88 have been sequentially proposed as the correction
factor for FEV1and FVC [4,12,13]. A recent systemic
re-view suggested that a correction factor of 0.88 was more suitable than 0.94 to be applied to NHANES III Caucasian
reference values for FEV1 and FVC evaluation in Asian
Americans [14].
In 2012, the Global Lung Function Initiative
(GLI-2012) published all-age-covering spirometry pre-dictive equations for multiple ethnicities, including
North East (NE) Asian and South East (SE) Asian [15].
In addition, a set of GLI-2012 equations were designed
for individuals of mixed ethnic origin (Mixed) [15].
Al-though with mixed results, GLI-2012 equations showed clinically acceptable generalisability to spirometry in
sev-eral validation samples [16–21]. Therefore, relevant
GLI-2012 equations are potentially useful for evaluating lung function of Asian Americans. Nonetheless, per-formance of GLI-2012 reference equations on assessing spirometry in Asian Americans has not been evaluated.
Asian people, including Asian alone and in combin-ation with other races, account for more than 17.3
mil-lion (5.6%) of total American population in 2010 [22].
Of note, the total US Asian population increased by 5.4 million (45.6%) from 2000 to 2010, and is projected to
grow to 48.6 million by 2060 [23,24]. Owing to the
re-markable quantity and rapid growth of Asian population in US, it is clinically important to assess spirometry ref-erence values that have been recommended for or can be potentially used in that population. Herein, we con-ducted this study to assess the fitness of relevant GLI-2012 equations and NHANES III reference values for spirometry in Asian Americans.
Methods Study design
Asian subjects from NHANES 2011–2012, where
spir-ometry data were available, were included in this study. The NHANES utilized a complex, multistage, probability sampling design to collect health and nutrition data from a nationally representative sample of civilian, non-institutionalized people in US each year. Since the year of 2011, NHANES has started to oversample Asian
population in US and code them as “non-Hispanic
Asian” for race/ethnicity, which provided opportunity
for investigating health conditions specifically on Asian
Americans [25]. NHANES 2011–2012 finally released
demographic, nutritional, and health data of 1282 non-Hispanic Asian participants, which served as the basis for this study. NHANES protocols were reviewed and approved by the Research Ethics Review Board of National Center for Health Statistics, and written in-formed consent was obtained from each NHANES participant.
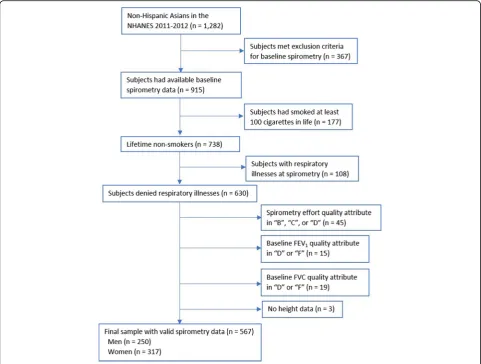
This study’s exclusion criteria were: 1) examinees who
did not qualify for a baseline spirometry test; 2) current or past smokers (defined as those who had smoked at least 100 cigarettes in life); 3) participants who reported respiratory illnesses (cough, cold, phlegm, runny nose, or other respiratory illnesses) seven days prior to the exam-ination; 4) baseline spirometry effort quality attribute of
“B”, “C” or “D”, or baseline FEV1 or FVC quality
attri-bute of“D (questionable results, use with caution)”or“F
(results not valid)” [26,27]. A detailed study sample
in-clusion and exin-clusion process is shown in Fig.1.
Spirometry measurements
Participants aged 6–79 years were eligible for spirometry
tests in NHANES 2011–2012. Examinees who had
breath-ing problem requirbreath-ing oxygen/takbreath-ing deep breath, current ear infection, eye/chest/abdominal surgery, or stroke/heart attack in the past three months, tuberculosis in the past year, or coughing up blood in the past month were ex-cluded from a baseline spirometry. Technicians received formal training and used an Ohio 822/827 dry-rolling seal volume spirometer (Ohio Medical, Gurnee, IL, USA) for spirometry tests. Regular calibration of spirometry equip-ment and rigorous spirometry curves quality control were conducted by health technicians and were subsequently
verified by supervisory staff [28].
Statistical analysis
The fitness of GLI-2012 reference equations designed for NE Asians, SE Asians, and individuals of mixed eth-nic origin and Caucasians were evaluated for spirometry in this sample. GLI-2012 equations were designed using
the “Generalized Additive Models for Location, Scale,
and Shape (GAMLSS)”method, which permitted the
fit-ness of mean (M), coefficient of variance (S), and
skew-ness (L) of spirometry data [15, 29]. Z-scores of FEV1
(z-FEV1), FVC (z-FVC), and FEV1/FVC (z-FEV1/FVC)
were calculated using the formula: z-score = ((observed value/M) ^ L - 1) / (L*S). The z-score is defined as how many standard deviations (SDs) a measured value is from predicted value (z-score = (observed - predicted)/SD). One may argue that the z-score is a more appropriate approach to reporting lung function data than using % predicted by considering lung function related variables (age, height,
ethnicity, etc.) [30]. The proportion of subjects with
ob-served spirometry data below lower limit of normal (LLN), which corresponds to the 5th percentile of
pre-dicted values, were also evaluated for FEV1, FVC, and
FEV1/FVC on each GLI-2012 equation of interest. The
cutoff z-score of LLN was calculated with the formula:
LLN z-score =−1.6445 * (SD of z-scores).
Student’s t-tests were used to examine the difference
Caucasian equations with 0.88 as the correction factor
for FEV1 and FVC against GLI-2012 Mixed equations
were generated (difference = NHANES III prediction –
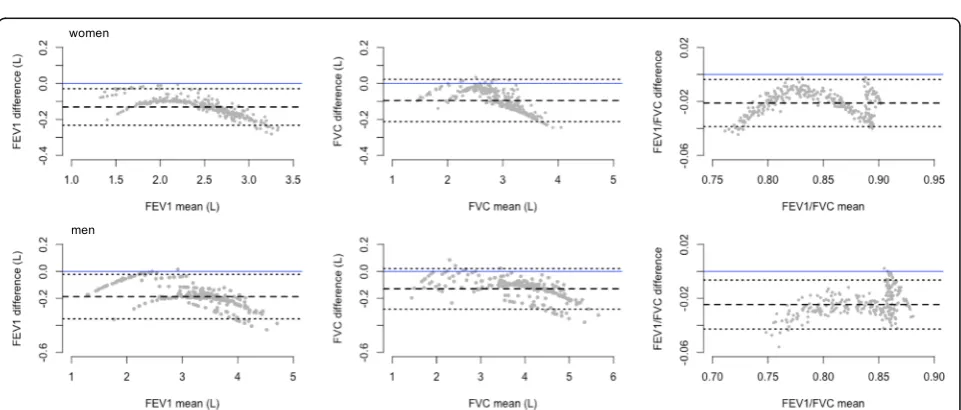
GLI-2012 prediction). Bland-Altman plots are used to describe agreement between two quantitative methods of measurement by calculating the mean difference and 95% limits of agreement (1.96*SD of the difference)
be-tween the two measurements [31]. A two-sidedP< 0.05
was considered statistically significant for all tests. Data analyses were performed with SAS 9.4 (SAS Institute, Cary, NC, USA) and R version 3.4.0 (R Foundation for Statistical Computing, Vienna, Austria).
Results
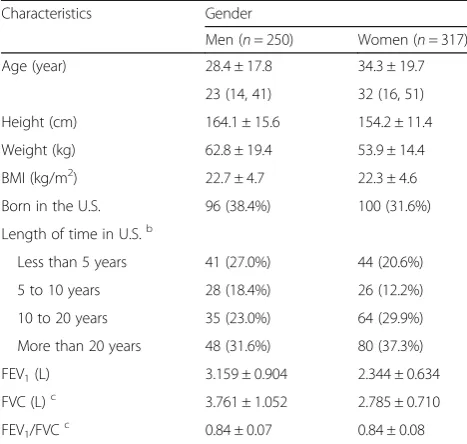
Sample characteristics (Table1)
Five hundred and sixty-nine Asian participants (250 men and 317 women) were finally included in this ana-lysis. The mean (SD) age were 28.4 (17.8) years for men and 34.3 (19.7) years for women; and the age range for men and women were 6 to 75 years and 6 to 79 years,
respectively (Fig.2). The mean (SD) height for men and
women were 164.1 (15.6) cm and 154.2 (11.4) cm, re-spectively. In this sample, there were 17 (6.8%) men and
19 (6.0%) women who had a BMI≥30 kg/m2.
Addition-ally, 38.4% of men and 31.6% of women were born in US. Among those who were not born in US, 31.6% of men and 37.3% of women had lived in US for more than 20 years, whereas 27.0% of men and 20.6% of women had been in US for less than 5 years.
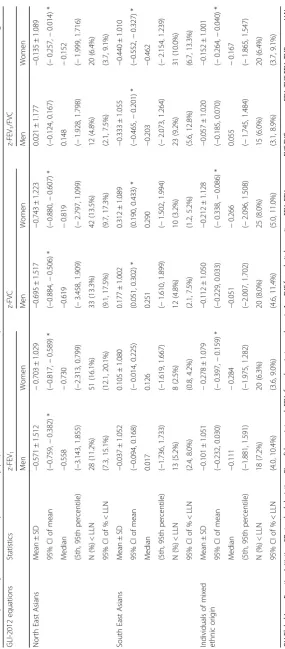
Performance of GLI-2012 equations (Table2)
For NE Asian equations, all mean (median) values of
z-FEV1and z-FVC were smaller than −0.5 in both men
and women, with the lowest as −0.743 (−0.819) for
z-FVC in women. For SE Asian equations, mean values
of z-FEV1/FVC were−0.333 in men and−0.440 in
women, all significantly different from zero. In terms of
the Mixed equations, all mean values of z-FEV1, z-FVC,
and z-FEV1/FVC were not significantly different from
zero in men; and in women, although statistically signifi-cantly different from zero, all absolute differences were within 0.3. SDs of z-scores based on GLI-2012 SE Asian
equations and the Mixed equations ranged from 1.002 to 1.089 and 1.001 to 1.128, respectively, indicating that those equations adequately fitted variations of our
spir-ometry data. In contrast, SDs of z-FEV1 and z-FVC
based on GLI-2012 NE Asian equations were 1.512 and 1.517, respectively. Distributions of z-scores based on
GLI-2012 equations were showed in Fig. 3. For
Cauca-sian equations, mean values of z-FEV1and z-FVC were
substantially smaller than zero in both men and women
(Additional file 1: Fig. S1). Also, plots of spirometry
z-scores for GLI-2012 reference eqs. (NE, SE, and the
Mixed) against age in men and women were showed in
Additional file 2: Fig. S2 and Additional file 3: Fig. S3,
respectively.
Regarding proportion of observed spirometry data below LLN (% < LLN), the Mixed equations showed a satisfactory overall performance. Specifically, 6.0% (95%
confidence interval (CI): 3.1–8.9%) and 6.4% (95% CI:
3.7–9.1%) of z-FEV1/FVC were below LLN for men and
women, respectively. In contrast, according to SE Asian
equations, 9.2% (95% CI: 5.6–12.8%) of z-FEV1/FVC in
men and 10.0% (95% CI: 6.7–13.3%) of z-FEV1/FVC in
women were below LLN; for NE Asian equations, all %
< LLN for z-FEV1 and z-FVC were significantly larger
than 5% (11.2 to 16.2%).
In addition, we confirmed that the NHANES III Cau-casian reference values with a correction factor of 0.88
for FEV1 and FVC satisfactorily fitted the spirometry
data (FEV1and FVC) of this sample (data not shown).
Agreement between NHANES III and GLI-2012 predictions
Overall, lung function predictions based on NHANES III Caucasian reference values with a correction factor of
0.88 for FEV1 and FVC were smaller than those based
on the GLI-2012 equations for FEV1, FVC, and FEV1/
FVC (Fig. 4). The average differences in FEV1(L), FVC
(L), and FEV1/FVC (%) predictions were−0.187,−0.130,
and−2.46 for men, and−0.131, −0.095, and−2.12 for
women, respectively.
Discussion
In this population-based cross-sectional analysis of lung function, we were the first to assess the generalisability of relevant GLI-2012 reference equations to spirometry in Asian Americans. In addition, we evaluated the agree-ment of lung function predictions between the NHANES III Caucasian values with a correction factor of 0.88 for
Table 1Baseline characteristics of sample subjects by gendera
Characteristics Gender
Men (n= 250) Women (n= 317)
Age (year) 28.4 ± 17.8 34.3 ± 19.7
23 (14, 41) 32 (16, 51)
Height (cm) 164.1 ± 15.6 154.2 ± 11.4
Weight (kg) 62.8 ± 19.4 53.9 ± 14.4
BMI (kg/m2) 22.7 ± 4.7 22.3 ± 4.6
Born in the U.S. 96 (38.4%) 100 (31.6%)
Length of time in U.S.b
Less than 5 years 41 (27.0%) 44 (20.6%)
5 to 10 years 28 (18.4%) 26 (12.2%)
10 to 20 years 35 (23.0%) 64 (29.9%)
More than 20 years 48 (31.6%) 80 (37.3%)
FEV1(L) 3.159 ± 0.904 2.344 ± 0.634
FVC (L)c 3.761 ± 1.052 2.785 ± 0.710
FEV1/FVCc 0.84 ± 0.07 0.84 ± 0.08
BMIbody mass index,FEV1forced expiratory volume in 1 s,FVCforced vital capacity
a
data were presented as mean ± standard deviation, median (interquartile range), or as number (percentage)
b
for participants who were not born in the United States; 2 missing these data for men and 3 missing these data for women
c
1 missing these data for men and 6 missing these data for women
Fig. 3Distributions of z-scores of FEV1, FVC, and FEV1/FVC based on GLI-2012 equations for North East Asians, South East Asians, and individuals of mixed ethnic origin. Panels A and B showed z-score distributions based on GLI-2012 equations for North East Asians in women and men, respectively; panels C and D showed z-score distributions based on GLI-2012 equations for South East Asians in women and men, respectively; and panels E and F showed z-score distributions based on GLI-2012 equations for individuals of mixed ethnic origin in women and men, respectively. In this graph, red dot denotes 5th and 95th percentiles of observed spirometry data; blue diamond denotes median of observed values; solid line represents a z-score of zero; and dotted line represents z-scores of ±1.96.FEV1: forced expiratory volume in 1 s; FVC: forced vital capacity; GLI: Global Lung Function Initiative
FEV1and FVC and the GLI-2012 equations for
individ-uals of mixed ethnic origin.
Our findings showed that GLI-2012 Mixed equations
adequately fitted FEV1, FVC, and FEV1/FVC data of our
sample for both gender. GLI-2012 Mixed equations were designed for people of mixed ethnic origin, which we be-lieve current Asian Americans could be categorized into due to the following several reasons. First, in the year 2010, around 16% of Asian Americans were Asian in combination with one or more other races, among whom Asian in combination with White were the
major-ity [22]. Second, US Asian population consists of more
than twenty subgroups, with Chinese, Indian, Filipino, Vietnamese, Korean, and Japanese accounting for the
most in quantity [22]. Third, due to diversities of birth
country and years living in US, which is readily trans-lated into difference in environmental exposures and so-cioeconomic status, Asian Americans may have quite
different lung function development [32–37]. Therefore,
Asian Americans are genetically, environmentally, and socioeconomically heterogeneous in nature, which may explain the satisfactory performance of GLI-2012 Mixed equations in fitting spirometry data in this sample.
GLI-2012 NE Asian equations were built based on two datasets, one collected from North China and the other from South Korea; whereas the GLI-2012 SE Asian equations were derived from a collated dataset consist-ing of five subsamples from South Asia and a subsample
from US [15]. Quanjer et al. found that the two
subsam-ples of NE Asians had significantly larger lung function than the six subsamples of SE Asians, and therefore they constructed spirometry predictive equations separately
for NE Asians and SE Asians [15]. Not surprisingly,
GLI-2012 NE Asian equations led to substantially larger
FEV1and FVC predictions compared with observed data
in our sample for both gender, strongly suggesting against the application of those equations to assessing spirometry in Asian Americans. GLI-2012 SE Asian
equations, while performed satisfactorily in fitting FEV1
and FVC, contributed to significantly larger FEV1/FVC
predictions compared with the observed data, which will potentially result in an overdiagnosis of chronic ob-structive pulmonary disease in Asian Americans.
Generally, both the GLI-2012 Mixed equations and the NHANES III Caucasian reference values with a cor-rection factor of 0.88 adequately fitted the lung function data in this sample. However, GLI-2012 equations pos-sess several potential advantages over the NHANES III reference values. First, as all-age-covering spirometry reference values, GLI-2012 equations are valid for
people aged 3 to 95 years old [38]; the NHANES III
equations, in contrast, have a comparably narrower valid age range of 8 to 80 years. Of note, in this study we were not able to evaluate the fitness of GLI-2012 equations
for spirometry in Asian Americans aged outside 6 to 79 years. Secondly, GLI-2012 equations were designed with a semiparametric predictive modelling method, which was able to fit variance and skewness of
spirom-etry data in addition to the mean value [39]. Moreover,
splines used in GLI-2012 equations modeled age-related variations for spirometry data. NHANES III equations
were built based on quadratic function for FEV1 and
FVC and linear function for FEV1/FVC. Thus, compared
with GLI-2012 equations, NHANES III equations were less likely to reflect actual patterns of spirometry data due to their fixed function formats. Thirdly, NHANES
III equations for FEV1/FVC LLN and equations for
FEV1/FVC are same as each other except different
inter-cepts. Therefore, according to NHANES III equations,
LLN for FEV1/FVC differs from FEV1/FVC by a constant
magnitude regardless of a subject’s age. However, since
LLN theoretically corresponds to the 5th percentile of spirometry data and lung function varies with age, it is conceptually insufficient to define LLN as a constant dif-ference to the mean for the entire age range. GLI-2012 reference values address this issue by defining LLN with spirometry z-scores, a way comprehensively taking mean, variance, and skewness of spirometry data into consideration.
The GLI-2012 equations have been proposed to be adopted worldwide in order to standardise the
interpret-ation of lung function [40]. Admittedly, the application
of a correction factor to the NHANES III Caucasian ref-erence values offers a practical solution to assessing spir-ometry in Asian Americans. However, the rationale behind the development of a correction factor, which is only for temporary use, is not conceptually and meth-odologically ideal. Based on the current findings and what has been discussed above, it is reasonable to regard GLI-2012 Mixed equations as superior to the NHANES III Caucasian reference values with a correction factor for evaluating spirometry in Asian Americans. In par-ticular, the ready availability of spirometry z-scores and LLN from the GLI-2012 equations could possibly pro-vide a convenient approach to the diagnosis and severity stratification of obstructive lung diseases. Therefore, with the rapid increase of Asian population in US, the application of GLI-2012 Mixed equations to Asian Americans is clinically important.
This study has several limitations. First, the sample size of this study is relatively small. However, we would argue that our sample sizes of men and women are both large enough for validating spirometry reference values,
which requires at least 150 subjects for each gender [41].
Second, as shown in Fig. 2, the distributions of age are
that population. This issue is clinically relevant in that obstructive lung diseases, where lung function references are widely used, are most prevalent in elderly people. As the accrual of NHANES data of Asian Americans, the fitness of GLI-2012 equations could be better evaluated in the near future.
Conclusions
In this cross-sectional analysis of lung function from a na-tionally representative sample of US Asian population, we showed that the GLI-2012 reference equations for individ-uals of mixed ethnic origin performed adequately on fit-ting spirometry data of this sample. Considering the strengths of GLI-2012 equations such as all-age-covering capacity and readily z-score calculation and LLN defin-ition, the GLI-2012 equations for individuals of mixed eth-nic origin are reasonably considered as a useful set of tools in evaluating spirometry in Asian Americans. Fur-ther studies with larger sample sizes covering wider age ranges, especially the most elderly (> 80 years) people, are warranted to confirm these findings.
Additional files
Additional file 1:Figure S1.Distributions of z-scores of FEV1, FVC, and FEV1/FVC based on GLI-2012 equations for Caucasians. (PDF 63 kb)
Additional file 2:Figure S2.Distributions of z-FEV1, z-FVC, and z-FEV1/ FVC based on GLI-2012 equations for NE Asians, SE Asians, and individuals of mixed ethnic origin against age in men. (PDF 185 kb)
Additional file 3:Figure S3.Distributions of z-FEV1, z-FVC, and z-FEV1/ FVC based on GLI-2012 equations for NE Asians, SE Asians, and individuals of mixed ethnic origin against age in women. (PDF 208 kb)
Abbreviations
ATS:American Thoracic Society; ERS: European Respiratory Society; FEV1: Forced Expiratory Volume in 1 s; FVC: Forced Vital Capacity; GLI: Global Lung Function Initiative; LLN: Lower Limit of Normal; NHANES: National Health and Nutrition Examination Survey; North East Asian: NE Asian; South East Asian: SE Asian
Acknowledgements
We thank all NHANES participants for their willingness to spare valuable time and contribute health data to this epidemiologic study.
Funding
This study was supported by the National Key Basic Research Program of China (973 Program) (Grant No. 2015CB553402).
Availability of data and materials
The datasets used and/or analysed during the current study available from the corresponding author on reasonable request.
Authors’contributions
JZ, XH, XT, and KFX designed this study. JZ and XH collected, analyzed data, and drafted the manuscript. All authors interpreted data, critically reviewed the paper, and approved the final version of manuscript for publication.
Ethics approval and consent to participate
The NHANES protocols were reviewed and approved by the Research Ethics Review Board of National Center for Health Statistics. Written informed consents were obtained from all NHANES participants.
Competing interests
The authors declare that they have no competing interests.
Publisher’s Note
Springer Nature remains neutral with regard to jurisdictional claims in published maps and institutional affiliations.
Author details
1
Department of Respiratory Medicine, Peking Union Medical College Hospital, Peking Union Medical College & Chinese Academy of Medical
Sciences, Beijing 100730, China.2Department of Epidemiology, Mailman
School of Public Health, Columbia University, New York, NY, USA.3Yale
School of Public Health, Yale University, New Haven, CT, USA.
Received: 16 January 2018 Accepted: 21 May 2018
References
1. Yang TS, Peat J, Keena V, Donnelly P, Unger W, Woolcock A. A review of the racial differences in the lung function of normal Caucasian,Chinese and Indian subjects. Eur Respir J. 1991;4(7):872–80.
2. Braun L, Wolfgang M, Dickersin K. Defining race/ethnicity and explaining difference in research studies on lung function. Eur Respir J. 2013;41(6): 1362–70.
3. Strippoli MP, Kuehni CE, Dogaru CM, Spycher BD, McNally T, Silverman M, et al. Etiology of ethnic differences in childhood spirometry. Pediatrics. 2013; 131(6):e1842–9.
4. Pellegrino R, Viegi G, Brusasco V, Crapo RO, Burgos F, Casaburi R, et al. Interpretative strategies for lung function tests. Eur Respir J. 2005; 26(5):948–68.
5. Hankinson JL, Odencrantz JR, Fedan KB. Spirometric reference values from a sample of the general US population. Am J Respir Crit Care Med. 1999; 159(1):179–87.
6. Fulambarker A, Copur AS, Javeri A, Jere S, Cohen ME. Reference values for pulmonary function in Asian Indians living in the United States. Chest. 2004; 126(4):1225–33.
7. Korotzer B, Ong S, Hansen JE. Ethnic differences in pulmonary function in healthy nonsmoking Asian-Americans and European-Americans. Am J Respir Crit Care Med. 2000;161(4 Pt 1):1101–8.
8. Lin FL, Kelso JM. Pulmonary function studies in healthy Filipino adults residing in the United States. J Allergy Clin Immunol. 1999;104(2 Pt 1):338–40.
9. Marcus EB, MacLean CJ, Curb JD, Johnson LR, Vollmer WM, Buist AS. Reference values for FEV1 in Japanese-American men from 45 to 68 years of age. Am Rev Respir Dis. 1988;138(6):1393–7.
10. Sharp DS, Enright PL, Chiu D, Burchfiel CM, Rodriguez BL, Curb JD. Reference values for pulmonary function tests of Japanese-American men aged 71 to 90 years. Am J Respir Crit Care Med. 1996;153(2):805–11. 11. Massey DG, Fournier-Massey G. Japanese-American pulmonary reference
values: influence of environment on anthropology and physiology. Environ Res. 1986;39(2):418–33.
12. Hankinson JL, Kawut SM, Shahar E, Smith LJ, Stukovsky KH, Barr RG. Performance of American Thoracic Society-recommended spirometry reference values in a multiethnic sample of adults: the multi-ethnic study of atherosclerosis (MESA) lung study. Chest. 2010;137(1):138–45.
13. Townsend MC. Occupational, environmental lung disorders C: spirometry in the occupational health setting–2011 update. J Occup Environ Med. 2011; 53(5):569–84.
14. Redlich CA, Tarlo SM, Hankinson JL, Townsend MC, Eschenbacher WL, Von Essen SG, et al. American Thoracic Society Committee on spirometry in the occupational S: official American Thoracic Society technical standards: spirometry in the occupational setting. Am J Respir Crit Care Med. 2014; 189(8):983–93.
15. Quanjer PH, Stanojevic S, Cole TJ, Baur X, Hall GL, Culver BH, et al. Multi-ethnic reference values for spirometry for the 3-95-yr age range: the global lung function 2012 equations. Eur Respir J. 2012;40(6):1324–43.
17. Langhammer A, Johannessen A, Holmen TL, Melbye H, Stanojevic S, Lund MB, et al. Global lung function initiative 2012 reference equations for spirometry in the Norwegian population. Eur Respir J. 2016;48(6):1602–11. 18. Hall GL, Thompson BR, Stanojevic S, Abramson MJ, Beasley R, Coates A, et al. The global lung initiative 2012 reference values reflect contemporary Australasian spirometry. Respirology. 2012;17(7):1150–1.
19. Bonner R, Lum S, Stocks J, Kirkby J, Wade A, Sonnappa S. Applicability of the global lung function spirometry equations in contemporary multiethnic children. Am J Respir Crit Care Med. 2013;188(4):515–6.
20. Zhang J, Hu X, Shan G. Spirometry reference values for population aged 7-80 years in China. Respirology. 2017;22(8):1630–6.
21. Backman H, Lindberg A, Sovijarvi A, Larsson K, Lundback B, Ronmark E. Evaluation of the global lung function initiative 2012 reference values for spirometry in a Swedish population sample. BMC Pulm Med. 2015;15:26. 22. The Asian Population: 2010 [https://www.census.gov/library/publications/
2012/dec/c2010br-11.html].
23. The Asian Population: 2000 [https://www.census.gov/library/publications/ 2002/dec/c2kbr01-16.html].
24. US Census Bureau.2014 National Population Projections Tables [https://www. census.gov/data/tables/2014/demo/popproj/2014-summary-tables.html]. 25. Paulose-Ram R, Burt V, Broitman L, Ahluwalia N. Overview of Asian American
data collection, release, and analysis: National Health and nutrition examination survey 2011-2018. Am J Public Health. 2017;107(6):916–21. 26. Johannessen A, Omenaas ER, Eide GE, Bakke PS, Gulsvik A. Feasible and
simple exclusion criteria for pulmonary reference populations. Thorax. 2007; 62(9):792–8.
27. Hankinson JL, Eschenbacher B, Townsend M, Stocks J, Quanjer PH. Use of forced vital capacity and forced expiratory volume in 1 second quality criteria for determining a valid test. Eur Respir J. 2015;45(5):1283–92. 28. NHANES 2011-2012 Respiratory Health Spirometry Procedures Manual 2011,
https://wwwn.cdc.gov/nchs/data/nhanes/2011-2012/manuals/spirometry_ procedures_manual.pdf.
29. Quanjer GLI-2012 Regression Equation and Lookup Tables [http://www.ers- education.org/guidelines/global-lung-function-initiative/tools/quanjer-gli-2012-regression-equations-and-lookup-tables.aspx].
30. Stanojevic S, Quanjer P, Miller MR, Stocks J. The global lung function initiative: dispelling some myths of lung function test interpretation. Breathe. 2013;9(6):462–74.
31. Myles PS, Cui J. Using the bland-Altman method to measure agreement with repeated measures. Br J Anaesth. 2007;99(3):309–11.
32. Gehring U, Gruzieva O, Agius RM, Beelen R, Custovic A, Cyrys J, et al. Air pollution exposure and lung function in children: the ESCAPE project. Environ Health Perspect. 2013;121(11–12):1357–64.
33. Raju PS, Prasad KV, Ramana YV, Balakrishna N, Murthy KJ. Influence of socioeconomic status on lung function and prediction equations in Indian children. Pediatr Pulmonol. 2005;39(6):528–36.
34. Fulambarker A, Copur AS, Cohen ME, Patel M, Gill S, Schultz ST, et al. Comparison of pulmonary function in immigrant vs US-born Asian Indians. Chest. 2010;137(6):1398–404.
35. Gauderman WJ, Urman R, Avol E, Berhane K, McConnell R, Rappaport E, et al. Association of improved air quality with lung development in children. N Engl J Med. 2015;372(10):905–13.
36. Gauderman WJ, Avol E, Gilliland F, Vora H, Thomas D, Berhane K, et al. The effect of air pollution on lung development from 10 to 18 years of age. N Engl J Med. 2004;351(11):1057–67.
37. Hegewald MJ, Crapo RO. Socioeconomic status and lung function. Chest. 2007;132(5):1608–14.
38. Stanojevic S, Wade A, Stocks J, Hankinson J, Coates AL, Pan H, et al. Reference ranges for spirometry across all ages - a new approach. Am J Respir Crit Care Med. 2008;177(3):253–60.
39. Rigby RA, Stasinopoulos DM. Generalized additive models for location, scale and shape. Journal of the Royal Statistical Society Series C-Applied Statistics. 2005;54:507–44.
40. Swanney MP, Miller MR. Adopting universal lung function reference equations. Eur Respir J. 2013;42(4):901–3.