Open Access
Research article
Age and gender specific normal values of left ventricular mass,
volume and function for gradient echo magnetic resonance
imaging: a cross sectional study
Peter A Cain
1, Ragnhild Ahl
1, Erik Hedstrom
1, Martin Ugander
1,
Ase Allansdotter-Johnsson
2, Peter Friberg
3and Hakan Arheden*
1Address: 1Dept of Clinical Physiology, Lund University Hospital, SE-22185, Lund, Sweden, 2Dept of Radiology, Sahlgrenska Academy, SE-413 45,
Gothenburg, Sweden and 3Dept of Clinical Physiology, Sahlgrenska Academy, SE-413 45, Gothenburg, Sweden
Email: Peter A Cain - [email protected]; Ragnhild Ahl - [email protected]; Erik Hedstrom - [email protected]; Martin Ugander - [email protected]; Ase Allansdotter-Johnsson - [email protected];
Peter Friberg - [email protected]; Hakan Arheden* - [email protected] * Corresponding author
Abstract
Background: Knowledge about age-specific normal values for left ventricular mass (LVM), end-diastolic volume (EDV), end-systolic volume (ESV), stroke volume (SV) and ejection fraction (EF) by cardiac magnetic resonance imaging (CMR) is of importance to differentiate between health and disease and to assess the severity of disease. The aims of the study were to determine age and gender specific normal reference values and to explore the normal physiological variation of these parameters from adolescence to late adulthood, in a cross sectional study.
Methods: Gradient echo CMR was performed at 1.5 T in 96 healthy volunteers (11–81 years, 50 male). Gender-specific analysis of parameters was undertaken in both absolute values and adjusted for body surface area (BSA).
Results: Age and gender specific normal ranges for LV volumes, mass and function are presented from the second through the eighth decade of life. LVM, ESV and EDV rose during adolescence and declined in adulthood. SV and EF decreased with age. Compared to adult females, adult males had higher BSA-adjusted values of EDV (p = 0.006) and ESV (p < 0.001), similar SV (p = 0.51) and lower EF (p = 0.014). No gender differences were seen in the youngest, 11–15 year, age range.
Conclusion: LV volumes, mass and function vary over a broad age range in healthy individuals. LV volumes and mass both rise in adolescence and decline with age. EF showed a rapid decline in adolescence compared to changes throughout adulthood. These findings demonstrate the need for age and gender specific normal ranges for clinical use.
Background
Fundamental structural and functional properties of the left ventricle including left ventricular mass (LVM),
vol-umes, and function are often assessed in the clinical set-ting using two dimensional echocardiography. The clinical use of cardiac magnetic resonance imaging (CMR)
Published: 21 January 2009
BMC Medical Imaging 2009, 9:2 doi:10.1186/1471-2342-9-2
Received: 1 April 2008 Accepted: 21 January 2009
This article is available from: http://www.biomedcentral.com/1471-2342/9/2
© 2009 Cain et al; licensee BioMed Central Ltd.
BMC Medical Imaging 2009, 9:2 http://www.biomedcentral.com/1471-2342/9/2
Page 2 of 10
(page number not for citation purposes)
has increased lately and a consensus panel report has established clinical indications for cardiovascular mag-netic resonance [1].
It is of great clinical importance to be able to differentiate between normal and abnormal findings, but this may often prove difficult if adequate normal values are unknown. The need for age and gender specific normal values with CMR is therefore growing. Several studies have defined CMR normal ranges of LV volumes and func-tion in limited age ranges [2-8], and none of these have examined these parameters over a wide age range in healthy individuals. A recent study presented age and gen-der specific normal ranges for CMR at 1.5 T using a steady state free precession sequence [9]. However, at times, some centers still need to use gradient echo sequences in clinical assessment at 1.5 T.
The aim of the study was, therefore, to suggest clinically usable age and gender specific normal ranges for LV vol-umes and function using gradient echo CMR at 1.5 T for the second through the eighth decade of life. We also sought to explore, in a cross sectional study, the normal variation of LV volumes and function in strictly healthy subjects over a wide age range in order to examine the age variation of these parameters.
Methods
Study population and design
The study population consisted of 96 healthy volunteers prospectively recruited by advertisement from the local community (76 adults, age 21–81 and 20 children, age 11–15, all caucasian). No subjects were excluded because of poor image quality. All subjects had a normal electro-cardiogram (ECG) and blood pressure (systolic blood pressure (SBP) ≤ 140 mmHg and diastolic blood pressure (DBP) ≤ 90 mmHg) [10] and had no history of systolic or diastolic hypertension. Subjects with previous or current cardiovascular, systemic, metabolic disease, body mass index ≥ 30, visually overt aortic or mitral valve regurgita-tion in long axis MR images, or treatment with medicaregurgita-tion (except oral contraceptives [n=5], hormone replacement therapy [n=5] or oral incontinence medication [n=1]) were excluded from the study. MR imaging was performed within four weeks after inclusion with image analysis undertaken by independent observers blinded to subject characteristics. The investigation protocol and procedures were approved by the Lund University research ethics committee (reference number LU 207-00). Written informed consent was obtained from all subjects prior to inclusion.
Blood pressure
SBP and DBP were obtained in the supine or seated posi-tion by auscultaposi-tion using a brachial cuff.
MR imaging
All patients were imaged in the supine position using a 1.5 T system (Magnetom Vision; Siemens, Erlangen, Ger-many) with a 25 mT/m gradient system and a phased-array body coil. Standard scout images were used to locate the orthogonal planes of the heart. End-expiratory ECG triggered short-axis gradient echo cine loops were then acquired throughout the left ventricle from the base (atri-oventricular valve plane) to the apex. Typical imaging parameters were TR = 100 ms, and echo sharing gave an effective phase interval of 50 ms, TE = 4.8 ms, slice thick-ness 10 mm, field of view 350–420 mm, matrix 126 × 256, flip angle 20°. The number of cardiac phases per acquisition was determined as the integer obtained from the RR interval divided by TR. Nine to twelve slices were required to completely cover the left ventricle, depending on heart size.
MR image analysis
i) Tracing of endocardial and epicardial contours
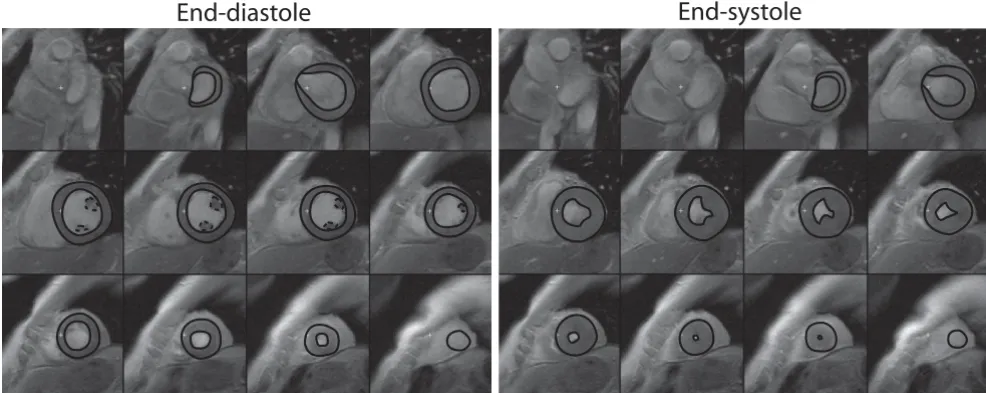
All measurements were undertaken manually without the aid of automated image analysis software. End-diastolic and end-systolic frames were identified according to tricular blood pool area. Measurements of the left ven-tricular endocardial and epicardial areas (Scion Image Beta 4.0.2, Scion Imaging Corporation) in each image frame were performed in the short-axis view. At the base of the left ventricle, the aortic outflow tract below the valve was included in volume measurements. The free papillary muscles were included for LVM assessment, and excluded for left ventricular volume assessment [11]. In the basal region of the heart where the left atrium was seen, only the portion of the slice that could be identified as left ventricle was included for measurement (Figure 1).
ii) Left ventricular mass and dimensions
The difference in area between the endocardial and epicar-dial contours multiplied by the slice thickness (10 mm) represented myocardial volume for a given slice. Total myocardial mass was obtained by calculating the sum of all myocardial slice volumes and multiplying by the myo-cardial specific gravity (1.05 g/cm3). End-diastolic volume
Statistical analysis
SPSS (version 16) was used for statistical calculations. A p
value less than 0.05 was considered statistically signifi-cant. Values are expressed as mean ± SD. Unpaired Stu-dent's t test or ANOVA were used to test for significance between groups since both visual inspection and the Kol-mogorov-Smirnov test showed that all measures were ade-quately normally distributed. Intra- and interobserver variability were assessed as the mean difference of meas-urements ± SD and by the intraclass correlation coeffe-cient (ICC) employing a two-way mixed model [12]. The coefficient of variation (CV) was calculated as the SD of the difference between two measurements expressed as percent of their mean. The coeffiecient of repeatability (CR) was calculated as two times the SD of the difference in two measurements. Pearson's correlation coefficient was used to assess the correlation between two variables, and expressed as its square (R2). BSA was calculated using
a previously described technique [13]. Curve estimation and the 95% prediction intervals of LVM, dimensions, and function were defined using commercial software (Matlab curve fitting toolbox, Matlab version R12, Math-works). The most appropriate curve fitting algorithm for LVM, dimensions and functional measures was identified as the rational polynomial of the form P(x)/Q(x) where both numerator and denominator were at most of the sec-ond degree and which had the highest adjusted R2 and
lowest root mean square (RMS) of the error [14]. The pre-dicted lower, mean and upper limits for normal values of LV parameters in each decade were calculated as the aver-age of the mean and 95% prediction interval of the
pre-dicted values for each whole year as given by the curve estimation model.
Results
Population description
Data from 94 of the 96 subjects have, in part, previously been published in a study of LVM and wall stress [14]. Table 1 displays the baseline characteristics for the current study population. Blood pressure was similar between genders and well within accepted normal limits [10].
Normal variation of left ventricular measures with age
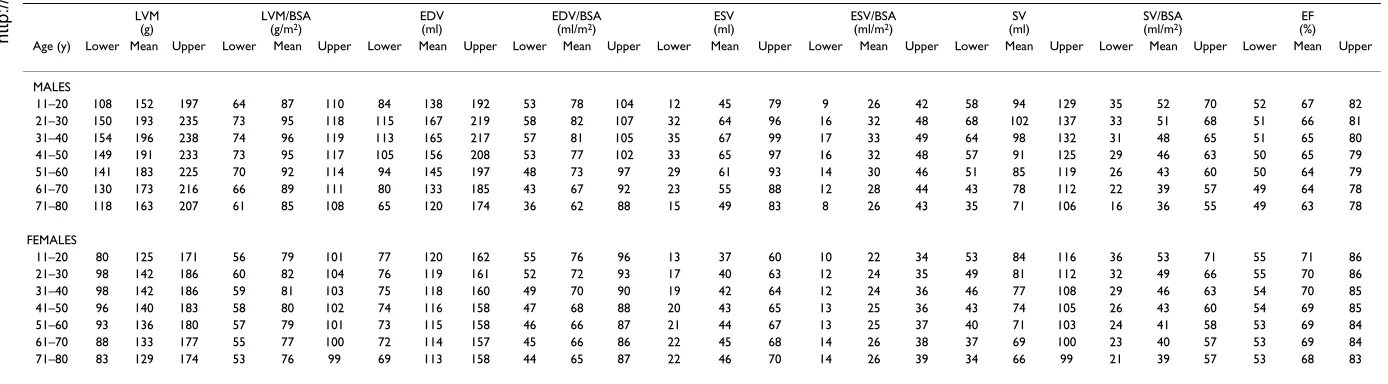
Table 2 lists suggested age-specific reference values for LV mass, EDV, ESV, SV and EF as absolute values and adjusted for BSA for males and females, respectively.
i) Left ventricular mass
Information on the age dependence of LV mass and wall stress in the majority of this population have been pub-lished and discussed previously [14]. The current study, however, provides tabular values in order to ease the use of this information as reference values. Figure 2 and Figure 3 describe the changes in left ventricular mass with age.
ii) End-diastolic and End-systolic volume
Ventricular volumes varied markedly between males and females (Figure 2 and Figure 3). Notably, there was a rise in EDV and ESV during adolescence and early adulthood in males, with a decline thereafter, possibly reflecting the concurrent change of LVM with age. This was absent in females with a trend towards a decrease of EDV and EDV/
Delineation of the left ventricular borders in the short axis plane in end-diastole and end-systole Figure 1
Delineation of the left ventricular borders in the short axis plane in end-diastole and end-systole. Both the endo-cardial and epiendo-cardial borders were outlined manually for both ventricular volume and mass measurement (solid lines). Papillary muscle measurements were only included for mass measurements (dashed lines).
BMC Medical Imaging 2009, 9:2 http://www.biomedcentral.com/1471-2342/9/2
Page 4 of 10
(page number not for citation purposes)
BSA with age and increase of ESV and ESV/BSA with age. Ventricular volumes in the adolescent group were similar between males and females (EDV: 120 ± 29 ml vs. 114 ± 23 ml, p = 0.66; EDV/BSA: 76 ± 11 ml/m2 vs. 77 ± 11 ml/
m2, p = 0.95; ESV: 35 ± 8 ml vs. 32 ± 11 ml, p = 0.48; ESV/
BSA: 22 ± 4 ml/m2 vs. 21 ± 7 ml/m2, p = 0.65). However,
differences between genders became apparent for all ven-tricular volumes in the adult group with higher values in the male group (EDV: 153 ± 30 ml vs. 118 ± 19 ml, p < 0.001; EDV/BSA: 76 ± 13 ml/m2 vs. 69 ± 9 ml/m2, p =
0.006; ESV: 63 ± 17 ml vs. 43 ± 11 ml, p < 0.001; ESV/BSA: 31 ± 8 ml/m2 vs. 25 ± 6 ml/m2, p < 0.001).
iii) Left ventricular stroke volume and ejection fraction
In general, both SV and EF demonstrated a decline with age (Figure 3). Although differences in SV and EF between males and females were present in the adult group (SV: 91 ± 19 ml vs. 75 ± 15 ml, p < 0.001; SV/BSA: 45 ± 9 ml/m2
vs. 44 ± 9 ml/m2, p = 0.51; EF: 0.59 ± 0.07 vs. 0.64 ± 0.08,
p = 0.014), SV and EF were similar between genders in the adolescent group (SV: 85 ± 22 ml vs. 83 ± 16 ml, p = 0.82; SV/BSA: 54 ± 9 ml/m2 vs. 55 ± 7 ml/m2, p = 0.70; EF: 0.71
± 0.04 vs. 0.73 ± 0.06, p = 0.36). Notably, left ventricular EF in the adolescent group was higher (Figure 3) com-pared to adult subjects (0.72 ± 0.05 vs. 0.61 ± 0.07, p < 0.001) with a decline in both males and females from ~70% to ~60% with age.
Normal ranges for left ventricular mass, volumes and function
All variables varied according to age group (ANOVA, p < 0.05) except for EDV/BSA (p = 0.13) and ESV/BSA (p = 0.06) in males, and EDV (p = 0.39), EDV/BSA (p = 0.15), ESV/BSA (p = 0.28), SV (p = 0.14) and LVM/BSA (p = 0.24) in females.
Intra- and interobserver variability
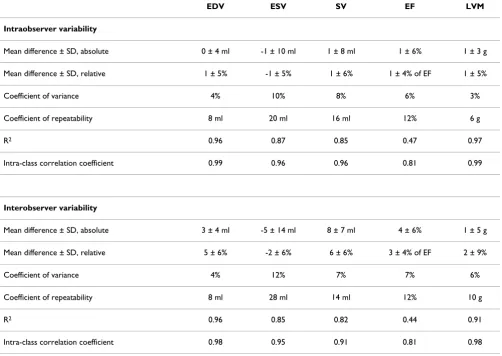
Data on intra- and interobserver variability are presented in Table 3.
Discussion
This study suggests age and gender specific normal values for LV mass, volumes and function measured in a healthy population over a large age range using gradient echo CMR at 1.5 T.
One of the most important tasks in patient examination is to distinguish normal findings from those indicative of disease. Normal ranges for a given parameter encompass-ing 95% of the population constitute the mainstay of this procedure. With increasing use of cardiac magnetic reso-nance imaging, the need for age-specific ranges of LV mass, volumes and function for this modality is obvious. This is of specific importance in order to correctly exclude disease.
Table 1: Baseline characteristics of the adult and adolescent study populations according to gender (mean ± SD).
Adults Adolescents
Male Female p Male Female p
Number 41 35 9 11
Age (years) 45 ± 16 46 ± 17 0.70 13 ± 2 12 ± 1 0.22
Height (m) 1.81 ± 0.07 1.68 ± 0.06 <0.001 1.63 ± 0.13 1.59 ± 0.08 0.46
Weight (kg) 80 ± 10 64 ± 10 <0.001 55 ± 14 50 ± 6 0.33
BSA (m2) 2.01 ± 0.15 1.73 ± 0.15 <0.001 1.56 ± 0.26 1.48 ± 0.13 0.38
BMI (kg/m2) 24.4 ± 2.3 22.7 ± 2.9 0.006 20.2 ± 2.6 19.7 ± 1.9 0.58
SBP (mmHg) 123 ± 9 123 ± 11 0.84 108 ± 10 108 ± 9 0.97
DBP (mmHg) 74 ± 7 72 ± 8 0.36 61 ± 3 61 ± 8 0.85
BMI = body mass index, BSA = body surface area,
BMC Medical Imaging
2
009
,
9
:2
http://www.bi
omedcen
tr
al
.co
m
/14
71-23 Page 5 of
(page number not for citation purposes)
Table 2: The predicted lower, mean and upper limits for normal left ventricular parameters in males and females of different ages.
LVM (g)
LVM/BSA
(g/m2) EDV(ml) EDV/BSA(ml/m2) ESV(ml) ESV/BSA(ml/m2) (ml)SV SV/BSA(ml/m2) (%)EF
Age (y) Lower Mean Upper Lower Mean Upper Lower Mean Upper Lower Mean Upper Lower Mean Upper Lower Mean Upper Lower Mean Upper Lower Mean Upper Lower Mean Upper MALES
11–20 108 152 197 64 87 110 84 138 192 53 78 104 12 45 79 9 26 42 58 94 129 35 52 70 52 67 82 21–30 150 193 235 73 95 118 115 167 219 58 82 107 32 64 96 16 32 48 68 102 137 33 51 68 51 66 81 31–40 154 196 238 74 96 119 113 165 217 57 81 105 35 67 99 17 33 49 64 98 132 31 48 65 51 65 80 41–50 149 191 233 73 95 117 105 156 208 53 77 102 33 65 97 16 32 48 57 91 125 29 46 63 50 65 79 51–60 141 183 225 70 92 114 94 145 197 48 73 97 29 61 93 14 30 46 51 85 119 26 43 60 50 64 79 61–70 130 173 216 66 89 111 80 133 185 43 67 92 23 55 88 12 28 44 43 78 112 22 39 57 49 64 78 71–80 118 163 207 61 85 108 65 120 174 36 62 88 15 49 83 8 26 43 35 71 106 16 36 55 49 63 78 FEMALES
11–20 80 125 171 56 79 101 77 120 162 55 76 96 13 37 60 10 22 34 53 84 116 36 53 71 55 71 86 21–30 98 142 186 60 82 104 76 119 161 52 72 93 17 40 63 12 24 35 49 81 112 32 49 66 55 70 86 31–40 98 142 186 59 81 103 75 118 160 49 70 90 19 42 64 12 24 36 46 77 108 29 46 63 54 70 85 41–50 96 140 183 58 80 102 74 116 158 47 68 88 20 43 65 13 25 36 43 74 105 26 43 60 54 69 85 51–60 93 136 180 57 79 101 73 115 158 46 66 87 21 44 67 13 25 37 40 71 103 24 41 58 53 69 84 61–70 88 133 177 55 77 100 72 114 157 45 66 86 22 45 68 14 26 38 37 69 100 23 40 57 53 69 84 71–80 83 129 174 53 76 99 69 113 158 44 65 87 22 46 70 14 26 39 34 66 99 21 39 57 53 68 83 BSA = body surface area, EDV = end diastolic volume, EF = ejection fraction,
BMC Medical Imaging 2009, 9:2 http://www.biomedcentral.com/1471-2342/9/2
Page 6 of 10
(page number not for citation purposes)
The normal age variation in left ventricular parameters in males (left) and females (right) Figure 2
The normal age variation in left ventricular parameters in males (left) and females (right). Solid lines represent rational polynomial curve fit and dashed lines the 95% prediction intervals of this fit. Reference values are listed in Table 2. LVM = left ventricular mass, BSA = body surface area, EDV = end-diastolic volume.
0 20 40 60 80 0
50 100 150 200 250
LV
M
[
g
]
Males
0 20 40 60 80 0
50 100 150 200 250
LV
M
[
g
]
F emales
0 20 40 60 80 0
50 100 150
LV
M
/
BS
A
[
g
m
−2
]
0 20 40 60 80 0
50 100 150
LV
M
/
BS
A
[
g
m
−2
]
0 20 40 60 80 0
50 100 150 200 250
E
D
V
[ml]
0 20 40 60 80 0
50 100 150 200 250
E
D
V
[ml]
0 20 40 60 80 0
50 100 150
Age [years ]
ED
V
/
BS
A
[
m
l m
−2
]
0 20 40 60 80 0
50 100 150
Age [years ]
ED
V
/
BS
A
[
m
l m
−2
The normal age variation in left ventricular parameters in males (left) and females (right) Figure 3
The normal age variation in left ventricular parameters in males (left) and females (right). Solid lines represent rational polynomial curve fit and dashed lines the 95% prediction intervals of this fit. Reference values are listed in Table 2. BSA = body surface area, ESV = end-systolic volume, SV = stroke volume, EF = ejection fraction.
0 20 40 60 80
0 20 40 60 80 100 120 E S V [ml] Males
0 20 40 60 80
0 20 40 60 80 100 120 E S V [ml] F emales
0 20 40 60 80
0 20 40 60 ESV / BS A [ m l m −2 ]
0 20 40 60 80
0 20 40 60 ESV / BS A [ m l m −2 ]
0 20 40 60 80
0 50 100 150 SV [ m l]
0 20 40 60 80
0 50 100 150 SV [ m l]
0 20 40 60 80
0 20 40 60 80 SV / B S A [ml m −2 ]
0 20 40 60 80
0 20 40 60 80 SV / B S A [ml m −2 ]
0 20 40 60 80
0.4 0.6 0.8 1
Age [years ]
EF [ fr a c ti o n ]
0 20 40 60 80
0.4 0.6 0.8 1
Age [years ]
BMC Medical Imaging 2009, 9:2 http://www.biomedcentral.com/1471-2342/9/2
Page 8 of 10
(page number not for citation purposes) A) Left ventricular mass
The findings regarding left ventricular mass in the present study and its relation to earlier studies has been discussed earlier [14]. Other non-invasive techniques including three dimensional echocardiography [15,16] and compu-terized tomography [17] have overcome many of the shortcomings of two dimensional echocardiography although no reference values for normal patients have been established in a large population.
B) Left ventricular volumes, stroke volume and ejection fractions
Six CMR studies [3-5,7-9] have described overall values of EDV, ESV, SV, and EF, which are consistent with findings from other imaging modalities and are, in the correspond-ing age ranges, broadly consistent with the findcorrespond-ings in this study, with one exception. Sandstede et al used a gradient echo sequence and reported as much as 20–30% lower values for LV mass and volumes. Those authors chose to only measure LV volumes and mass in short axis slices which contained more than 50% of the circumference of
the LV wall in both end-diastole and end-systole. This approach does not take into account the long axis move-ment of the basal parts of the left ventricle [11], which in part may explain the lower values obtained in that study. Hudsmith et al, showed differences between subjects above and below the age of 35 [8], but continuous age-specific values of these parameters, however, have not been described using gradient echo CMR in populations that extend over the breadth of age as in the present study. We show that adult females had a slight progressive decrease in ESV with age, with a resulting slight progres-sive increase in EF, whereas Maceira et al [9], showed the opposite. BMI and blood pressure were similar for both populations, hence it is likely some other factor which contributes to the difference between the studies. The dis-crepancy is difficult to interpret, and one can only specu-late as to what difference between the populations may explain this discrepancy.
The inotropy of the left ventricle has been shown to be related to growth hormone/IGF levels [18]. Although our
Table 3: Intra- and interobserver variability
EDV ESV SV EF LVM
Intraobserver variability
Mean difference ± SD, absolute 0 ± 4 ml -1 ± 10 ml 1 ± 8 ml 1 ± 6% 1 ± 3 g
Mean difference ± SD, relative 1 ± 5% -1 ± 5% 1 ± 6% 1 ± 4% of EF 1 ± 5%
Coefficient of variance 4% 10% 8% 6% 3%
Coefficient of repeatability 8 ml 20 ml 16 ml 12% 6 g
R2 0.96 0.87 0.85 0.47 0.97
Intra-class correlation coefficient 0.99 0.96 0.96 0.81 0.99
Interobserver variability
Mean difference ± SD, absolute 3 ± 4 ml -5 ± 14 ml 8 ± 7 ml 4 ± 6% 1 ± 5 g
Mean difference ± SD, relative 5 ± 6% -2 ± 6% 6 ± 6% 3 ± 4% of EF 2 ± 9%
Coefficient of variance 4% 12% 7% 7% 6%
Coefficient of repeatability 8 ml 28 ml 14 ml 12% 10 g
R2 0.96 0.85 0.82 0.44 0.91
study has not measured growth hormone levels, one might speculate that the higher EDV, SV and EF in younger subjects may possibly, in part, reflect the higher growth hormone levels within this age group. Alterna-tively, these higher values may be due to physical activity rather than hormones. However, we have previously pub-lished that self-reported physical activity increased with age in our population [14]. Thus, it is unclear exactly why these measures are larger in younger subjects.
Reproducibility of measurement
The reproducibility of CMR LV measures obtained in our study was consistent with previously reported studies of intra- and interobserver variability [19-21].
Limitations
Regurgitation in the aortic or mitral valve was only assessed visually in long axis CMR images, and this is a limitation. However, it is likely that this was sufficient to serve the purposes of this study in this population with otherwise unremarkable ECG, medical history and physi-cal examination. The number of included subjects in each gender and decade is less than the minimally suggested n = 10 [21] for the size of a group needed to determine ref-erence values. However, the suggestion of n = 10 is based on the use of the mean +/- 2SD of those subjects' measure-ments as a basis for calculating reference values. In con-trast, we used a curve estimation model and its 95% prediction interval to determine our reference values. Using this method, the robustness of the reference values is based on data from the entire population and less sus-ceptible to small numbers of subjects in individual decade groups. The normal values provided in this study are appropriate for studies undertaken using similar gradient echo sequences at 1.5 T. It has been shown that steady-state free precession based sequences may result in slightly lower LVM and greater LV volumes [7,22,23]. These differ-ences are likely to be systematic in nature and do not alter the physiological significance of the age trends reported in the current study. Furthermore, the use of steady-state free precession based sequences at a field strength of 3 T is cur-rently hampered by artifacts [24]. The presented normal values for gradient echo sequences at 1.5 T may thereby also be of value for assessing results from gradient echo cardiac imaging at 3 T.
Conclusion
This study suggests normal reference values for left ven-tricular mass, dimensions, and function in healthy humans from early adolescence to the eighth decade according to gender using gradient echo CMR at 1.5 T. LV volumes, mass and function vary over a broad age range in healthy individuals. LV volumes and mass both rise in adolescence and decline with age. EF showed a rapid decline in adolescence compared to changes throughout
adulthood. These findings further demonstrate the need for age and gender specific normal ranges for clinical car-diac MR examinations.
Abbreviations
(BSA): body surface area; (CMR): cardiac magnetic reso-nance; (DBP):diastolic blood pressure; (ECG): electrocar-diogram; (EDV):end-diastolic volume; (EF): ejection fraction; (ESV): end-systolic volume; (ICC): intraclass cor-relation coefficient; (LV): left ventricle; (LVM): left ven-tricular mass; (SBP): systolic blood pressure; (SV): stroke volume; (T): Tesla; (TE): time to echo; (TR): time to repe-tition.
Competing interests
The authors declare that they have no competing interests.
Authors' contributions
PC performed data acquisition, data analysis, statistical analysis and drafted the manuscript. RA and AAJ per-formed data acquisition and data analysis, and partici-pated in critically revising the manuscript for important intellectual content. EH performed data acquisition, data analysis, statistical analysis and helped to draft the manu-script. MU performed data acquisition, data analysis, sta-tistical analysis and helped to draft the manuscript. PF conceived of the study, participated in its design and coor-dination, and participated in critically revising the manu-script for important intellectual content. HA conceived of the study, participated in its design and coordination, and helped to draft the manuscript. All authors' read and approved the final manuscript.
Acknowledgements
This work was supported in part by research funding from the Swedish Research Council, Swedish Heart and Lung Foundation, and Lund Univer-sity Faculty of Medicine and the Region of Scania.
References
1. Pennell DJ, Sechtem UP, Higgins CB, Manning WJ, Pohost GM, Rade-makers FE, van Rossum AC, Shaw LJ, Yucel EK: Clinical indications for cardiovascular magnetic resonance (CMR): Consensus Panel report. J Cardiovasc Magn Reson 2004, 6(4):727-765. 2. Hees PS, Fleg JL, Lakatta EG, Shapiro EP: Left ventricular
remod-eling with age in normal men versus women: novel insights using three-dimensional magnetic resonance imaging. Am J Cardiol 2002, 90(11):1231-1236.
3. Lorenz CH, Walker ES, Morgan VL, Klein SS, Graham TP Jr: Normal human right and left ventricular mass, systolic function, and gender differences by cine magnetic resonance imaging. J Cardiovasc Magn Reson 1999, 1(1):7-21.
4. Marcus JT, DeWaal LK, Gotte MJ, Geest RJ van der, Heethaar RM, Van Rossum AC: MRI-derived left ventricular function param-eters and mass in healthy young adults: relation with gender and body size. Int J Card Imaging 1999, 15(5):411-419.
5. Sandstede J, Lipke C, Beer M, Hofmann S, Pabst T, Kenn W, Neu-bauer S, Hahn D: Age- and gender-specific differences in left and right ventricular cardiac function and mass determined by cine magnetic resonance imaging. Eur Radiol 2000, 10(3):438-442.
Publish with BioMed Central and every scientist can read your work free of charge "BioMed Central will be the most significant development for disseminating the results of biomedical researc h in our lifetime."
Sir Paul Nurse, Cancer Research UK
Your research papers will be:
available free of charge to the entire biomedical community
peer reviewed and published immediately upon acceptance
cited in PubMed and archived on PubMed Central
yours — you keep the copyright
Submit your manuscript here:
http://www.biomedcentral.com/info/publishing_adv.asp
BioMedcentral
BMC Medical Imaging 2009, 9:2 http://www.biomedcentral.com/1471-2342/9/2
Page 10 of 10
(page number not for citation purposes) normal left ventricular anatomy in an adult population free
of hypertension. A cardiovascular magnetic resonance study of the Framingham Heart Study Offspring cohort. J Am Coll Cardiol 2002, 39(6):1055-1060.
7. Alfakih K, Plein S, Thiele H, Jones T, Ridgway JP, Sivananthan MU: Normal human left and right ventricular dimensions for MRI as assessed by turbo gradient echo and steady-state free pre-cession imaging sequences. J Magn Reson Imaging 2003, 17(3):323-329.
8. Hudsmith LE, Petersen SE, Francis JM, Robson MD, Neubauer S: Nor-mal human left and right ventricular and left atrial dimen-sions using steady state free precession magnetic resonance imaging. J Cardiovasc Magn Reson 2005, 7(5):775-782.
9. Maceira AM, Prasad SK, Khan M, Pennell DJ: Normalized left ven-tricular systolic and diastolic function by steady state free precession cardiovascular magnetic resonance. J Cardiovasc Magn Reson 2006, 8(3):417-426.
10. 1999 World Health Organization-International Society of Hypertension Guidelines for the Management of Hyperten-sion. Guidelines Subcommittee. J Hypertens 1999, 17(2):151-183.
11. Pennell DJ: Ventricular volume and mass by CMR. J Cardiovasc Magn Reson 2002, 4(4):507-513.
12. Shrout P, Fleiss JL: Intraclass correlations: Uses in assessing rater reliability. Psychological Bulletin 1979:420-428.
13. Mosteller RD: Simplified calculation of body-surface area. N Engl J Med 1987, 317(17):1098.
14. Cain PA, Ahl R, Hedstrom E, Ugander M, Allansdotter-Johnsson A, Friberg P, Marild S, Arheden H: Physiological determinants of the variation in left ventricular mass from early adolescence to late adulthood in healthy subjects. Clin Physiol Funct Imaging
2007, 27(4):255-262.
15. Gopal AS, Keller AM, Shen Z, Sapin PM, Schroeder KM, King DL Jr, King DL: Three-dimensional echocardiography: in vitro and in vivo validation of left ventricular mass and comparison with conventional echocardiographic methods. J Am Coll Cardiol
1994, 24(2):504-513.
16. Gopal AS, Schnellbaecher MJ, Shen Z, Boxt LM, Katz J, King DL: Free-hand three-dimensional echocardiography for determina-tion of left ventricular volume and mass in patients with abnormal ventricles: comparison with magnetic resonance imaging. J Am Soc Echocardiogr 1997, 10(8):853-861.
17. Wachspress JD, Clark NR, Untereker WJ, Kraushaar BT, Kurnik PB: Systolic and diastolic performance in normal human subjects as measured by ultrafast computed tomography. Cathet Car-diovasc Diagn 1988, 15(4):277-283.
18. Bisi G, Podio V, Valetto MR, Broglio F, Bertuccio G, G DER, Boghen MF, Berti F, Muller EE, Ghigo E: Radionuclide angiocardiographic evaluation of the cardiovascular effects of recombinant human IGF-I in normal adults. Eur J Endocrinol 1999, 140(4):322-327.
19. Bottini PB, Carr AA, Prisant LM, Flickinger FW, Allison JD, Gottdi-ener JS: Magnetic resonance imaging compared to echocardi-ography to assess left ventricular mass in the hypertensive patient. Am J Hypertens 1995, 8(3):221-228.
20. Germain P, Roul G, Kastler B, Mossard JM, Bareiss P, Sacrez A: Inter-study variability in left ventricular mass measurement. Com-parison between M-mode echography and MRI. Eur Heart J
1992, 13(8):1011-1019.
21. Bellenger NG, Davies LC, Francis JM, Coats AJ, Pennell DJ: Reduc-tion in sample size for studies of remodeling in heart failure by the use of cardiovascular magnetic resonance. J Cardiovasc Magn Reson 2000, 2(4):271-278.
22. Plein S, Bloomer TN, Ridgway JP, Jones TR, Bainbridge GJ, Sivanan-than MU: Steady-state free precession magnetic resonance imaging of the heart: comparison with segmented k-space gradient-echo imaging. J Magn Reson Imaging 2001, 14(3):230-236.
23. Thiele H, Nagel E, Paetsch I, Schnackenburg B, Bornstedt A, Kouwen-hoven M, Wahl A, Schuler G, Fleck E: Functional cardiac MR imaging with steady-state free precession (SSFP) signifi-cantly improves endocardial border delineation without con-trast agents. J Magn Reson Imaging 2001, 14(4):362-367. 24. Michaely HJ, Nael K, Schoenberg SO, Laub G, Reiser MF, Finn JP,
Ruehm SG: Analysis of cardiac function–comparison between 1.5 Tesla and 3.0 Tesla cardiac cine magnetic resonance
imaging: preliminary experience. Invest Radiol 2006, 41(2):133-140.
Pre-publication history
The pre-publication history for this paper can be accessed here: