www.orientjchem.org
An International Open Free Access, Peer Reviewed Research Journal
2017, Vol. 33, No. (2): Pg. 676-685
Preparation of A MWCNT-Graphite Composite Based on
Sol Gel Method for Dye Removal
MOHAMMAD ALI SHIRGHOLAMI, MOHAMMAD MIRJALILI* and NAvID NASIRIzADEH
Department of Textile and Polymer Engineering, Yazd Branch, Islamic Azad University, Yazd, Iran. *Corrosponding author E-mail: [email protected], [email protected]
http://dx.doi.org/10.13005/ojc/330215
(Received: February 09, 2017; Accepted: April 12, 2017)
ABSTRACT
Carbon based composites have good capability for elimination of colored pollutants. In this work, a multi-walled carbon nanotube-graphite Composite (MW-g-C) was prepared using a sol gel method. The N2 adsorption/desorption curves, scanning electron microscopy and zeta potential were used for characterization of MW-g-C. The adsorption characteristics of MW-g-C were studied using Basic Blue 41 (BB41) dye as an adsorbate. The effects of several influential parameters such as contact time, pH, adsorbent dose and initial concentration on the adsorption were well investigated and optimized. The maximum amount of dye adsorbed in optimal conditions (include pH= 6.8, amount of MW-g-C= 1.37 g L-1) was 115 mg g-1. The linear correlation coefficients and the standard deviations
of Langmuir, Freundlich, Dubinin–Radushkevich (D–R) and Temkin isotherms were determined. The results also showed that the adsorption kinetics was controlled by a pseudo second-order model for adsorption of dye onto MW-g-C. The ∆G°, ∆H° and Ea values indicated that the adsorption of BB41 onto MW-g-C was physisorption.
Keywords: Multiwall Carbon Nanotube, Carbon Composite, sol gel, Dye Adsorbent.
INTRODUCTION
Dyes are colored organic compounds that are applied to impart color to various substrates including paper, leather, fur, hair, drugs, cosmetics, wax, grease, plastics and textile materials1. Dyes
used in the textile industry are the major water pollutants with upsetting environmental impacts2|.
Discharge of untreated dye effluents into nearby aqueous sources causes a damage to aquatic life and poses a serious threat to human health3.
Many different methods are being adopted to treat dye effluents, which include adsorption, biological degradation, advanced oxidation process, and photocatalysis4-9. In this regard, there have been a
search and demand for eco-friendly technologies to remove dyes from wastewater10. Adsorption is an
affordable and effective technique for the removal of dyes and colored pollutants from wastewater11.
Due to their relatively large specific surface area, small size, hollow and layered structure, CNTs have attracted increasing attention as a new type of powerful solid-phase extraction adsorbent16-17. CNTs
have been applied as an effective adsorbent for the removal of organic and inorganic contaminants including methylene blue18, rhodamine B19, Direct
Blue 5320, Reactive Blue 19,21, Bismarck Brown
R22, Congo red5, malachite green23, bismuth, lead,
zinc, and phenol24-25 from water. However, some
disadvantages such as the poor solubility of CNTs and difficulty of collecting them from their dispersing media by tedious centrifugation processes have caused much inconvenience in their practical application16.
Composite materials based on CNTs and inorganic nanomaterials integrate the unique characters and functions of the two types of components and may also exhibit some new properties due to the interaction of the two kinds of materials26, 27. Therefore, these composite materials
have very attractive potential applications in many fields. In the present study, an MWCNT-carbon composite was prepared from MWCNT using a sol gel process. In this way, not only take advantage of high absorption capacity of carbon nanotubes, but simple separation of CNTs from aqueous solution is feasible.
The relationship between dye removal efficiency and four main independent parameters including pH, initial dye concentration, adsorbent dose, and contact time were evaluated by applying the central composite design (CCD).
Experimental Materials
Trimethoxy methylsilane (TMMS), Graphite powder (KS-10), methanol, Ortho Phosphoric acid, sodium Hydroxide and hydrochloric acid was supplied
from Merck (Germany) Company. Multi-walled carbon nanotubes (MWCNT) were purchased from US Research Nanomaterials, Inc. (TX, USA). C.I. Basic Blue 41 (BB41) was purchased from Sigma-Aldrich and used directly without any purification. The structure of this dye is shown in Scheme 1.
Analysis
The morphology and the microstructure of the synthesized adsorbents were characterized by a scanning electron microscope (SEM, MIRA 3, Tescan). The specific surface area of the adsorbents was measured by BET (i.e. Brunauer-Emmett-Teller nitrogen adsorption technique) method at the temperature of 77 K using a Belsorp device (Bel Japan Inc.). The Zeta potential of the synthesized adsorbents was measured by a Malvern zetameter (Zetasizer 2000). Also, the absorbance spectrum was examined by a UV–vis–NIR spectrophotometer (Carry 100).
Preparation of adsorbents
For preparation of MWCNT-graphite composite (MW-g-C), the Sol gel technique was used as follows28. Forty mL of TMMS was mixed with 2.0
mL of a solution containing methanol and water at the volume ratio of 9:1. Then, 40 µL of HCl was added to the mixed solution. The solution was placed in a magnetic mixer to be stirred at a moderate speed for 90 minutes. Several drops of the prepared sol was dropped on a mixed powder containing MWCNT (20.0 mg) and graphite (2.0 g). The resulting paste was mixed gently until a homogeneous mixture was obtained. Then, it was dried at room temperature for an hour. Finally, an absorbent was used for adsorption experiments.
Scheme 1: Molecular structure of Basic Blue 41 dye.
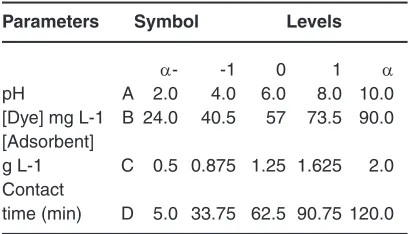
Table 1: Experimental range and levels of the independent variables
Parameters Symbol Levels
a- -1 0 1 a
pH A 2.0 4.0 6.0 8.0 10.0 [Dye] mg L-1 B 24.0 40.5 57 73.5 90.0 [Adsorbent]
g L-1 C 0.5 0.875 1.25 1.625 2.0 Contact
Adsorption experiments
The batch adsorption studies were carried out in a series of Erlenmeyer flasks containing 100 mL of a BB41 solution. The experiments were conducted by varying the solution pH, the adsorbent dose, the initial BB41 concentration and the contact time
based on CCD (See the supplementary information data file). The levels of the selected variables are presented in Table 1. Briefly, in optimum conditions, an accurately weighed adsorbent (0.137 g) was added to 100 mL of the BB41 solution (60 mg L-1)
containing a 10 mL buffer phosphate solution with the
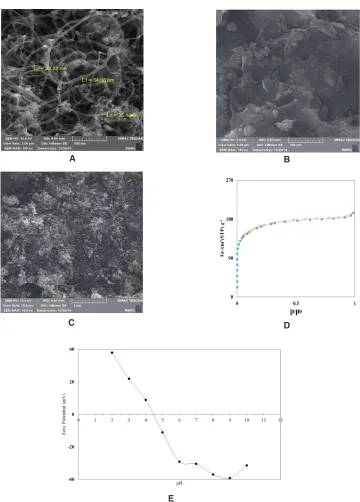
Fig. 1: SEM images of A) MWCNT, B) carbon composite, C) MW-g-C, D) N2 adsorption– desorption isotherms plots and E) zeta potential of MW-g-C.
A B
C
E
pH of 6.0. The mixture was then stirred on a magnetic stirrer at 200 rpm for 87 minutes. Finally, the sample solution was immediately filtrated, and the absorption of the effluent solution was determined by a UV–Vis spectrophotometer. The dye adsorption percentage (Ad %) and the amount of BB41 adsorbed onto the MW-g-C (qe, mg g-1) were calculated by:
Ad (%) = ((C0-Ce ))/C0 ×100 ...(1) qe = (C0 - Ce) × V/m ...(2) where qe (mg g-1) is the adsorption capacity
of the adsorbent, C0 (mg L-1) and C
e (mg L-1) are
the initial and the final concentrations of BB41 respectively, V (L) is the solution volume, and m (g) is the adsorbent mass. The adsorption kinetics of BB41 onto the MW-g-C was determined at pH 6.0 under a stirring rate of 200 rpm at 25 °C to 45 °C.
To establish dependence between BB41 dye concentrations in solid and liquid phases at a constant temperature (25 °C), namely to depict the adsorption isotherms, the initial dye concentration was varied within the range of 50-200 mg L-1 while
the adsorbent mass was constant (0.137 g), and the same batch method was used.
An investigation of the adsorption kinetics was conducted at 25 °C using 6.0 mg of the dye solved in 100 mL of distilled water and 0.137 g of the adsorbent. At predetermined time intervals, approximately 5.0 mL of the dye solution was sampled, analyzed by a UV–Vis spectrophotometer for the residual dye concentration (Ct), and returned into the flask. This was repeated until an equilibrium was reached. The adsorption capacity at time t (qt) was calculated according to Eq. (2), where, instead of the equilibrium, the residual concentration of the dye (Ct) was used. All the equilibrium and kinetic adsorption experiments were repeated for at least three times to ensure the accuracy of the obtained data.
RESULTS AND DISCUSSIONS
Characterization of MW-g-C
Figure 1 (a-c) depicts the SEM images for MWCNT, carbon composite and MW-g-C respectively. In the SEM images, a porous structure can be seen
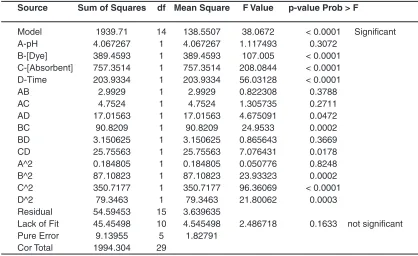
Table 2: ANOvA for BB41 removal efficiency (%)
Source Sum of Squares df Mean Square F value p-value Prob > F
Model 1939.71 14 138.5507 38.0672 < 0.0001 Significant
A-pH 4.067267 1 4.067267 1.117493 0.3072
B-[Dye] 389.4593 1 389.4593 107.005 < 0.0001 C-[Absorbent] 757.3514 1 757.3514 208.0844 < 0.0001 D-Time 203.9334 1 203.9334 56.03128 < 0.0001
AB 2.9929 1 2.9929 0.822308 0.3788
AC 4.7524 1 4.7524 1.305735 0.2711
AD 17.01563 1 17.01563 4.675091 0.0472
BC 90.8209 1 90.8209 24.9533 0.0002
BD 3.150625 1 3.150625 0.865643 0.3669
CD 25.75563 1 25.75563 7.076431 0.0178
A^2 0.184805 1 0.184805 0.050776 0.8248
B^2 87.10823 1 87.10823 23.93323 0.0002
C^2 350.7177 1 350.7177 96.36069 < 0.0001
D^2 79.3463 1 79.3463 21.80062 0.0003
Residual 54.59453 15 3.639635
Lack of Fit 45.45498 10 4.545498 2.486718 0.1633 not significant Pure Error 9.13955 5 1.82791
at both surface composites, which may be suitable for the absorption of organic species. After combining with MWCNTs, they were uniformly loaded on the network structure of the carbon composite with a high density. MWCNTs were randomly aligned with a diameter of approximately 30–55 nm and a length of several micrometers.
N2 adsorption–desorption isotherms were employed to investigate the surface area and the pore structure of MW-g-C. According to Figure 1d, the BET surface area was 603 m2 g-1, the pore
volume was 0.301 cm3 g-1, and the pore size was 1.99
nm. These were calculated by the Barrett-Joyner-Halenda (BJH) analysis.
Zeta potential of MW-g-C was measured at various pH levels, as shown in Figure 1e. The pHPZC (i.e. pH of zero point charge) of MW-g-C was about 4.5. As observed, when the solution pH values was below 4.5, the zeta potentials of the adsorbent were positive and, therefore, BB41 (as a cationic dye with N+) and the surface of the MW-g-C were
electrostatically repulsed in the range of 2.0-5.0. The low pHPZC indicates that MW-g-C was negatively charged at basic pH (i.e. pH = 7.0–10.0).
Statistical analysis
The experimental design matrix, the experimental results, and the predicted dye removal efficiency are presented in Table S2. The final model is expressed by equation (3):
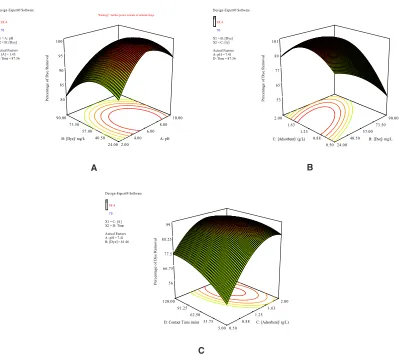
Fig. 2: Three-dimensional response surface plots for interactive effect of operational parameters on the dye removal % of BB41.
Design-Expert® Software R
98.4
70
X1 = A: pH X2 = B: [Dye] Actual Factors C: [A] = 1.43 D: Time = 87.36
2.00 4.00 6.00 8.00 10.00 24.00 40.50 57.00 73.50 90.00 80 85 90 95 100
Percentage of Dye Removal
A: pH B: [Dye]/ mg/L
Warning! Surface points outside of selected range
A
Design-Expert® Software R
98.4
70
X1 = C: [A] X2 = D: Time Actual Factors A: pH = 7.41 B: [Dye] = 61.46
0.50 0.88 1.25 1.63 2.00 5.00 33.75 62.50 91.25 120.00 56 66.75 77.5 88.25 99
Percentage of Dye Removal
C: [Adsorbent]/ (g/L) D: Contact Time (min)
C
Design-Expert® Software R
98.4
70
X1 = B: [Dye] X2 = C: [A] Actual Factors A: pH = 7.41 D: Time = 87.36
24.00 40.50 57.00 73.50 90.00 0.50 0.88 1.25 1.63 2.00 53 65 77 89 101
Percentage of Dye Removal
B: [Dye]/ mg/L C: [Adsorbent]/ (g/L)
Dye Removal Effeciency (%) = +19.18+3.22 *pH+0.04 *[Dye]+68.31 *[Adsorbent]+0.56 *Contact Time-0.01 *pH *[Dye] -0.72 *pH * [Adsorbent]-0.017 *pH *Contact Time+0.38 *[Dye] *[Adsorbent]+0.009 *[Dye] *Contact Time-0.11 *[Adsorbent] *Contact Time -0.02 *pH2 -0.006 *[Dye]2-25.42 *[Adsorbent]2 -0.002 *Contact Time2 ...(3)
Table 2 shows the variance analysis of the regression parameters of the predicted response surface quadratic model for dye removal. Based on the table, the model F-value of 38.06 indicates that the model is significant for dye removal, and the p-values of 0.05 suggests that the model is significant at the probability level of 95%. The model gave the determination coefficient (R2) of 0.9726 and the adjusted R2 value of 0.9471 for dye
removal. The ANOVA results show that the dye initial concentration, the adsorbent dosage and the contact time are significant factors that have an effect on dye removal. The coefficients in the interaction are also significant in terms of the dye initial concentration, the adsorbent dosage, the adsorbent dosage squared, the dye initial concentration squared, and the contact time squared. The lack-of-fit was also calculated from the experimental error (pure error) and the residuals. The F-value of 2.49 belonging to the lack-of-fit implies the significance of the model in terms of the correlation between the variables and the process response for dye removal.
The parity plot for the experimental and predicted value of the BB41 removal efficiency (%) is demonstrated in Figure S1. In addition, the normal probability and the residuals versus the fitted value plots for the BB41 removal efficiency are illustrated in Figure S2. Drawing normal probability plots is a suitable graphical method for judging the normality of residuals29, 30.
As it is seen in Figure S2 (a), the normality assumption was relatively satisfactory as the points in the plot formed a fairly straight line. The reliability of the model was also examined with the plot of residuals versus the fits in Figure S2 (b). As the figure shows, the number of the increasing points was significantly close to that of the decreasing points, the patterns of the increase of residuals and the increase of fits were similar, and the positive and negative residuals were scattered in the same range.
As a result, Figure S2 shows that the model is adequate to describe the BB41 removal efficiency of MW-g-C by the response surface method.
Response surface plotting for evaluation of operational parameters
The simultaneous effects of interactive parameters on the removal efficiency of BB41 are shown in Figure 2. For a better explanation of the independent variables and their interactive effects on the dye removal, 3D plots and the corresponding contour plots are represented in Figure 2. As it can be seen in Figure 2a, at a constant dose of the adsorbent (1.43 g L-1) and at a certain contact time
(87 minutes), when the initial dye concentration of
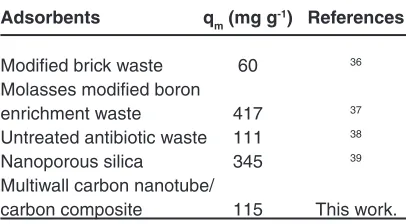
Table 4: Comparison of the adsorption capacity of BB 41 onto various adsorbents
Adsorbents qm (mg g-1) References
Modified brick waste 60 36
Molasses modified boron
enrichment waste 417 37
Untreated antibiotic waste 111 38
Nanoporous silica 345 39
Multiwall carbon nanotube/
carbon composite 115 This work.
Table 3: Equilibrium parameters for the adsorption of BB41 onto MW-g-C
Isotherm Equations Parameters
Langmuir qmax 123.4
KL 8.103 R2 0.9741
Freundlich KF 206.91
1/n 0.568 R2 0.9923
D–R qmax 60.15
 0.0003 E (kj/mol) 142.58 R2 0.9727
Temkin KT 11.22
BB41 was increased up to 50 mg/L, the dye removal efficiency increased, and then it decreased. This can be accounted for by the fact that an increase in the initial concentration of the BB41 dye leads to an increase in the probability of the contact between the dye molecules and the adsorbent surface. The finding is in agreement with literature reports where higher concentrations of pollutants would result in higher initial concentration efficiency31, 32. On the other hand,
the adsorption percentage was decreased by an increment of the BB41 concentration at the range of 50 – 90 mg L-1. It was concluded that the active
sites on the adsorbent surface were insufficient to adsorb a higher concentration of BB41.
According to Figure 2a, the adsorption percentage of MW-g-C increased when the pH rose from 2.0 (80 %) to 6.8 (97 %), and then the adsorption decreased to 91 % by further rise of the pH to 10.0. This can be explained by the point that the solution pH affects the solution chemistry of BB41 and the activity of the functional groups of the adsorbent.
An isoelectric point for MW-g-C is obtained around pH of 4.5 (Figure 1D). At a low pH value (pH < pHpzc=4.5), the adsorbent surface takes up a positive charge and, thus, the interaction between BB41 (i.e. a cationic dye with a positive charge on N atom) and the surface of MW-g-C is electrostatically repulsive. A decrease of the solution pH increases the repulsive force between BB41 and the surface of MW-g-C and, thus, hinders the transport of BB41 from the bulk solution to the surface of the adsorbent for adsorption to take place. This would explain the decrease of the adsorption capacities with a decrease of the solution pH at a pH level below 6.0, as observed in Figure 2a.
In contrast, the surface of MW-g-C may get negatively charged at a solution pH higher than pHPZC. Accordingly, the electrostatic attraction occurs between the negatively charged active adsorption sites and the cationic dye molecules, which is a benefit for the adsorption of dye33. The maximum
BB41 adsorption was attained for MW-g-C at the initial pH of 6.8. Moreover, the adsorption capacity
Table 5. Constants and correlation coefficients for the kinetic models
Kinetic Model Pseudo-First-order Pseudo-second-order intraparticle diffusion equation
Equations
Dye K1 (min-1) q
e R2 K2 qe R2 Kp C R2
Conc. (min-1)
(mg L-1)
50 0.1 12.27 0.9834 0.0253 39.37 0.9997 0.5112 33.487 0.612 80 0.071 12.26 0.9175 0.0204 47.84 0.9998 0.6315 40.54 0.630 100 0.048 13.51 0.96.3 0.0056 55.86 0.9999 0.9377 49.941 0.8193 130 0.041 15.44 0.8869 0.0034 65.35 0.999 1.2878 40.017 0.6557 150 0.018 15.41 0.9746 0.0029 71.42 0.999 0.8844 56.416 0.8928 180 0.019 18.25 0.9608 0.0018 81.30 0.9991 1.1925 59.412 0.9657 200 0.011 19.23 0.974 0.0015 82.20 0.9995 1.1792 65.185 0.9229
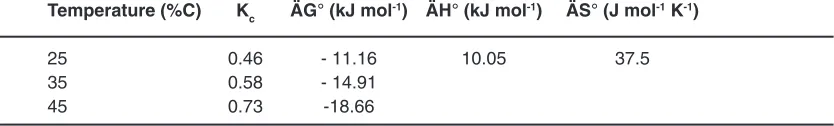
Table 6: Thermodynamic parameters for the adsorption of BB41 on MW-g-C
Temperature (%C) Kc ÄG° (kJ mol-1) ÄH° (kJ mol-1) ÄS° (J mol-1 K-1)
25 0.46 - 11.16 10.05 37.5
35 0.58 - 14.91
for BB41 decreased when the pH increased from 7 to 10.
The effect of the initial dye concentrations and the varying adsorbent doses on the removal of the dye is shown in Figure 2b. The removal of BB41 increased with an increase in the adsorbent from 0.5 to 1.37 g L-1, whereas the independency
was decreased with an increase in the initial dye concentration. This may be explained by the fact that an increase of the adsorbent dosage provides a greater surface area and makes more dye binding sites available; hence, the rate of dye sorption increased even when the initial dye concentration remained constant. On the other hand, it has been postulated that a greater adsorbent dose could create a screening effect, hindering the attachment of ions on the binding sites on the dense layer of the cells30, 32, 34.
Figure 2c shows the interactive effect of the contact time and the adsorbent dose on the dye removal process. According to the figure, the removal efficiency of BB41 increased when the contact time increased from 5.0 to 90.0 minutes and then reached a steady level. Under our experimental conditions, 98 % of dye adsorption was attained by MW-g-C in the state of equilibrium within 90.0 minutes. This occurs due to the fact that, in the initial stages of adsorption, a great number of blank areas exist on the surface of the adsorbent; however, as the time passes, these areas are occupied by BB41 molecules, and the adsorption efficiency remains constant or decreases after the equilibrium. From Figure 2c, we can see that the effect of the adsorbent dose was similar to that in Figure 2b. With adsorbent doses in the range of 0.5–1.37 g L-1, the adsorption capacity increased
with an increase of the adsorbent dosage.
Process optimization
In order to determine the optimum conditions by the adsorption process, the desired aim in terms of BB41 removal was defined as to attain an efficiency rate of 99.5%. A pH of 6.8, an adsorbent dose of 1.37 g L-1, an initial dye concentration of 60.0
mg L-1 and a contact time duration of 87 min were
found to be the optimum conditions by the model. These conditions were repeated three times, and dye removal efficiencies of 97.4, 98.2, and 99.1% resulted. The average dye removal efficiency of
98.23% was found close to the model prediction of 99.5%. According to the results, increase of pH and contact time and decrease of initial dye concentration could lead to improved dye removal efficiency. This finding is in good agreement with that of previous studies31, 33-34.
Isotherm studies
L a n g m u i r, Fr e u n d l i c h, D u b i n i n –
Radushkevich (D–R) and Temkin models were employed for the adsorption isotherm modeling of the experimental data. The isotherm parameters, units and definitions of these applied models are provided in Table 3. Figure S3 illustrates the experimental data that fit different isotherm models.
The correlation coefficients (R2 > 0.992)
showed that the Freundlich model results in better fitting (i.e. closer prediction of the isotherm to the experimental data). The qmax at 25 °C was 115 mg g-1 for MW-g-C. Furthermore, the dye uptake was
influenced by the initial dye concentration (with a constant adsorbent dosage). The equilibrium is intense and continues rapidly at low initial dye concentrations. So, there is a possibility for the monolayer coverage of dye molecules at the outer interface of adsorbents. With an increase in the initial dye concentrations, the available adsorption sites become fewer and, subsequently, the adsorption depends on the initial dye concentration35.
In comparison with the adsorption capacities of other adsorbents for BB41 (Table 4), the adsorption capacity of MW-g-C was found to be better than the most other adsorbents reported in the literature36-39.
The higher capacity of MW-g-C is due to the high specific surface area and many pores on adsorbent for dye removal from solution.
Kinetic studies
In order to determine how the process of adsorption of BB41 onto MW-g-C composites takes place, Lagergren’s pseudo first-order and Ho’s pseudo second-order models were firstly applied to fit experimental data. The corresponding parameters and correlation coefficients, R2, of these kinetic
As it can be seen in Table 5, with an increase of the concentration from 50 to 200 mg L-1 at 25 °C, the rate constant of the pseudo first-order, K1, decreased from 0.1 to 0.011 min”1, and the pseudo second-order, K2, decreased from 0.0253 to 0.0015 g mg-1 min-1. The values of q1e and q2e, however, increased rapidly. The correlation coefficients (R21) for the Lagergren equation were not very high; that is, between 0.9175 and 0.9834.
Figure S4 shows the plots of the linearized form of the pseudo second-order kinetic model for the adsorption of BB41 on MW-g-C. The correlation coefficients were much greater in this case, i.e. in the range of 0.999–0.9999, confirming a very good agreement with experimental data. The value of the equilibrium adsorption capacity was found to be close to the value of the experimental adsorption capacity for all the initial dye concentration of 50-200 mg L-1. The correlation coefficients (R2) for the
intra-particle diffusion model were between 0.612 and 0.9657, which were lower than those of the pseudo second-order model.
Adsorption thermodynamics
The thermodynamic parameters such as Gibbs free energy change ∆G°, standard enthalpy
∆H°, and standard entropy ∆S° were also studied for a better understanding of how temperature affects the adsorption of BB41 on the prepared composite. Some experiments were performed using 100 mg/L of dye solutions at various temperatures for six hours. Using the equilibrium constant (Kc), the Gibbs free energy of adsorption, ∆G°, was calculated from the following equation:
...(4) The standard enthalpy, ÄH°, and the standard entropy, ÄS°, of the adsorption can be estimated from Vant Hoff equation:
...(5) The Kc value is calculated from the equation9
...(6) where Kc is the adsorption equilibrium
constant, CAE is the amount of the BB41 dye (mg) adsorbed on the adsorbent (MW-g-C) per L of the solution at equilibrium, And CSE is the equilibrium concentration (mg L-1) of the BB41 dye in the
solution.
The obtained thermodynamic parameters are given in Table 6. Kc indicates the capability of MW-g-C to retain a solute as well as the extent of its movement in a solution phase40. As shown in Table
6, Kc increases with an increase of the temperature from 25 to 45 °C. The negative values of ∆G° at different temperatures indicate the feasibility of the process and the spontaneous nature of the adsorption. Generally, the change in the adsorption enthalpy for physisorption is in the range of -20 to 40 kJ mol-1, but chemisorption is between - 400 and - 80
kJ mol-13 Positive ∆H° (10.05 kJ mol-1) implies that
the adsorption is endothermic and physical in nature. Furthermore, the slightly positive ∆S° of the BB41 adsorption process indicates an irregular increase of randomness at the MW-g-C solution interface during the adsorption.
CONCLUSIONS
An MWCNT- graphite composite (MW-g-C) was synthesized using the sol gel method. The prepared composite exhibited a homogeneous dispersion of CNTs in the matrix. This study was an investigation of the removal of Basic Blue 41 (BB41, a cationic dye) from aqueous solutions using MW-g-C absorbent composites. The dye quantity adsorbed per unit of adsorbent mass increased with an increase of the initial dye, adsorbent concentrations and time. The prepared composite showed a high BET surface area (603 m2 g-1), the pore volume of
0.301 cm3 g-1 and the pore size of 1.99 nm. The
adsorption kinetics of BB41 onto MW-g-C was controlled by the pseudo second-order model. The equilibrium adsorption data fitted to the Freundlich isotherm. The thermodynamics of the adsorption process revealed that it was an endothermic, spontaneous and physisorption process.
ACKNOWLEDGEMENTS
REFERENCES
1. Sivashankar, R.; Sathya, A. B.; Vasantharaj, K.; Sivasubramanian, V. Environ. Nanotech.
Monit. Manag. 2014, 2, 36–49.
2. Jagadish, K.; Chandrashekar, B. N.; Byrappa, K.; Rangappa, K. S.; Srikantaswamy, S. Anal.
Methods 2016, 8, 2408-2415.
3. Sadegh, H.; Zare, K. J. Mol. Liq.2016, 215, 221-228.
4. Anandhavelu, S.; Thambidurai, S. Color. Tech.
2013, 129, 187–192.
5. Gan, N.; Zhang, J. Materials2014, 7, 6028-6044.
6. Araghi, M. S.; Olya, M. E.; Marandi, R.; Siadat, S. D. Appl. Biolog. Chem. 2016, 59, 463-470.
7. Wang, Y.; Zhao, H. J. Phys. Chem. C2012,
116, 7457–7463.
8. Radi, A.; Nasirizadeh, N.; Rohani-Moghadam, M.; Dehghani, M. Ultrason. Sonochem. 2015,
27, 609-615.
9. Ajmal, A.; Majeed, I.; Malik, R. N.; Idrissc, H.; Nadeem, M. A. RSC Adv. 2014, 4, 37003-37026.
10. Santos, D. C.; Adebayo, M. A. J. Braz. Chem. Soc. 2015, 26, 924-938.
11. Patil, M. R.; Shrivastav, V. S. J. Mater. Environ. Sci. 2015, 6, 11-21.
12. Yusuf, M.; Elfgh,i F. M. RSC Adv. 2015, 5,
50392-50420.
13. Gao, J.; Si, C.; He, Y. Desalin. Water Treat.
2015, 53, 2266-2277.
14. Adegoke, K. A.; Bello, O. S. Water. Res. Ind.
2015, 12, 8–24.
15. Du, P. Y.; Li, H.; Fu, X.; Gu, W.; Liu, X. Dalton.
Trans. 2015, 44, 13752-13759.
16. Hamidi Malayeri, F.; Sohrabi, M. R.; Ghourchian, H. Int. J. Nanosci. Nanotechnol.
2012, 8, 79-86.
17. Selen, V.; Guler, O.; Ozer, D.; Evin, E. Desalin.
Water Treat. 2016, 57, 8826-8838.
18. Xie, Y.; He, C. RSC Adv. 2015, 5, 82503-82512.
19. Kumar, S.; Bhanjana, G., J. Nanosci.
Nanotechnol. 2014, 14, 4331-4336.
20. Prola, L. D.; Machado, F. M. J. Environ.
Manage. 2013, 130, 166-75.
21. Karimifard, S.; Alavi Moghaddam, M. R.
Desalin. Water Treat. 2016, 57,
16643-16652.
22. Yang, S.; Wang, L., Chem. Eng. J. 2015, 275, 315-321.
23. Sadegh, H.; Shahryari-ghoshekandi, R. J. Mol. Liq. 2015, 206, 151-158.
24. Al-Saidi, H. M.; Abdel-Fadeel, M. A.; El-Sonbati, A. Z.; El-Bindary, A. A. J. Mol. Liq.
2016, 216, 693-698.
25. Jiang, L.; Li, S. Appl. Surf. Sci. 2016, 369, 398-413.
26. Bahgat, M.; Farghali, A. A. Appl. Nanosci.
2013, 3, 251–261.
27. Peng, X.; Chen, J.; Misewich, J. A.; Wong, S.
S. Chem. Soc. Rev. 2009, 38, 1076–1098.
28. Nasirizadeh, N.; Dehghani, M.; Yazdanshenas, M. E. J. Sol-Gel Sci. Techn.2015, 73, 14-21. 29. Eatemadifar, A.; Dehghanizadeh, H.;
Nasirizadeh, N.; Rohani Moghadam, M. Fiber
Polym. 2014, 15, 254-260.
30. Radaei, E.; Alavi Moghaddam, M. R.; Arami,
M. J. Environ. Health. Sci. Eng. 2014, 12,
65-72.
31. Pirkarami, A.; Olya, M. E.; Najafi, F. J. Ind. Eng. Chem. 2015, 21, 387-395.
32. Roosta, M.; Ghaedi, M. Ultrasonic. Sonochem.
2014, 21, 1441–1450.
33. Ai, L.; Zhang, C. J. Hazard. Mat. 2011, 198, 282– 290
34. Toor, M.; Jin, B. Chem. Eng. J. 2012, 187, 79– 88.
35. Travlou, N. A.; Kyzas, G. Z.; Lazaridis, N. K.; Deliyanni, E. A. Chem. Eng. J. 2013, 217, 256–265.
36. Kooli, F.; Yan, L.; Al-Faze, R.; Al-Sehimi, A.
Arabian J. Chem. 2015, 8, 333-342.
37. Gupta, V. K.; Agarwal, S.; Olgun, A.; Demir, H. I.; Yola, M. L.; Atar, N. J. Ind. Eng. Chem.
2016, 34, 244-249.
38. Yeddou-Mezenner, N. Desalination2010, 262, 251–259.
39. Zarezadeh-Mehrizi, M.; Badiei, A. Water Res. Ind.2014, 5, 49-57.
40. Lian, L.; Guo, L.; Guo, C. J. Hazard. Mater.