1178
Evaluation Of Slack Based Efficiency Of A
Decision Making Unit
B. Venkateswarlu, B. Mahaboob, C. Narayana, C. Subbarami Reddy
Abstract: Data Envelopment Analysis has manifested itself as an outstanding data-oriented performance evaluation method when multiple outputs and inputs appear in a set of peer Decision Making Units (DMUs).This research article primarily focuses on the estimation of slack based measure of efficiency of a DMU. In terms of Shepard‘s distance functions, Farrell Efficiency (FE), Output Pure Technical Efficiency (OPTE), Output Overall Technical Efficiency (OOTE) and Output Scale Efficiency (OSE) has been proposed here. A Fractional Programming Problem (FPP) has been evaluated in order to compute the slack based measure of efficiency of a DMU and the definition of output distance function and its properties are also presented. Furthermore this paper proposes a slack based efficiency measurement problem as a fractional programming problem which is transformed into a linear programming problem.
Index Terms: Decision Making Unit (DMU), Output pure Technical efficiency (OPTE), Out Overall Technical efficiency (OOTE), Out Put Scale Efficiency (OSE), Slack based efficiency, Technical Efficiency(TE), Technical Efficiency Scores(TESs),Weighted Per Capita(WPC),Overall Performance (OP)
—————————— ——————————
1. INTRODUCTION
H. Golshani et.al, in 2019[1],suggested a slack-based network model of super efficiency considering the optimal value of intermediate measures in the objective function and right-hand set for ranking overall efficient DMUs to have more accurate and comprehensive ranking DMUs with internal structures. Kristina Kocisova et.al,[2] in 2018,in their research article examined the relative efficiency of agriculture in the European Union using DEA for the period 2005-2015.Tessa Vaxina Soetanto et.al [3] examined the efficiency of Indonesian manufacturing industry listed in the Indonesian stock Exchange during the period of 2010-2014 using non-parametric output oriented super slack-based model. Barbara A. Mark. et.al [4] estimated the technical efficiency of general medical, general surgical and combined medical-surgical nursing units and to incorporate into the DEA model several relevant indicators of patient safety and quality. S Nuti et.al [5] looked into the connections among technical efficiency scores, weighted per capita cost and overall performance. Gahe Zing Samuel Yank et.al [6] applied DEA to compute technical assessment in banking sectors. There are two types of models in DEA: radial and non-radial. Radial models are represented by the CCR (Charnes-Cooper-Rhodes) model. Basically they deal with propositional changes of inputs or outputs. On the other hand non-radial models, e.g. the black based measure of efficiency model, handle input or output slacks directly and do not assume propositional changes of inputs or outputs. On the other hand non-radial models, e.g. the black based measure of efficiency model, handle input or output slacks directly and do not assume propositional changes of inputs or outputs. The input distance function can be parametrically postulated and estimated. A second order approximation by Taylor‘s series of an arbitrary input distance function is as follows.
0
1 1
ln , ln ln
m s
i i i k r
i r
D u x x u
1 1
1
ln ln
2
m m
i k i k
i k
x x
1 1 1 1
1
ln ln ln ln
2
s s m s
r p r p i r i r
r p i r
u u x u
We have,
(i)Di
u x,
1, lnDi
u x,
0(ii) Di
u x,
is linear homogeneous in inputs. (iii) Di
u x,
Increases monotonically in inputs
0 ,
k i
x x u D
, where k= 1, 2 … s
The input distance function in translog form can be estimated by linear programming.
(i)
0
1 1 1 1
1
ln ln ln ln
2
m s m m
i i j r r j i k i j k j
i r i k
x u x x
1 1 1 1
1
ln ln ln ln 0
2
s s m s
r p r j p i r i j r j
r p i r
u u x u
(ii) Linear Homogeneity conditions
1 1
m
i i
1k 2k ....m k 0w h e r e k r u n s o v e r
1, 2 ....m
i1 i2 ...im 0 w h e r e i r u n s o v e r
1, 2 ...m
(iii) Conditions of symmetry:i k k i, i k ,r p p r
p r
Objective Function:
0
1 1 1 1
1
ln ln ln ln
2
m s m m
i i r r i k i k
i r i k
x u x x
1 1 1 1
1
ln ln ln ln
2
s s m s
r p r p i r i r
r p i r
u u x u
————————————————
B. Venkateswarlu, Department of Mathematics, Vellore institute of Technology, Vellore, Tamilnadu, Email id: [email protected]
B. Mahaboob, Department of Mathematics, Koneru Lakshmaih Education Foundation, Vaddeswaram, Guntur, Andhra Pradesh. Email id: [email protected]
C. Narayana, Department of Mathematics, Sri Harsha institute of P.G Studies, Nellore, Andhra Pradesh. Email id: [email protected].
1179 IJSTR©2019
www.ijstr.org The objective function is minimized with respect to the unknown parameters subject to the constraints (i), (ii) and (iii)
2
.O
UTPUT DISTANCE FUNCTION:
Shephard‘s output distance function D0(x0, u0) is related to the
output level sets p(x) [1].P(x0) = {u: u can be produced by x0}.
The input and output level sets are dualistically related.
10 0, 0 : 0 0
D x u M a x u p x
F0
x0,u0
1
(i) Shephard‘s output distance function is inversely related to Farrell‘s output measure of technical efficiency.
1
0 0 0 0 0
1
0 0
1
0 0
1 1
0 0 0
0 0 0 0 0 0
, : ( )
: ( )
: ( )
,
, ,
D x u M a x u p x
M a x u p x
M a x u p x
D x u
D x u D x u
(iii) 0 D0
x0,u0
1In one output and multi-inputs setting, the output distance function takes the form:
0 0, 0
( )
u
D x u
x
and u0R1, x0Rm
The output level sets induced by the distance function may be expressed as,
:
u
1
:
p
x
u
u
x
u
x
If the frontier production function is Cobb-Douglas, the output sets are
1
: i
m
i i
p x u r x u
For translog production frontier,
0
1 1 1
1
: ln ln ln
2
m m m
i i ik i k
i i k
p x u x x x u
In terms of piece-wise linear technology,
10 0 0
0 1
0 1
,
, 1, 2 , ...,
, 1, 2 , ...,
0
n
j i j i j
n
j r j r j
j
D x u M a x
s u b j e c t t o
x x i m
u u r s
a n d
This problem implicitly assumes scale efficiency. To account for variable returns to scale, we can append the constraint,
1
1
n
j j
, to the above linear programming problem
Fig (1)
P (xo) is output level set. The producer who operates at E is inefficient. He can attain technical efficiency by radial magnification of his output from E to F.
0 0, 0
O F
F x u
O E
and0 F0
x0,u0
1.Where F0
x0,u0
Farrell‘s output measure of technicalMaximum potential revenue can be estimated solving the following optimization problem.
: ( 0)
,
M a x r u u p x
R x r
u
Where r Rs is the vector of output prices. With respect to piecewise linear technology, this problem may be expressed as follows:
0 1
1 ,
, 1 , 2 , ...,
, 1 , 2 , ...,
n
j i j i j
n
j r j r j
M a x r u
R x r
u
s u b j e c t t o
x x i m
u u r s
Where xi0are the observed inputs of DMU0,urvalues have to be determined by optimizing the problem.
Revenue efficiency: 0
0
( , )
R x r
R E
r u
where the denominator
stands for realized revenue. In terms of fig (1),R E O G O E
.
Maximum revenue occurs at C, which belongs to the iso-product curve. Revenue efficiency can be decomposed into the product of output technical efficiency and output allocative efficiency.
3.
PURE
OUTPUT
TECHNICAL
EFFICIENCY
A B C
H
F G
E
0
H
D
p(x0)
u1F
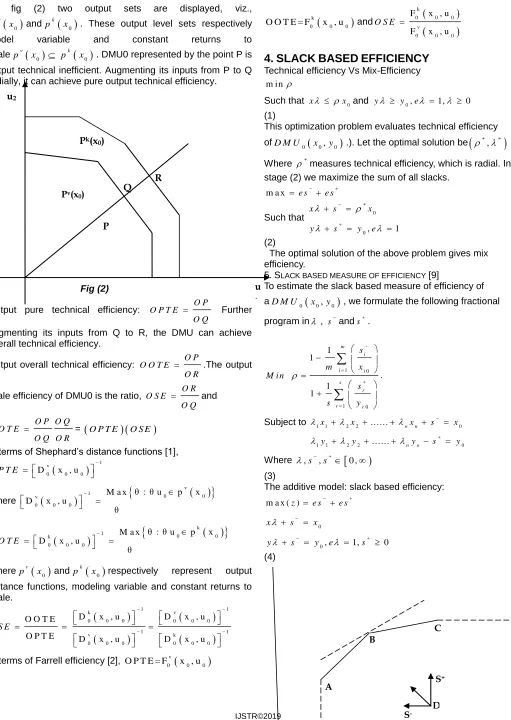
1180 In fig (2) two output sets are displayed, viz.,
0 vp x andpk
x0 . These output level sets respectivelymodel variable and constant returns to
scalepv
x0 pk
x0 . DMU0 represented by the point P is output technical inefficient. Augmenting its inputs from P to Q radially, it can achieve pure output technical efficiency.Fig (2)
Output pure technical efficiency: O P T E O P O Q
Further
augmenting its inputs from Q to R, the DMU can achieve overall technical efficiency.
Output overall technical efficiency: O O T E O P O R
.The output
scale efficiency of DMU0 is the ratio, O S E O R O Q
and
O P O Q O O T E
O Q O R
=
O P T E
O S E
In terms of Shephard‘s distance functions [1],
1v
0 0 0
D x , u
O P T E
Where
v
1 0 0
v
0 0 0
θ : θ u p x
M a x
D x , u
θ
k
1 0 0
k
0 0 0
θ : θ u p x
M a x
D x , u
θ
O O T E
Wherepv
x0 andpk
x0 respectively represent output distance functions, modeling variable and constant returns to scale.
1 1
k v
0 0 0 0 0 0
1 1
v k
0 0 0 0 0 0
D x , u D x , u
O O T E
O P T E D x , u D x , u
O S E
In terms of Farrell efficiency [2], O P T E = F0v
x , u0 0
k
0 0 0
O O T E = F x , u and
k
0 0 0
v
0 0 0
F x , u
F x , u
O S E
4.
SLACK
BASED
EFFICIENCY
Technical efficiency Vs Mix-Efficiency m in
Such that x x0and y y0,e 1, 0 (1)
This optimization problem evaluates technical efficiency
ofD M U0
x0,y0
.). Let the optimal solution be
,
.Where measures technical efficiency, which is radial. In stage (2) we maximize the sum of all slacks.
m a x e s e s
Such that 0
0, 1
x s x
y s y e
(2)
The optimal solution of the above problem gives mix efficiency.
5.SLACK BASED MEASURE OF EFFICIENCY [9]
To estimate the slack based measure of efficiency of
aD M U0
x0,y0
, we formulate the following fractionalprogram in , sands.
1 0
1 0
1 1
1 1
m i
i i
s r
r r
s
m x
M i n
s
s y
.
Subject to 1x1 2x2 ... nxn s x0
1y1 2y2 ... nyn s y0
Where ,s,s
0 ,
(3)The additive model: slack based efficiency:
0
0 m a x ( )
, 1, 0
z e s e s
x s x
y s y e s
(4)
P
Q R
Pk(x0)
Pv(x0)
u
1
u2
A
B C
1181 IJSTR©2019
www.ijstr.org
Fig (3)
In the above figure we have,
(1) D is an inefficient DMU (2) S-=0, maximization e sof vertically projects D on the frontier. The outcome is output based BCC problem
(3)s 0, maximization of e shorizontally projects D on the frontier. The outcome is input based BCC problem
(4) Maximization of e s e s 1compares D with B, a point on the frontier production function.
Additive Efficiency: A DMU is said to be additive efficient if and only if, s 0ands 0. Let s,s,j be an optimal solution to the additive model.
6.
THE
CCR
EFFICIENCY
V
STHE
SLACK
BASED
EFFICIENCY
All tables and figures will be processed as images. You need to embed the images in the paper itself. Please don‘t send the images as separate files. The CCR efficiency problem with slacks may be expressed as
0 1
n
j j j
M in
s u b je c t to x x
0 1
n
j j j
a n d y y
, j, , 0(5)
Let
, j, ,
be the optimal solution of the CCRproblem, we have, 0
1 n
j j j
x x
and0 0 0
1 n
j j j
x x x x
0 0
1 1
n
j j j
x x x
(6)
0 1 n
j j j
y x
(7)
The expression (6) and (7) may be expressed as follows
0
1 1
a n d
n n
j j j j
j j
x s x y s y
Thus
j, s, s
is a solution which is feasible for the slack based efficiency problem .(8)
Let
, j, s, s
be an optimal solution to the slack based efficiency problem* * *
1 x1 2 x2 ... n xn s x0
and
*
0 0
1
1
n
j j j
x x x s
0 1 n
j j j
y y s
, 01 n
j j j
x x
and0 1
n
j j j
y y
. Where
1
x0 sand
j,, s, s
is a feasible solution of the CCR problem
(9)
Combine (8) and (9) to get,
Thus, a DMU is CCR efficient if and only if it is slack based efficient.
7.
CONCLUSION
ANDF
UTURER
ESEARCHIn the above discussion the input distance function in translog form has been estimated by linear programming and an optimization problem is proposed in order to evaluate maximum potential revenue. A problem whose optimal solution gives mix efficiency has been formulated. In the context of future research one can propose different types of efficiency stability regions and their infeasibility in DEA. Furthermore for extremely efficient DMUs super efficiency can be estimated.
REFERENCES
[1] Hoda Golshani, Robabeh Eslami (2019),‖A slack-based super efficiency in a two stage network Structure with intermediate measures‖, ―Alexandria Engineering Journal‖, Vol58, pages393-400.
[2] Kristina kocisova, Beata Gavurova, Anna Kotaskova (2018),‖A slack –based measure of agricultural Efficiency in the European Union Countries,‖ Journal of International Studies, 11(1); 189-200.
[3] Shephard R.W (1970) ―The Theory of Cost and Production Function ―, Princeton University Press, Princeton
[4] H. Poor) Farell, M J, (1957), "The Measurement of Productive efficiency", Journal of Royal Statistical Society, Series-A, 120, 253-290
[5] Tessa Vanina Soetanto, Liem pei Fun [2015], ‗Super Slack-Based Model Efficiency and stock performance of Manufacturing Industry listed in Indonesian stock Exchange‘ 2nd
Global conference on Business and Social Science, Since Direct, Procedia-Social and Behavioral Sciences, pp:1231-1239
[6] Barbara A Mark, Bland Jones and Lisa Lindley (2009), ―An Examination of Technical Efficiency, Quality and Patient Safety in Acute care Nursing Units‖, Policy Poit Nurs Pract, Pp.180-186, doi: 10.1177/1527154409346322 [7] S. Nuti, C Daraio and M Vainieri (2011), ―Relationships
1182 [8] Gahe Zing Samuel Yannik, Zhao Hongzhong, Belinga
Thierry (2016), ‗Technical efficiency assessment using data envelopment analysis: An application to the banking sector of Cate d‘ in 12th international journal strategic Management Conference, ISMC-2016, Antalya, Turkey [9] Cooper, Seiford, R. Thanassoulis, E. Zanakin (2004),
―European journal of operations research‖, pp: 332-344 [10]J. Williams, Fare, Zelenyak (2003), ―On aggregate Farrell
efficiencies‖, ―European journal of Operations research‖, pp: 615-620.
[11]Electrical Tone K. (2001), ―A Slack-Based Measure of Efficiency in Data Envelopment Analysis‖, European Journal of Operation Research, 130, 498-509.
[12]Eng., Timmer, C P, (1971), "Using a Probabilistic Frontier Production Function to Measure Technical Efficiency", Journal of Political Economy, 79, 776-794.
[13]Smita Verma, Ankit Kumavat and Anita Biswas [2015], ‗Measurement of Technical Efficiency using DEA: A case of Indian Textile Industry‘, ICAESAM, LONDON (UK)
[14]Green, W H, (1980) "Maximum likelihood Estimation of Econometric Frontier Functions‘, Journal of Econometrics, Vol. (13). pp. 21-56.
[15]Kalirajan, K (1985), ‗On measuring Absolute Technical and Allocative efficiencies‘, Sankhya, Series-B, Vol. (47), pp. 385-400
[16] B. Venkateswarlu et.al (2015),‖Efficiency Evaluation of Total Manufacturing Sectors of India-DEA Approach‖, Global journal of Pure and Applied Mathematics, Vol. (11), Pp. 3145-3155
[17]B. Venkateswarlu, et.al (2009), ―Assurance region efficiency of Total manufacturing sectors of Indian States‖, Asian journal of Economics and Econometrics, Vol. 9, pp.75- 84 [18]Venkateswarlu B. Mahaboob B., Subbarami Reddy, C., &
Madhusudhana Rao, B. (2017). Fitting of full Cobb-Douglas and full VRTS cost frontiers by solving goal programming problem. Paper presented at the IOP Conference Series: Materials Science and Engineering, 263(4) doi:10.1088/1757-899X/263/4/042127
[19]L. Hubert Venkateswarlu, B., Mahaboob, B., Subbarami Reddy, C., & Ravi Sankar, J. (2017). A study on technical efficiency of a DMU (review of literature). Paper presented at the IOP Conference Series: Materials Science and
Engineering, 263(4)
doi:10.1088/1757-899X/263/4/042124.
[20]Venkateswarlu, B., Mubashir Unnissa, M., & Mahaboob, B. (2016). Estimating cost analysis using goal programming. Indian Journal of Science and Technology, 9(44) doi:10.17485/ijst/2016/v9i44/97966.
[21]Vijay Prasad, S., Peter Praveen, J., Tiwari, A., Prasad, K., Bindu, P., Donthi, R., & Mahaboob, B. (2018). An application of LPP - graphical method for solving multi server queuing model. International Journal of Mechanical Engineering and Technology, 9(1066-1069).
[22]Hanumantha Rao, S., Vasanta Kumar, V., Srinivasa Rao, T., & Srinivasa Kumar, B. (2016). A two-phase unreliable M/Ek/1 queueing system with server startup, N-policy, delayed repair and state dependent arrival rates. Global Journal of Pure and Applied Mathematics, 12(6), 5387-5399.
[23]Rao, S. H., Kumar, V. V., Rao, T. S., & Kumar, B. S. (2016). M/M/1 two-phase gated queueing system with unreliable server and state dependent arrivals.
International Journal of Chemical Sciences, 14(3), 1742-1754.
[24]Hanumantha Rao, S., Vasanta Kumar, V., Srinivasa Rao, T., & Srinivasa Kumar, B. (2018). Analysis of batch arrival two-phase Mx/M/1 queueing system with impatient customers and unreliable server. Journal of Advanced Research in Dynamical and Control Systems, 10(2), 348-356.
[25]Rao, H., Kumar, V., Srinivasa Rao, T., & Srinivasa Kumar, B. (2018). Optimal control of M/M/1 two-phase queueing system with state-dependent arrival rate, server breakdowns, delayed repair, and N-policy. Paper presented at the Journal of Physics: Conference Series, , 1000(1) doi:10.1088/1742-6596/1000/1/012031.