Therapeutics and Clinical Risk Management
Dove
press
O R i g i n a l R e s e a R C h
open access to scientific and medical research
Open access Full Text article
Predictors of acute pancreatitis with low
elevation of serum amylase
Wandong hong1,*
Wujun geng2,*
Bicheng Chen3,4,*
Zarrin Basharat5,*
Qingsong Wu6
Vincent Zimmer7,8
Mengtao Zhou4
1Department of gastroenterology
and hepatology, 2Department of
anesthesiology, 3Department of
surgery, Zhejiang Provincial Top Key Discipline in surgery, Wenzhou Key laboratory of surgery, 4Department
of surgery, The First affiliated hospital of Wenzhou Medical University, Wenzhou, People’s Republic of China; 5Microbiology &
Biotechnology Research lab, Department of environmental sciences, Fatima Jinnah Women University, Rawalpindi, Pakistan;
6Department of Medical Records, The
First affiliated hospital of Wenzhou Medical University, Wenzhou, People’s Republic of China; 7Department
of Medicine ii, saarland University Medical Center, saarland University, homburg, 8Department of Medicine,
Marienhausklinik st Josef Kohlhof, neunkirchen, germany
*These authors contributed equally to this work
Background and aims: Serum amylase is a traditional measure used to establish the diagnosis of acute pancreatitis (AP). The current study aimed to assess the predictors and clinical outcome of AP with low serum amylase.
Methods: All patients were divided into two groups, based on their serum amylase level within the first 2 days after hospital admission: group 1 (amylase $300 U/L) and group 2 (amylase ,300 U/L). Clinical outcomes were compared between the two groups before and after 1:1 propensity score matching. Clinical and biochemical parameters were collected and evaluated as potential predictors of AP with low serum amylase.
Results: A total of 464 patients were enrolled. After propensity score matching according to age, gender, time interval before admission, hematocrit, blood urea nitrogen and creatinine, 108 matched pairs of patients were selected. There was no significant statistical difference between group 2 and group 1 with respect to severity of AP, median days of stay in hospital and death. Multivariate analysis indicated that biliary etiology (odds ratio [OR]: 0.499; 95% confidence interval [CI]: 0.265–0.942; P=0.003), low-density lipoprotein cholesterol (LDL-C) (OR: 1.009; 95% CI: 1.002–1.017; P=0.017) and triglyceride levels (OR: 1.001; 95% CI: 1.0001–1.001; P=0.015) were independently associated with development of AP along with low serum amylase.
Conclusion: Serum amylase level was not related to the severity of AP, median hospital stay (days) and death. Biliary etiology, LDL-C and triglyceride levels were independently associated with the development of AP with lower elevation of serum amylase.
Keywords: severity, acute pancreatitis, risk factor, lipids, etiology, prediction
Introduction
Acute pancreatitis (AP) is one of the most common inflammatory diseases of the gastrointestinal tract, with an increasing incidence in recent years.1 Though most patients with AP have a benign clinical course, approximately 10%–20% of patients develop severe AP with significant mortality of at least 30%.2,3 Disturbance of pancreatic blood flow, pancreatic ischemia and activated coagulation plays an important role in the development of AP as well as in the progression of the disease to severe necrotiz-ing pancreatitis.4–6 Recent studies have demonstrated that serum total bile acid, serum neutrophil gelatinase-associated lipocalin and serum soluble Fms-like tyrosine kinase 1 might play a role in prediction of severity of AP.7–9
A study published two decades ago suggested that there is no association between amylase levels and severity, cause or outcome of the AP.10 There have been important changes in the definition and classification of AP since the Atlanta classification from 1992.11 Recent revised Atlanta classification identified that persistent organ failure is the key determinant of severity.11 It may be classified as mild, moderate severe and Correspondence: Mengtao Zhou
Department of surgery, The First
Affiliated Hospital of Wenzhou
Medical University, 325000, nanbaixiang, Wenzhou, Zhejiang, People’s Republic of China Tel +86 138 0669 7558 Fax +86 577 5557 9122
email [email protected]
Journal name: Therapeutics and Clinical Risk Management Article Designation: Original Research
Year: 2017 Volume: 13
Running head verso: Hong et al
Running head recto: Amylase and acute pancreatitis DOI: http://dx.doi.org/10.2147/TCRM.S147594
Therapeutics and Clinical Risk Management downloaded from https://www.dovepress.com/ by 118.70.13.36 on 27-Aug-2020
For personal use only.
Dovepress hong et al
severe AP according to the severity of diseases. Therefore, one may concern that whether there is association between serum amylase levels and severity of AP, when it is defined by the revised Atlanta classification (classified as mild, moderate severe and severe AP).11
The diagnosis of AP is most often established by the pres-ence of two of the three following criteria:1,11 (i) abdominal pain, (ii) serum lipase or amylase greater than three times the upper limit of normal, and (iii) characteristic findings from abdominal imaging. Therefore, estimation of serum amylase and lipase levels remains the cornerstone in the diagnosis of AP.12
In AP, the levels of amylase often increase by 6–24 hours and usually peak at 48 hours. Over the period of the next 5–7 days after onset, amylase levels typically tend to normalize.13 How-ever, amylase level may remain within the normal range on admission in as many as one-fifth of patients.1 Patients with slight elevation of serum amylase – that is, less than three times the upper limit of normal level – on admission could also have or develop severe AP.10 Amylase tests in these settings result in diagnostic delays or misdiagnosis, imposing additional costs on patients and the health system.14 On the other hand, check-ing for lipase and amylase simultaneously does not result in improved diagnostic accuracy because amylase and lipase are closely correlated.15 This consideration should warrant further imaging tests like computed tomography (CT) or magnetic resonance imaging of the abdomen to confirm the diagnosis. Therefore, early identification of AP with normal or a small elevation of serum amylase in the disease course might be helpful for physicians to make a timely diagnosis.
It has been noted that serum amylase concentrations may be normal in alcohol-induced AP and hypertriglyceridemia.16 However, to the best of our knowledge, clinical and labora-tory predictors of AP with small elevation of serum amylase have not been fully investigated.
Therefore, the current study aimed to assess the predictors and clinical outcome of AP with low amylase based on the revised Atlanta criteria.
Materials and methods
inclusion and exclusion criteria
Patients with AP admitted to the First Affiliated Hospital of Wenzhou Medical University within 72 hours of the onset of symptoms, from 1st January 2012 to 31st December 2015, were eligible to be enrolled in the study. Exclusion criteria were previous pancreatic surgery, pancreatitis due to endo-scopic retrograde cholangiopancreatography (ERCP) or trauma, chronic pancreatitis, pancreatic cancer, antilipidemic
therapy, previous surgery or therapeutic ERCP during hospitalization, chronic renal disease with decreased glom-erular filtration rate, previous albuminuria, hepatitis, liver cirrhosis, macroamylasemia, diseases of the salivary glands, extrapancreatic abdominal diseases such as acute appendicitis, peptic ulcer and gynecological diseases.1,17,18
Data collection and ethics
Age, gender, body mass index (BMI), time from symptom onset to admission, and biochemical parameters including hematocrit, glucose, blood urea nitrogen (BUN) and creatinine were recorded within 12 hours of hospitalization, except for amylase levels (normal: 80–100 U/L) which were assayed on the first and second day after admission. Subjects were classified as alcohol drinkers (alcohol consumption) if they had regularly consumed any alcoholic beverage one or more times per week during the preceding 6 months.19 Subjects were classified as cigarette smokers if they had smoked 10 or more cigarettes per week during the preceding 6 months.19 Fatty liver was indicated based on noninvasive imaging methods includ-ing non-contrast abdominal CT and/or ultrasonography.20
This study protocol was approved by the Ethics Com-mittee of the First Affiliated Hospital of Wenzhou Medical University. This study was performed according to the prin-ciples expressed in the Declaration of Helsinki, and written informed consent was obtained from the subjects or their legal guardians.
Definition of outcome
AP was defined as previously described.11,21 The disease severity was stratified into mild, moderately severe and severe according to the revised Atlanta classification.11 Organ failure11,22 was defined according to the Marshall score $2, meaning that at least one system (respiratory, cardiovascular, renal) must be affected. The above condition was defined as persistent with a symptomatology $48 hours.11,22 Mortality refers to death occurring from AP or its complications during hospitalization.
All patients were divided into two groups according to the highest amylase level within the first 2 days after admission: group 1 (amylase $300 U/L) and group 2 (amylase ,300 U/L).
statistical analysis
We used propensity score methods to account for selection bias. We used our clinical experience and knowledge to select possible confounders for their potential association with amylase levels as follows: age, gender, time interval before
Therapeutics and Clinical Risk Management downloaded from https://www.dovepress.com/ by 118.70.13.36 on 27-Aug-2020
Dovepress amylase and acute pancreatitis
admission, hematocrit, BUN and creatinine. Therefore, these variables were included in a logistic regression model to derive the propensity score. When performing propensity score matching, a nearest neighbor, one-to-one pair match within 0.2 standard deviations (SDs) (caliper) of the logit of the pro-pensity score and without replacement was used.23 Absolute standardized differences (ASDs) were computed to evaluate matching effectiveness. ASDs ,10% between each covari-ate were considered a good balance between the matched groups.24 We also reported the Hosmer–Lemeshow goodness-of-fit test and c-index of propensity score model, though Ali et al24 argued these tests should not be used to decide whether the propensity score model is correctly specified.
Categorical values were described by count and propor-tions and compared by the χ2 test before matching. Continu-ous values were expressed by mean ± SD or median and interquartile range, and compared using the Student’s t-test or the Mann–Whitney nonparametric test before matching. After matching, comparisons of the matched cohorts were performed using the χ2 test (McNemar test for binary data) and paired t-tests.
Multivariable logistic analysis was used to identify the potential predictors of AP with low amylase. According to the results of collinearity diagnostics, total cholesterol was not included into multivariable logistic regression because of collinearity with high-density lipoprotein cholesterol (HDL-C) and low-density lipoprotein cholesterol (LDL-C). Alcohol consumption, serum lipid and etiology (biliary vs non-biliary) were used as dichotomous variables in multivari-able logistic regression. Odds ratios (ORs) were calculated with 95% confidence intervals (CIs).
Differences were assessed as being relevant when the two-tailed P-value ,0.05 was reached.
Results
Baseline characteristics
Before propensity score matching, a total of 464 patients (344 patients with high amylase and 120 patients with low amylase) were enrolled (Table 1). There were 281 male and 183 females, ranging in age from 14 to 92 years (mean age of 50±17 years). Of all 464 patients, 348 (75.0%), 66 (14.2%) and 50 (10.8%) patients developed mild, moderate severe and severe AP, respectively. The mean interval between the onset and admission was 1.8±0.8 days. The predominant cause of AP was cholelithiasis (42.5%). Eight patients died during hospitalization. The mean serum amylase levels at the time of admission and 24 hours later were 1,080±1,040 and 432±447 U/L, respectively.
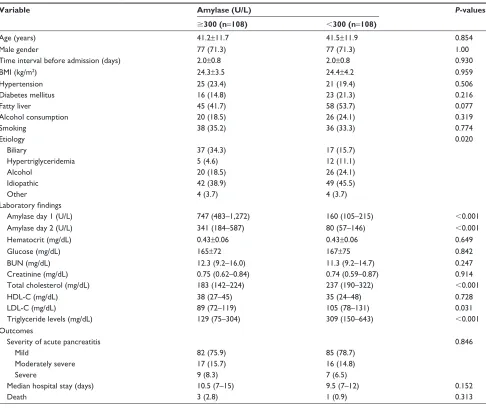
After matching according to age, gender, time interval before admission, hematocrit, BUN and creatinine, 108 matched pairs of patients were selected. Table 2 shows the demographics of the propensity score-matched patients.
evaluation of propensity score matching
The distribution of propensity scores was different and shared little overlap in the entire cohort before matching (Figure 1A). After matching, the distribution of propen-sity scores overlapped between groups, suggestive of the comparability between groups (Figure 1B). The propensity score model was well calibrated (Hosmer–Lemeshow test,
P=0.843), and discriminated adequately between the two groups (c statistic =0.77). All patients were matched to the closest control within 0.10 ASDs of the logit of the estimated propensity score (Figure 2).
Comparison of clinical characteristics of
patients with and without low amylase
Before matching (Table 1), patients in group 2 (low amylase) were younger, and there was a higher proportion of males and longer time from pain onset to admission, as compared to group 1. As to chronic concomitant diseases and lifestyle, group 2 had a higher proportion of patients with diabetes mellitus, fatty liver, alcohol consumption and smoking compared to group 1. There was significant statistical differ-ence between group 2 and group 1 with respect to etiology, BUN and lipid levels. There was a trend for longer median hospital stay (days) with higher serum amylase level, though it did not reach statistical significance (P=0.074). However, no significant difference could be observed between groups, with respect to severity of AP-instigated death.
After matching (Table 2), there was no significant statistical difference between group 2 and group 1 with respect to age, gender, time from pain onset to admission, BMI, hypertension, diabetes mellitus, fatty liver, alcohol consumption, smoking, hematocrit, glucose, BUN and creatinine. Patients with low amylase (group 2) had a lower proportion of biliary etiology, and higher serum levels of total cholesterol, LDL-C and trig-lyceride levels compared to group 1. There was no significant statistical difference between group 2 and group 1 with respect to severity of AP, median hospital stay (days) and death.
Prediction of aP with low amylase:
multivariable analysis
Before matching, according to the results of univariable anal-ysis (Table 1), age, gender, time from pain onset to admission, diabetes mellitus, fatty liver, alcohol consumption, smoking,
Therapeutics and Clinical Risk Management downloaded from https://www.dovepress.com/ by 118.70.13.36 on 27-Aug-2020
Dovepress hong et al
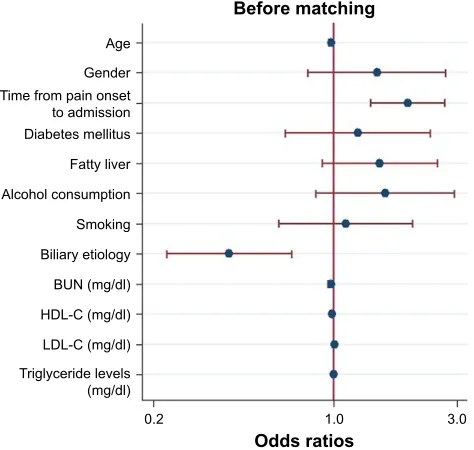
biliary etiology, BUN, HDL-C, LDL-C and triglyceride levels were included as candidate variables in multivari-able logistic regression. Multivarimultivari-able analysis indicated that age (OR: 0.979; 95% CI: 0.962–0.996; P=0.018), time from pain onset to admission (OR: 1.940; 95% CI: 1.395–2.697; P,0.001), biliary etiology (OR: 0.394; 95% CI: 0.226–0.688; P=0.001), HDL-C (OR: 0.991; 95% CI: 0.985–0.997; P=0.004), LDL-C (OR: 1.008; 95% CI: 1.002– 1.013; P=0.007) and triglyceride levels (OR: 1.001; 95% CI: 1.0001–1.001; P=0.004) were independently associated with development of AP with low amylase (Figure 3).
After matching, according to the results of univariable analysis (Table 2), biliary etiology, HDL-C, LDL-C and trig-lyceride levels were included as candidate variables in multi-variable logistic regression. Multimulti-variable analysis indicated
that biliary etiology (OR: 0.499; 95% CI: 0.265–0.942;
P=0.003), LDL-C (OR: 1.009; 95% CI: 1.002–1.017; P=0.017) and triglyceride levels (OR: 1.001; 95% CI: 1.0001–1.001;
P=0.015) were independently associated with development of AP with low amylase (Figure 4). When ruling out patients with hypertriglyceridemic pancreatitis, biliary etiology (OR: 0.434; 95% CI: 0.219–0.862; P=0.017), LDL-C (OR: 1.009; 95% CI: 1.001–1.017; P=0.022) and triglyceride levels (OR: 1.001; 95% CI: 1.0001–1.002; P=0.033) were independently associated with development of AP with low amylase.
Discussion
The results of the present study demonstrated that: (i) there was no significant statistical difference between group 2 and group 1 with respect to severity of AP, median hospital Table 1 Baseline characteristics and clinical outcomes of patients in the two study cohorts before matching (entire cohort)
Variable Amylase (U/L) P-values
$300 (n=344) ,300 (n=120)
age (years) 53±18 43±11 ,0.001
Male gender 192 (55.8) 89 (74.2) ,0.001
Time interval before admission (days) 1.7±0.8 2.1±0.8 ,0.001
BMi (kg/m2) 23.7±3.8 24.5±4.1 0.053
hypertension 91 (26.5) 23 (19.2) 0.110
Diabetes mellitus 48 (14.0) 28 (23.3) 0.017
Fatty liver 112 (32.6) 66 (55.0) ,0.001
alcohol consumption 38 (11.1) 30 (25.0) ,0.001
smoking 70 (20.4) 46 (38.3) ,0.001
etiology ,0.001
Biliary 177 (51.5) 20 (16.7)
hypertriglyceridemia 14 (4.1) 13 (10.8)
alcohol 38 (11.1) 30 (25.0)
idiopathic 104 (30.2) 53 (44.2)
Other 11 (3.2) 4 (3.3)
Laboratory findings
amylase day 1 (U/l) 1,088 (577–2,111) 149 (94–215) ,0.001
amylase day 2 (U/l) 400 (204–729) 80 (56–145) ,0.001
hematocrit (mg/dl) 0.42±0.06 0.43±0.05 0.123
glucose (mg/dl) 170±81 168±74 0.853
BUn (mg/dl) 14.3 (11.2–18.8) 11.5 (9.4–14.7) ,0.001
Creatinine (mg/dl) 0.74 (0.62–0.89) 0.74 (0.59–0.86) 0.141
Total cholesterol (mg/dl) 175 (139–219) 238 (192–330) ,0.001
hDl-C (mg/dl) 41 (31–51) 33 (24–47) 0.002
lDl-C (mg/dl) 89 (68–119) 105 (81–132) 0.001
Triglyceride levels (mg/dl) 95 (63–185) 309 (160–643) ,0.001
Outcomes
severity of acute pancreatitis 0.241
Mild 254 (73.8) 94 (78.3)
Moderately severe 48 (14.0) 18 (15.0)
severe 42 (12.2) 8 (6.7)
Median hospital stay (days) 10 (7–14.5) 9 (7–12) 0.074
Death 7 (2.0) 1 (0.8) 0.384
Note: Data are presented as mean ± standard deviation, or numbers (%), or median (25th–75th percentile), as appropriate.
Abbreviations: BMi, body mass index; BUn, blood urea nitrogen; hDl-C, high-density lipoprotein cholesterol; lDl-C, low-density lipoprotein cholesterol.
Therapeutics and Clinical Risk Management downloaded from https://www.dovepress.com/ by 118.70.13.36 on 27-Aug-2020
Dovepress amylase and acute pancreatitis
stay (days) and death (Tables 1 and 2), and (ii) patients with low amylase had a lower proportion of biliary etiology, and higher serum levels of total cholesterol, LDL-C and triglyceride levels compared to the other group of patients (Tables 1 and 2). Biliary etiology, LDL-C and triglyceride levels were independently associated with development of AP with low amylase (Figures 3 and 4). These results did not change, even after ruling out patients with hypertriglyc-eridemic pancreatitis.
Amylase testing is routinely performed at many health care institutions in clinical practice, although lipase is believed to offer superior sensitivity and specificity as compared to amylase for the diagnosis of AP.14 Other serum enzymes such as trypsinogen and elastase can be analyzed to diagnose AP. However, elevated amylase levels continue to be the “gold
standard” among the serum markers.16 Conditions like intes-tinal obstruction and renal failure might also cause a slight increase of serum amylase.16 AP with small elevated serum amylase levels on admission represents a substantial patient group; it is easy to go unnoticed, and its diagnosis might be delayed. Current textbook, guideline and/or consensus discourage CT of abdomen in the first 48 hours. Normally, the diagnosis of AP is apparent in many patients, and most patients with AP have a mild, uncomplicated course.1 How-ever, imaging could be handy in the timely diagnosis and management of AP with atypical presentation, such as with normal or small elevated levels of pancreatic enzymes, as abdominal imaging is useful to confirm the diagnosis of AP.13 Our study suggested that patients with AP with lower amylase levels than in the standardized criteria had similar clinical Table 2 Baseline characteristics and clinical outcomes of patients in the two study cohorts after matching (matched data)
Variable Amylase (U/L) P-values
$300 (n=108) ,300 (n=108)
age (years) 41.2±11.7 41.5±11.9 0.854
Male gender 77 (71.3) 77 (71.3) 1.00
Time interval before admission (days) 2.0±0.8 2.0±0.8 0.930
BMi (kg/m2) 24.3±3.5 24.4±4.2 0.959
hypertension 25 (23.4) 21 (19.4) 0.506
Diabetes mellitus 16 (14.8) 23 (21.3) 0.216
Fatty liver 45 (41.7) 58 (53.7) 0.077
alcohol consumption 20 (18.5) 26 (24.1) 0.319
smoking 38 (35.2) 36 (33.3) 0.774
etiology 0.020
Biliary 37 (34.3) 17 (15.7)
hypertriglyceridemia 5 (4.6) 12 (11.1)
alcohol 20 (18.5) 26 (24.1)
idiopathic 42 (38.9) 49 (45.5)
Other 4 (3.7) 4 (3.7)
Laboratory findings
amylase day 1 (U/l) 747 (483–1,272) 160 (105–215) ,0.001
amylase day 2 (U/l) 341 (184–587) 80 (57–146) ,0.001
hematocrit (mg/dl) 0.43±0.06 0.43±0.06 0.649
glucose (mg/dl) 165±72 167±75 0.842
BUn (mg/dl) 12.3 (9.2–16.0) 11.3 (9.2–14.7) 0.247
Creatinine (mg/dl) 0.75 (0.62–0.84) 0.74 (0.59–0.87) 0.914
Total cholesterol (mg/dl) 183 (142–224) 237 (190–322) ,0.001
hDl-C (mg/dl) 38 (27–45) 35 (24–48) 0.728
lDl-C (mg/dl) 89 (72–119) 105 (78–131) 0.031
Triglyceride levels (mg/dl) 129 (75–304) 309 (150–643) ,0.001
Outcomes
severity of acute pancreatitis 0.846
Mild 82 (75.9) 85 (78.7)
Moderately severe 17 (15.7) 16 (14.8)
severe 9 (8.3) 7 (6.5)
Median hospital stay (days) 10.5 (7–15) 9.5 (7–12) 0.152
Death 3 (2.8) 1 (0.9) 0.313
Note: Data are presented as mean ± standard deviation, or numbers (%), or median (25th–75th percentile), as appropriate.
Abbreviations: BMi, body mass index; BUn, blood urea nitrogen; hDl-C, high-density lipoprotein cholesterol; lDl-C, low-density lipoprotein cholesterol.
Therapeutics and Clinical Risk Management downloaded from https://www.dovepress.com/ by 118.70.13.36 on 27-Aug-2020
Dovepress hong et al
outcomes and severity based on the revised Atlanta criteria when compared to patients with high amylase levels in the entire cohort (Table 1) and the matched data (Table 2).
Our study showed biliary etiology (OR: 0.499; 95% CI: 0.265–0.942) was associated with a statistically significant 50.1% reduction in the odds of AP with low amylase when compared to other etiologies (Figure 4). This is consistent with existing knowledge that patients with gallstone-induced AP tend to have higher levels of pancreatic enzymes as compared
with patients with AP from other etiologies.13,16 Cho et al25 have reported on the difference in the levels of serum pan-creatic enzymes between alcoholic AP and biliary AP. Serum amylase and lipase tend to be lower in alcoholic AP than in biliary AP. This difference is assumed to be an outcome of the different mechanisms of induction of AP via gallstones and alcohol.26 Our study indicates group 2 had a high proportion
Figure 1 Distribution of propensity scores in the entire cohort before matching (A) and in the propensity score-matched groups after matching (B) for age, gender, time interval before admission, hematocrit, blood urea nitrogen and creatinine. The estimated propensity scores of each patient represent predicted probability or likelihood that the patients were in the low-amylase group.
3URSRUWLRQRISDWLHQWV
3URSHQVLW\VFRUH $IWHUPDWFKLQJ
3URSHQVLW\VFRUH
3URSRUWLRQRISDWLHQWV
%HIRUHPDWFKLQJ
/RZDP\ODVH +LJKDP\ODVH
$
%
Figure 2 absolute standardized difference plot before matching (entire cohort) and after matching (matched data) for the covariates listed on the y axis. The dotted vertical line indicates a commonly used cutoff for absolute standardized difference
(10%), which means that a covariate balance ,10% of absolute standardized
difference is considered acceptable.
&UHDWLQLQH %ORRGXUHD QLWURJHQ +HPDWRFULW 7LPHLQWHUYDO EHIRUHDGPLVVLRQ *HQGHU $JH
$EVROXWHVWDQGDUGL]HGGLIIHUHQFH
%HIRUHPDWFKLQJ $IWHUPDWFKLQJ
Figure 3 Logistic regression plot of odds ratios and 95% confidence intervals for evaluation of the potential predictors and the risk of acute pancreatitis with low
amylase in the entire cohort (n=464).
Abbreviations: BUn, blood urea nitrogen; hDl-C, high-density lipoprotein cholesterol; lDl-C, low-density lipoprotein cholesterol.
2GGVUDWLRV %HIRUHPDWFKLQJ
$JH *HQGHU 7LPHIURPSDLQRQVHW WRDGPLVVLRQ 'LDEHWHVPHOOLWXV )DWW\OLYHU $OFRKROFRQVXPSWLRQ 6PRNLQJ %LOLDU\HWLRORJ\ %81PJGO +'/&PJGO /'/&PJGO 7ULJO\FHULGHOHYHOV PJGO
Therapeutics and Clinical Risk Management downloaded from https://www.dovepress.com/ by 118.70.13.36 on 27-Aug-2020
Dovepress amylase and acute pancreatitis
of patients with alcohol consumption in the entire cohort, that is, 25.0% vs 11.1% (P,0.001) (Table 1) before and 24.1% vs 18.5% (P=0.319) (Table 2) after matching. However, it did not reach a statistical difference when compared to group 1.
It has been reported that hypertriglyceridemic pancreatitis is often associated with low or normal serum amylase, although the mechanism is not fully understood.1 One of the possible explanations is that plasma triglyceride levels .500 mg/dL interfere with in vitro determination of the actual amylase level by preventing the calorimetric reading of the assay end point.27,28 This study proposes that group 2 had a higher pro-portion of hypertriglyceridemic pancreatitis both in the entire cohort before matching (10.8% vs 4.1%) (Table 1) and in the matched cohort after matching (11.1% vs 4.6%) (Table 2).
There are no reports about the relationship between lipid levels and pancreatic enzymes in patients with AP in the literature. Our multivariable logistic regression study sug-gested that LDL-C and triglyceride levels were independently associated with development of AP with low amylase both in the entire cohort before matching (Figure 3) and in the matched cohort (Figure 4) after adjusting for confounding factors. These results did not change even when patients with hypertriglyceridemic pancreatitis were removed from the analyses. A study on cardiovascular diseases has suggested that low-density lipoprotein is the principal atherogenic lipo-protein that promotes cholesterol accumulation and an inflam-matory response in the artery wall, which drives the process of atherosclerosis.29 Ischemia is one of the well-documented etiologies of AP. Recent studies have indicated that inhibition of coagulation may improve pancreatic ischemia, accelerate
normalization of pancreatic histology and affect the devel-opment of AP.30–32 It was hypothesized that high LDL-C levels may influence pancreatic microcirculation and result in reduced yield or release of pancreatic amylase.
The strengths of our study include the following: (i) this is the first study to compare clinical outcomes of AP with and without low amylase based on the revised Atlanta criteria using a propensity score analysis, and (ii) to the best of our knowledge, this is the first study to investigate potential clinical and laboratory predictors of AP with low amylase. Nevertheless, there are some limitations to the pres-ent study. First, although selection bias could be reduced by propensity score analysis, the relatively small sample size of the matched cohort limits the strength of the results, and there is a risk of type II error. Still, even in cases of a small study sample, propensity score matching can yield unbiased estima-tions of results, unless the true confounders and the variables related only to the outcome are not included in the propensity model.33,34 On the other hand, our study achieved good balance in covariates between groups after propensity score matching (Figures 1 and 2), which makes our results reliable.
In summary, amylase level was not related to the severity of AP based on the revised Atlanta criteria, median hospital stay (days) and death. Biliary etiology, LDL-C and triglycer-ide levels were independently associated with development of AP with low amylase.
Author contributions
All authors contributed toward data analysis and drafting and critically revising the paper, and agree to be accountable for all aspects of the work. All of the authors read and approved the manuscript.
Disclosure
The authors report no conflicts of interest in this work.
References
1. Tenner S, Baillie J, DeWitt J, Vege SS; American College of Gastroen-terology. American College of Gastroenterology guideline: management of acute pancreatitis. Am J Gastroenterol. 2013;108(9):1400–1415; 1416.
2. Hong W, Lin S, Zippi M, et al. Serum albumin is independently associated with persistent organ failure in acute pancreatitis. Can J Gastroenterol
Hepatol. 2017;2017:5297143.
3. Hong W, Lin S, Zippi M, et al. High-density lipoprotein cholesterol, blood urea nitrogen, and serum creatinine can predict severe acute pancreatitis.
Biomed Res Int. 2017;2017:1648385.
4. Dumnicka P, Maduzia D, Ceranowicz P, Olszanecki R, Drozdz R, Kusnierz-Cabala B. The interplay between inflammation, coagulation and endothelial injury in the early phase of acute pancreatitis: clinical implications. Int J Mol Sci. 2017;18(2).
Figure 4 Logistic regression plot of odds ratios and 95% confidence intervals for evaluation of the potential predictors and the risk of acute pancreatitis with low amylase in the propensity score-matched groups (108 matched pairs).
Abbreviations: hDl-C, high-density lipoprotein cholesterol; lDl-C, low-density lipoprotein cholesterol.
%LOLDU\HWLRORJ\
$IWHUPDWFKLQJ
+'/&PJG/
/'/&PJG/
7ULJO\FHULGHOHYHOV PJG/
2GGVUDWLRV
Therapeutics and Clinical Risk Management downloaded from https://www.dovepress.com/ by 118.70.13.36 on 27-Aug-2020
Therapeutics and Clinical Risk Management
Publish your work in this journal
Submit your manuscript here: http://www.dovepress.com/therapeutics-and-clinical-risk-management-journal Therapeutics and Clinical Risk Management is an international,
peer-reviewed journal of clinical therapeutics and risk management, focusing on concise rapid reporting of clinical studies in all therapeutic areas, outcomes, safety, and programs for the effective, safe, and sustained use of medicines. This journal is indexed on PubMed Central, CAS,
EMBase, Scopus and the Elsevier Bibliographic databases. The manuscript management system is completely online and includes a very quick and fair peer-review system, which is all easy to use. Visit http://www.dovepress.com/testimonials.php to read real quotes from published authors.
Dovepress
Dove
press
hong et al
5. Dumnicka P, Kusnierz-Cabala B, Sporek M, et al. Serum concentrations of angiopoietin-2 and soluble fms-like tyrosine kinase 1 (sFlt-1) are associated with coagulopathy among patients with acute pancreatitis.
Int J Mol Sci. 2017;18(4):753.
6. Ceranowicz P, Dembinski A, Warzecha Z, et al. Protective and thera-peutic effect of heparin in acute pancreatitis. J Physiol Pharmacol. 2008; 59 Suppl 4:103–125.
7. Maleszka A, Dumnicka P, Matuszyk A, et al. The diagnostic useful-ness of serum total bile acid concentrations in the early phase of acute pancreatitis of varied etiologies. Int J Mol Sci. 2017;18(1):106. 8. Sporek M, Dumnicka P, Gala-Bladzinska A, et al. Determination of
serum neutrophil gelatinase-associated lipocalin at the early stage of acute pancreatitis. Folia Med Cracov. 2016;56(2):5–16.
9. Dumnicka P, Sporek M, Mazur-Laskowska M, et al. Serum soluble fms-like tyrosine kinase 1 (sFlt-1) predicts the severity of acute pancreatitis.
Int J Mol Sci. 2016;17(12):2038.
10. Lankisch PG, Burchard-Reckert S, Lehnick D. Underestimation of acute pancreatitis: patients with only a small increase in amylase/lipase levels can also have or develop severe acute pancreatitis. Gut. 1999; 44(4):542–544.
11. Banks PA, Bollen TL, Dervenis C, et al; Acute Pancreatitis Classifica-tion Working Group. ClassificaClassifica-tion of acute pancreatitis – 2012: revision of the Atlanta classification and definitions by international consensus.
Gut. 2013;62(1):102–111.
12. Muniraj T, Dang S, Pitchumoni CS. PANCREATITIS OR NOT? – elevated lipase and amylase in ICU patients. J Crit Care. 2015;30(6): 1370–1375.
13. Agrawal A, Parikh M, Thella K, Jasdanwala S. Acute pancreatitis with normal lipase and amylase: an ED dilemma. Am J Emerg Med. 2016; 34(11):2254.e3–2254.e6.
14. Barbieri JS, Riggio JM, Jaffe R. Amylase testing for abdominal pain and suspected acute pancreatitis. J Hosp Med. 2016;11(5):366–368. 15. Chase CW, Barker DE, Russell WL, Burns RP. Serum amylase and
lipase in the evaluation of acute abdominal pain. Am Surg. 1996;62(12): 1028–1033.
16. Yadav D, Agarwal N, Pitchumoni CS. A critical evaluation of laboratory tests in acute pancreatitis. Am J Gastroenterol. 2002;97(6): 1309–1318.
17. Hong WD, Chen XR, Jin SQ, Huang QK, Zhu QH, Pan JY. Use of an artificial neural network to predict persistent organ failure in patients with acute pancreatitis. Clinics (Sao Paulo). 2013;68(1):27–31. 18. Lin S, Hong W, Basharat Z, Wang Q, Pan J, Zhou M. Blood urea
nitrogen as a predictor of severe acute pancreatitis based on the revised Atlanta criteria: timing of measurement and cutoff points. Can J
Gastroenterol Hepatol. 2017;2017:9592831.
19. Cheng KH, Chu CS, Lin TH, Lee KT, Sheu SH, Lai WT. Lipid paradox in acute myocardial infarction-the association with 30-day in-hospital mortality. Crit Care Med. 2015;43(6):1255–1264.
20. Price JC, Seaberg EC, Latanich R, et al. Risk factors for fatty liver in the Multicenter AIDS Cohort Study. Am J Gastroenterol. 2014;109(5): 695–704.
21. Hong W, Dong L, Huang Q, Wu W, Wu J, Wang Y. Prediction of severe acute pancreatitis using classification and regression tree analysis. Dig
Dis Sci. 2011;56(12):3664–3671.
22. Lankisch PG, Apte M, Banks PA. Acute pancreatitis. Lancet. 2015; 386(9988):85–96.
23. de Mestral C, Rotstein OD, Laupacis A, et al. Comparative operative outcomes of early and delayed cholecystectomy for acute cholecystitis: a population-based propensity score analysis. Ann Surg. 2014;259(1): 10–15.
24. Ali MS, Groenwold RH, Klungel OH. Best (but oft-forgotten) practices: propensity score methods in clinical nutrition research. Am J Clin Nutr. 2016;104(2):247–258.
25. Cho JH, Kim TN, Kim SB. Comparison of clinical course and outcome of acute pancreatitis according to the two main etiologies: alcohol and gallstone. BMC Gastroenterol. 2015;15:87.
26. Sakorafas GH, Tsiotou AG. Etiology and pathogenesis of acute pancrea-titis: current concepts. J Clin Gastroenterol. 2000;30(4):343–356. 27. Murphy MJ, Sheng X, MacDonald TM, Wei L. Hypertriglyceridemia
and acute pancreatitis. JAMA Intern Med. 2013;173(2):162–164. 28. Wong EC, Butch AW, Rosenblum JL. The clinical chemistry laboratory
and acute pancreatitis. Clin Chem. 1993;39(2):234–243.
29. Tall AR, Yvan-Charvet L. Cholesterol, inflammation and innate immu-nity. Nat Rev Immunol. 2015;15(2):104–116.
30. Warzecha Z, Sendur P, Ceranowicz P, et al. Therapeutic effect of low doses of acenocoumarol in the course of ischemia/reperfusion-induced acute pancreatitis in rats. Int J Mol Sci. 2017;18(4):882.
31. Warzecha Z, Sendur P, Ceranowicz P, et al. Protective effect of pretreat-ment with acenocoumarol in cerulein-induced acute pancreatitis. Int J
Mol Sci. 2016;17(10):1709.
32. Warzecha Z, Sendur P, Ceranowicz P, et al. Pretreatment with low doses of acenocoumarol inhibits the development of acute ischemia/ reperfusion-induced pancreatitis. J Physiol Pharmacol. 2015;66(5): 731–740.
33. Fukunaga S, Nagami Y, Shiba M, et al. Long-term prognosis of expanded-indication differentiated-type early gastric cancer treated with endoscopic submucosal dissection or surgery using propensity score analysis. Gastrointest Endosc. 2017;85(1):143–152.
34. Pirracchio R, Resche-Rigon M, Chevret S. Evaluation of the propensity score methods for estimating marginal odds ratios in case of small sample size. BMC Med Res Methodol. 2012;12:70.
Therapeutics and Clinical Risk Management downloaded from https://www.dovepress.com/ by 118.70.13.36 on 27-Aug-2020