Trefftz method for solving two-dimensional temperature field of boiling
fluid flowing along the minichannel
S.Hożejowska1, M.Piasecka2, and L.Hożejowski3
1 Kielce University of Technology, Chair of Mathematics, Al. 1000-lecia PP 7, 25-314 Kielce, Poland 2 Kielce University of Technology, Chair of Mechanics, Al. 1000-lecia PP 7, 25-314 Kielce, Poland 3
Kielce University of Technology, Chair of Mathematics, Al. 1000-lecia PP 7, 25-314 Kielce, Poland
Abstract. The paper focuses on the numerical solution to two-dimensional temperature field of boiling liquid flowing along a vertical, asymmetrically heated minichannel with a rectangular cross-section. One of the walls of a minichannel is a DC supplied heating foil. The parallel walls are made of glass panes for thermal insulation and for observation of the fluid flow and the void fraction. A thin layer of thermosensitive liquid crystal paint on the outer side of the heating foil enabled to record two-dimensional temperature distribution of outer foil surface. The paper presents computations based on Trefftz method for finding two-dimensional temperature field of boiling liquid flowing along the minichannel.The presented research is limited only to a liquid phase of the two-phase mixture observed in the minichannel.The velocity of liquid flowing through the minichannel is represented by a piecewise linear approximating function. To solve energy equation for liquid phase, Trefftz functions specially generated for this purpose were employed. Temperature field in the fluid was approximated by a linear combination of Trefftz functions. Temperature at the interface between working fluid and foil amounts to the saturation temperature. Temperature distribution in the foil and the glass pane was also computed using proper Trefftz functions.
1 Experimental research
1.1 Experimental stand
The area of interest is the issue of heat transfer into cooling liquid flowing through a rectangular minichannel with one uniformly heated enhanced wall. Experimental investigations focused on forced convection and particular attention was paid to boiling incipience conditions.
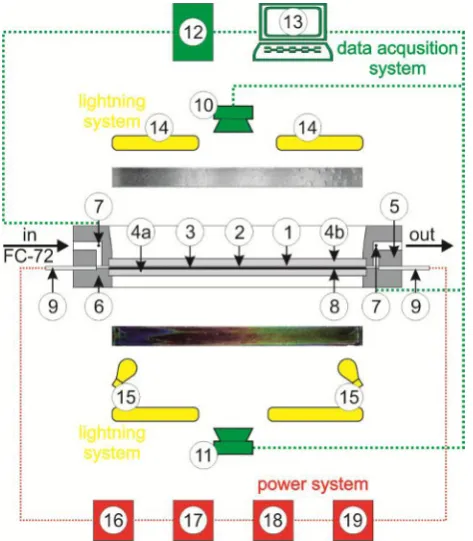
The main loop consists of the following elements: the test section with the minichannel, a rotary pump, a compensating tank (pressure regulator), a heat exchanger, a filter, rotameters and a deaerator. The essential part of the experimental stand is the test section with a minichannel (#1), figure 1. It is 1 mm deep, 40 mm wide and 360 mm long, oriented vertically. The heating element for the working fluid (FC-72) flowing along the minichannel is an alloy foil (#2) stretched between the front cover (#6) and the channel body (#5). This thin foil (approx. 0.1 mm) designated as Haynes-230 constitutes one of the minichannel surfaces of the rectangular section. The foil is enhanced on the side of the fluid
flowing in the minichannel. The foil is energized by copper elements (#9) with direct current of controlled intensity. It is possible to observe both surfaces of the minichannel through two openings covered with glass panes. One pane (#4a) allows observing changes in the temperature of the foil surface. It is a plain side of the heating foil (between the foil and the glass) and is covered with thermosensitive liquid crystal paint (#3). The opposite surface of the minichannel (from the enhanced side of the heating foil) can be observed through the other glass plane (#4b), which helps recognize the vapour-liquid two-phase flow patterns. K-type thermocouples (#7) are installed in the inlet and outlet of the minichannel; two pressure converters are also located in the inlet and outlet. The data from the experiment and image acquisition system include: #10-Canon Eos 550D digital SLR camera, #11-#10-Canon G11 digital camera, #14-two 1 kW halogen reflectors with forced air cooling and heat resistant casing and #15-fluorescent and LED lamps emitting “cool white light”. Experimental data have been recorded with DaqBoard 2005 data acquisition station (#12) equipped with DASYLab software installed on a laptop (#13). The C
Owned by the authors, published by EDP Sciences, 2013
This is an Open Access article distributed under the terms of the Creative Commons Attribution License 2 0 , which . permits unrestricted use, distributi and reproduction in any medium, provided the original work is properly cited.
heating surface in the minichannel is provided with electric current by an inverter welder (#16) as current regulated DC power supply (up to 300 A). Regulation and control of the system are provided by: #17-a shunt, #18-an ammeter and #19-a voltmeter. On one side of this foil, i.e. contacting the fluid in the minichannel, laser surface texturing was applied to obtain micro-recesses distributed in the selected area of the foil (40mm x 40 mm), as shown in figure 2a. The micro-recesses were performed by laser drilling with the diode pumped Nd:YAG laser producing UV radiation of the wavelength of 355 nm. The recesses are distributed evenly every 100m in both axes. They are 30 m in diameter and 5 m deep. A 1-2 m high layer of melted metal accumulates annularly around the recesses forming the structure of “craters”. The total height of the micro-recesses is about 6 m. The photograph of the plain and enhanced foil is shown in figure 2b-d.
Fig. 1. The schematic diagrams of the most elements of the experimental stand: #1-minichannel, #2-heating foil, #3-liquid
crystal layer, #4a,b-glass pane, #5-channel body, #6-front cover, #7-thermocouple, #8-enhanced side of the foil, #9-copper element #10-digital SLR camera, #11-digital camera,
#12-data acquisition station, #13-a laptop, #14-halogen reflectors, #15-fluorescent and LED lamps, #16-inverter
welder, #17-shunt, #18-ammeter, #19-voltmeter.
1.2 Experimental methodology
Application of liquid crystals for the detection of two-dimensional heating surface temperature distribution must be preceded by colour (hue) temperature calibration [1,2]. Evaluation of the accuracy of heating foil temperature measurements with liquid crystal thermography was discussed in [1]. Mean temperature measurement error of heating foil by liquid crystal thermography equal to 0.86 K was obtained.
Fig. 2.a) Heating foil with the selected enhanced area; b-d) photos of the foil: plain (b), enhanced (c,d), including the
photo of the single micro-recess (d).
After deaeration, there is a laminar flow of FC-72 working fluid in the main loop in the experimental set-up. The liquid, at the temperature below its boiling point, flows laminarly into the minichannel (#1), figure 1. When the desired pressure and flow rate are reached, the gradual increase in the electric power supplied to the heating foil results in an increased heat flux transferred to the liquid in the minichannel. The current supplied via copper elements (#9) to the heating foil (#2) is controlled by an electrical system equipped with an inverter welder (#16). This leads to the incipience and next to the development of nucleate boiling. Then, the current supplied to the foil is reduced gradually. Thanks to the liquid crystal layer located on its surface contacting the glass it is possible to measure the temperature distribution on the heating wall. Flow structure observation is carried out simultaneously at the opposite side of the minichannel.
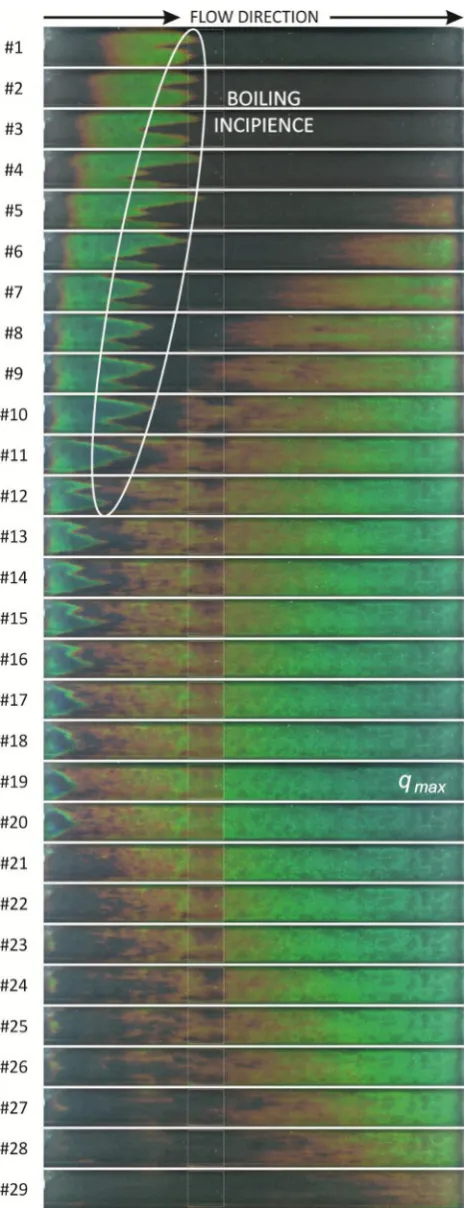
nucleation hysteresis was discussed in [1-4]. When the heat flux continues to increase, a new hue sequence in the upper part of images appears (from #5 onwards). This occurs when developed nucleate boiling is in progress in the minichannel. Then the current supplied to the foil is gradually reduced (images from #20 up to #29). Mild hue changes, in the direction opposite to the spectrum sequence, are observed to accompany the decrease of current supplied to the foil. As a result, heat transfer returns to forced single phase convection.
2 Void fraction determination
2.1 Visualisation of two phase flow structures
The analyses of flow structure concern the minichannel with foil enhanced on the selected area. It was based on the monochrome images of flow structures with an SLR camera of heating foil, obtained on the side contacting fluid flowing in a minichannel. They were processed using Corel graphics software. After the photos had been binarized, which helped determine the boundary between the liquid and the vapour, the analysis of phase volumes was developed using special software. Techsystem Globe, analytical software, has been used in stereological analyses of digital images for quantitative assessment. The software allowed the determination of the areas of the two phases and/or percentage of the defined phase. In evaluation, the absolute error of the void fraction was assumed to be equal to the area (point) comprising 0.0064 mm2; it results from the resolution of the image taken by a digital camera.
2.2 Void fraction determination methodology
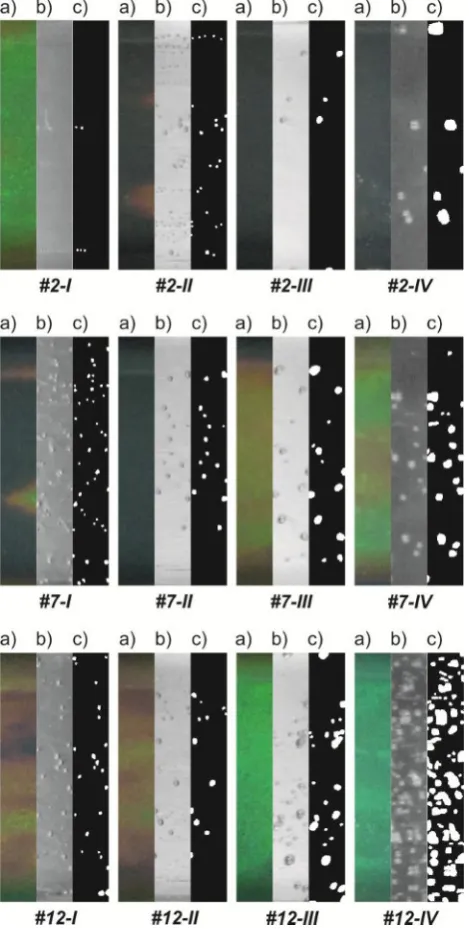
Three selected settings: #2, #7 and #12 (see figure 3) for increasing of heat flux supplied to the heating surface of the foil were selected for analysis. Cross-sections of colour images are presented as (a) in figure 4 and flow structure images are shown as (b) in this figure. Four cross-sections of selected images (size of 5 x 40 mm), placed at the distance of 90 mm (I), 133 mm (II), 270 mm (III) and 336 mm (IV) from the inlet to the minichannel were selected. The binarized images of two-phase flow structure images (black and white) adapted for analysis in Techsystem Globe are presented as (c) in the figure 4.The void fraction was determined according to the following formula [1,3]:
v L
v
M v L
M v
v L
v
)
( A A
A A
A A V
V V
(1)
where: V-volume, A-cross section area, -depth. In our notation, the subscripts referring to the glass pane, the heating foil, the liquid, the vapour and the minichannel are denoted with letters: G, F, L,v and M , respectively. Liquid and vapour cross-section areas were obtained from phase image analysis performed by means of Techsystems Globe software. The results are presented in the figure 5 as void fraction dependence along the minichannel length for settings #2, #7 and #12.
Fig. 3. Colour heating foil images while increasing and later decreasing heat flux supplied to the foil,experimental parameters: flow velocity0.14 m s-1, mass flux 235 kg m-2 s-1,
Reynolds number Re = 750, inlet pressure 135 kPa,
inlet liquid subcooling 45 K,
Fig. 5. Void fraction dependence along the minichannel length for selected cross sections for settings: #2, #7, #12, parameters
as for figure 3.
3 Mathematical model
3.1 Problem formulation
In mathematical model the investigations took into account the dimension along the flow direction (x), but the dimension perpendicular to it (y) was related to the test section composed of the glass pane, heating foil and minichannel with cooling liquid. Further considerations are focused on the central part of the minichannel (along its length) so that the physical phenomena occurring on outer sides of the minichannel have no influence on thermodynamical parameters in the region under consideration.
Subcooling liquid at a temperature lower than saturation temperature enters the minichannel and it is heated by the heating foil during its flow. We assume both for stationary and laminar flow (Re = 750) that velocity vector is parallel to the axis of the minichannel so it has only one non-zero component u = u(y). The component u(y) is approximated by a following roof function
y
u
max
1
M2
y
M
u
(2)where umax is equal to the doubled average velocity. The incipience of boiling can be modelled by the energy equation and, provided the equation is valid for liquid phase only, it has the following form
x T y u c yT x
T
L
L L L 2
L 2
2 L 2
(3)
where: cL - specific heat,
L- density,
L- thermal conductivity.The following boundary conditions were specified for the equation (3):
- temperature of the liquid in the inlet and outlet of the minichannel equals Tin and Tout ,respectively, i.e.
in L0
,
y
T
T
for 0yM (4)
outL
L
,
y
T
T
for 0yM (5)Fig. 4. Selected images for settings: #2, #7 and #12: colour image (a), real (b) and binarized (c) two-phase flow structure images; white colour refers to the vapour, and the black colour
represents the liquid.
- temperatures of the liquid and the foil at the interface are equal:
x
T
x
T
x
T
x
T
x
T
x
T
x
T
sat F
sat
sat F
F L
)
0
,
(
if
,
)
0
,
(
if
,
0
,
0
,
(6)for 0xL
where: Tsat - varies linearly with pressure in the
minichannel;
heating foil is transferred to liquid phase proportionally to
the void fraction:
y
T
x
y
T
F F LL
1
for y0 and 0xL (7)Stationary heat transfer in the glass pane and heating foil can be described by the following differential equations:
(a) for glass
T
G
0
(b) for foilF V F
T
q
(8)where qV means volumetric heat flux. For these equations
we assume continuity of temperature and heat flux at the foil-glass interface:
k F
G
k F
kF
x
,
T
x
,
T
T
(9)y
T
y
T
G G FF for
y
F and 0xL (10)where Tk means the measurements obtained with liquid
crystal thermography at the foil-glass contact at discrete points
x
k,
F
. To complete specification of the functions TF and TG we assume that the outer surfaces ofthe minichannel are thermally isolated. Figure 6 contains the geometry and prescribed conditions of the considered problem.
G F F 0 0 x T x
TF G
equality of temperature and gradients 0 x T x TF G
in T
y M
0 y TG liquid crystals glass glass fluid foil
TG =?
TF =?
TL =?
q u asiad iab atic wall out
T
u(y)
u(y)
x
Fig. 6. Diagram of the boiling liquid flow in the minichannel, with the adapted boundary conditions;
(pictorial view, not to scale).
3.2 Trefftz method
Eq. (3) subject to prescribed boundary conditions (4)-(7) will be solved by the Trefftz method. In this method the unknown solution of a differential equation is approximated with a linear combination of the functions (so called Trefftz functions) which satisfy the governing equation. The unknown coefficients are determined by
matching the boundary conditions. Before numerical calculations we have to generate Trefftz functions corresponding to Eq. (3) with roof-shaped velocity of the liquid, u(y). The unknown solution to Eq. (3) is expanded in Taylor series, around the point (0,0):
... ! 3 1 ! 2 1 ! 22 2!
1 0 , 0 , 3 3 L 3 2 2 L 2 L 2 2 2 L 2 L L L L x x T y y T xy y x T x x T y y T x x T T y x T (11)
From Eq. (3) we get the dependence concerning the
second partial derivative 2L
2
y
T
L 2 2L L L L 2 L 2 x T x T y u c y T (12)which we substitute into Eq. (11) and after some algebraic manipulations the unknown solution TL has the
following representation
1 n nL
,
,
n
y
x
v
b
y
x
T
(13)where polynomials
v
n
x
,
y
are the desired Trefftz functions satisfying the energy equation (3) identically. Next, we approximate the solution TL with finitely many
x
y
v
n,
’s which gives
N ny
x
v
b
y
x
T
1 n nL
,
,
(14)The unknown coefficients of this expansion, bn, will
be selected to make the approximant TL best match (in
variational sense) the boundary conditions (4)-(7). In terms of computations, by proper choice of bn’s one
should minimize the functional J that describes mean square error between approximated and prescribed values of temperature or heat flux on the boundaries of the considered domain. The functional has the following form
L N n L N n N n N n dx x T x v b dx y x T x y x v b dy T y L v b dy T y v b J 0 2 1 sat n n 0 2 1 F F n n L 0 0 2 1 out n n 2 1 in n n 0 , 0 , 1 0 , , , 0 M M (15)Finally we get the solution TL which satisfies the
distributions of temperature in the foil and in the glass as well as their gradients along the minichannel.
4 Results
Numerical calculations were performed for experimental data and they concerned forced flow of the cooling liquid FC-72 through asymmetrically heated vertical minichannel. Our considerations focused only on the incipience of the nucleate boiling, see figure 7a. Calculations were conducted for setting #2, with all parameters of the experiment given in figure 3. The void fraction described in detail in 2.2. was approximated with a third degree polynomial as shown in figure 7b.
Fig. 7. a) Hue distribution at the foil-glass interface obtained with liquid crystal thermography and observed flow structure
for the given temperature distribution, b) void fraction dependence along the minichannel length for selected.
Setting #2.
The first stage of computations involved the use of Trefftz method for finding two-dimensional temperature distribution in the glass pane and the heating foil. In the next step temperatures were calculated in the liquid phase. We designed approximate temperature distributions TG, TF, TL to be polynomials of the same degree. Figure 8a presents two-dimensional temperature distribution in the heating foil and the glass pane, both obtained by Trefftz method. Either of the approximants satisfies the assumed conditions (9) and (10), with a relatively high accuracy. Similarly, figure 9a shows
temperature field in the heating foil and the flowing liquid. One can notice the characteristic shape of isotherms in the liquid (see figure 9a) which is due to modelling the velocity vector as a roof function. In
figure 9b temperatures of the heating foil and the liquid at the foil-liquid interface are compared to saturation temperature. In [5] similar research, assuming a parabolic fluid velocity profile, was conducted for bubbly and bubbly–slug flow.
Fig. 8. a) Two dimension temperature distributions of the glass pane and the heating foil, both obtained with Trefftz method,
b) temperatures of the measurements (blue ), glass pane (white o) and foil (red ) at the glass-foil contact. Setting #2.
Fig. 9. a) Two dimension temperature distributions of the heating foil and of the liquid, both obtained with Trefftz method, b) temperatures of the foil (blue), of the liquid (black) and saturation (red) at the foil-liquid contact as a function of
distance from the inlet to the channel; c) heat transfer coefficient as a function of distance from
The known liquid and foil temperature distributions allowed calculating heat transfer coefficient at the foil-glass contact points from the convective boundary condition
(
,
0
)
(
)
)
0
,
(
ave F
F
F
x
T
x
T
x
y
x
T
(16)where average temperature of the liquid
M
0 L
M
ave ,
1
dy y x T x
T , was assumed to be the
reference temperature.
In the minichannel flow boiling, considerable heat transfer enhancement takes place at boiling incipience. It is observed as a sharp increase in the heat transfer coefficient at the foil-liquid contact, see figure 9c.
5 Conclusions
The present paper presents the first approach to modelling laminar flow of the fluid during incipience of
nucleate boiling.
After we had set up a mathematical model of the problem, we used Trefftz method to solve it, however the validity of our solution is restricted to liquid phase only. Special Trefftz functions had to be generated for the case of roof-shaped velocity of the liquid.
The chosen method based on Trefftz functions was successfully applied to the direct problem of finding temperature distribution in the glass pane. Moreover, this method turned to be suitable for the considered inverse problems: in the heating foil were we had a specified condition at one boundary and in the liquid where we assumed convective boundary condition in order to compute the heat transfer coefficient. The obtained numerical results show high compliance with physical assumptions of the model and have satisfactory accuracy. Since the results based on Trefftz method turned to be promising, further research will be devoted to adapting the method to finding temperature distribution in the fluid which would include vapor phase as well as liquid phase.
Acknowledgements
The research has been financed by the Polish Ministry of Science and Higher Education, Grant No. N N512 354037 for the years 2009-2012.
References
1. M. Piasecka, B. Maciejewska, Exp. Therm. Fluid Sci. 38 (2012)
2. S. Hozejowska, M. Piasecka, M.E. Poniewski, Int. J. Therm. Sc. 48, 6 (2009)
3. M. Piasecka, Proc. ECI 8th Int. Conf. on Boiling and Condensation Heat Transfer, 3-7.06.2012, Lausanne, Switzerland (2012)
4. M. Piasecka, S. Hozejowska, M.E. Poniewski, Int.J. Heat and Fluid Flow, 25 (2004)