61
The Effectiveness Of IT Enabled Teaching In
Classroom Environment
Nupur Gupta, Sanjeev Thakur
ABSTRACT: During the last two decades the process of teaching and learning has changed to a large extent. Earlier, when there used to be bulk of hard books and innumerable pieces of paper to deal with, the present scenario is altogether different. The reason behind such a dramatic change is attributed to ICT (Information Communication technology), wherein the adoption of IT tools in the education environment has a significant impact on the framework followed by different institutions and organizations in teaching –learning process. The use of ICT in education is not limited to the teaching of any specific subject; instead it has a broader horizon to deal with, incorporating the use of Audio-Visual aids, Experimental tools, manipulators, dramatization, thus enhancing the Creativity of both the educator and the learner. The following report analyzes the impact of ICT on the performance of students in different subjects.
KEYWORDS- ICT, Performance, ANOVA test
————————————————————
1.
INTRODUCTION
During the last two decades the higher education institutions have invested heavily in Information and Communication Technologies (ICT). ICT have impacted the university context, organization and the teaching and learning methods. The chalk-and-talk approach doesn‘t work with today‘s students. Supporting collaborative learning and creating lessons that encourage social interaction does more than give students a better and more engaging way to learn together. It provides them with the skills they need to shape their future. Collaborative learning creates more engaged learners, help develop essential skills and prepare students for their future. Technology is an ever changing medium in the world we live in today. Schools across the world are increasingly integrating technology into the classroom each day. The use of technology is both beneficial for the students and the teacher. One source of technology that has proved to be beneficial in the classroom is a Smart Board. Some key features of Smart Boards include the increase in interactive instructional tools, create more interest and motivation among students, display attractive graphics, improve lectures with audio-visual tools, provide better instructional materials, and can also cater to all learning styles. In such a setting, this new technology enables a quality learning environment. The goal of integrating a Smart Board into the classroom is to improve student performance and increase their technology literacy. This can be done with both the teacher and the students' efforts. The following project aims at the analyzing the student‘s performance over a span of 7 years, while comparing the introduction of technology in teaching methodology. The data comes from one of the renowned public school of the city.
2.
LITERATURE REVIEW
Jeyamani, P. (1991) studied the effectiveness of the simulation model of teaching through Computer Assisted Instruction (CAI). Researcher tried to compare the simulation model with traditional method. The sample for this investigation consisted of students of standard XI of the two schools selected. The pre-test and post-test method was used. Mean, SD and‗t‘ test were used to treat the data. The findings were the sex-wise comparison proved to be insignificant. There was no significant difference in learning level between Tamil-medium and English-medium students. It was concluded that the experimental group performed significantly better than the control group.
Mohanty, P.C. (1988) intended to study critically the impact of educational television (ETV) programmes on the primary school children in the state of Orissa. 300 students were randomly selected from the schools and the tools used three Performance tests which were developed to assess the impact of ETV programmes. Questionnaire, check-list and an interview schedule were developed to get the feedback from teachers, headmasters and inspecting officers. The major findings were the experimental group had superior mean performance scores as compared to the control group, which indicated the expected impact of educational television on the scholastic performance of primary school children in respect of gaining in knowledge in general science, social studies and language.
Passey, D., Rogers, C., Machell, J., McHugh, G. and Allaway, D. (2004) tried to find out the motivational effect of ICT on pupils. This study, commissioned by the DfES, investigated the effects of ICT on pupils' motivation. A sample of 17 schools from across England was surveyed. This study found that ICT positively impacted on motivation, particularly in relation to engagement, research, writing and editing and presentation. Pupils reported that the Internet, interactive whiteboards, writing and publishing software, and presentational software were the most useful. There was also evidence that ICT positively influenced attitudes towards school work and school behaviour.
Stark, R., Simpson, M., Gray, D. and Payne, F.(2000).: The impact of information and communications technology initiatives. This Scottish report, produced by the Scottish _______________________
Nupur Gupta, Amity University, Noida (U.P), 201303,India
62
Executive Education Department, outlines the interim findings of a survey (conducted in 1998-1999) that was designed to assess the impact of a variety of ICT initiatives on pupils' skills and knowledge. Respondents in this study reported that ICT improved motivations, enhanced learning and teaching, improved communication and access to information, and improved efficiency and feelings of independence. Teachers perceived ICT to be useful for streamlining current teaching procedures, gaining access to new professional opportunities and new exciting teaching opportunities.
Goldberg, A., Russell, M. and Cook, A. (2003): The effect of computers on student writing: A meta-analysis of studies from 1992- 2002. US researchers performed a meta-analysis of 26 studies conducted between 1992-2002 that focused on the comparison between pupils' writing with computers vs. paper-and-pencil. This analysis found significant mean effect sizes in favour of computers in relation to the quantity as well as the quality of the writing. The researchers also found that the writing process is more collaborative, iterative and social in computer classrooms as compared to paper-and-pencil environments, and they concluded that pupils who use computers when learning to write are not only more engaged and motivated in their writing but also produce written work that is of greater length and higher quality. Success within learning is not only measured by number or letter grades, but is also measured by increases in critical thinking, motivation, self-esteem, problem-solving or creativity. By providing students with differentiated learning experiences that incorporate ICT tools and varied assessment measures, educators can delve into skill sets not exhibited in traditional learning environments. UMESCO Asia and Pacific Regional Bureau for Education (2004) in the case study of six Asian countries, found that the use of ICT tools ―helped to improve greater autonomy in learning, stimulate students‘ sensory and cognitive curiosity, develop life skills, boost self-confidence and facilitate the learning of abstract ideas and theories‖ (p129). Reynolds et al (2003) in their survey of teachers on the use of ICT in British secondary schools reported that ICT tools enabled students to ―express themselves more clearly‖ within the subject of literacy (p. 161). Tools such as word processors, presentation software, and text to speech software were also used to scaffold student writing, reading, and spelling and literacy skills. Teachers, in turn, claimed that students were ―more resourceful…creative… (and had an) enhanced sense of achievement in learning‖ when working on projects that incorporate ICT tools (Reynolds et al., 2003, p. 161). Within the subject of math, students used ICT tools to perform calculations and computations that might have been time consuming if done by manually. These tasks require low level reasoning and by using ICT tools, more time could be used to perform higher order thinking and reasoning. Also, tools were used to facilitate student learning in science by allowing students to make abstract ideas concrete by using animations, videos, and simulations, ―This should make Science seem more real and proximate to pupils, rather than being a distant and separate area. It can also facilitate links being made between the science which is taught in schools, and the experiences of pupils in their everyday
lives, thereby enriching their scientific understanding experiences‖ (Reynolds et al., 2003, p. 158).
3.
NEED AND SIGNIFICANCE OF THE STUDY
ICT has brought revolution in the field of education. In country like ours, a developing one, the usage has been increasing day by day. Schools and Colleges across the length and breadth of the country are in the process of making the use of ICT tools compulsory. But the implementation of a new technology simultaneously demands to be evaluated. Therefore, this case study aims at evaluating the performance of students divided over the span of seven years, and comparing their results before and after the implementation of ICT. The measure used is the measures of central tendency and ANOVA tests.
4.
PROBLEM STATEMENT
Educational institutions and Government of India are committed towards an infusion of IT into the education system. Schools in India are leaders in this program, with the highest absorption of IT enabled education. The challenge is to understand how successful IT is within the classroom environment
5.
RESEARCH DESIGN
5.1.METHODOLOGY
The present study employed descriptive method of the comparative and correlational type. It aimed at studying and describing the ICT awareness and its perceived impact on Academic performance of the secondary school students, in terms of test scores. The study reviewed in this paper was conducted at a co-educational state secondary school in Delhi, India. It considered the results of successive years from 2007 -2012 for class 12 science students (17-18 years of age). The entire data set will be broadly divided into two categories A (2007-2009) and category B (2010-2012), 2009 being the year when the techniques and tools for ICT were implemented. The subjects taken under study are Physics, Chemistry, Mathematics and Computer Science, all being the technical subjects of study.
5.2.PLACE OF RESEARCH
The study was conducted at one of the leading public schools of Delhi, which has its roots as old as 25 years. The school caters to the students of preparatory level up to class XII, housing 5000 students. Each and every year the students of the school excel across all the spheres of academics and extracurricular activities, with an important achievement for the year 2012-2013 of having the CBSE topper from the school all over the country. Every year around 350 students sit for their CBSE board examinations, where they are scaled on a common platform.
5.3.RATIONALE BEHIND THE CHOICE OF
RESEARCH SAMPLE
63
the teaching purposes. The class XII student‘s sits for the CBSE board examinations and are thus graded on a common scale, and therefore, their results are unbiased and are not affected by any internal interventions. The stream chosen, i.e. Science was particularly the one which has the highest level of ICT implementation, out of the five subjects the students study; four of them are directly affected by ICT usage. The sample size (N=100) is a manageable size for a research to be conducted. The another important factor which facilitated the research was that the Institution itself wanted to undertake the research on this sample because, the IT cost incurred per student is highest for this sample and also the focus is to achieve continuous improvement in the performance of the students
5.4.SAMPLE
For the present study 475 secondary school students studying in English medium school were selected. Students studying in standard XII of CBSE Board were included.
5.5.ANALYSIS OF DATA
For the Descriptive Analysis the data was analyzed using the measures of central tendency, variability like Mean, Median, Mode, Standard deviation, Skewness and Kurtosis. For the Inferential Analysis the hypotheses were analyzed using the appropriate statistical techniques like f-test, ANOVA, Coefficient of Co-relation in order to compare various groups for studying the differences and ascertaining relationships.
5.6.IT TOOLS USED FOR RESEARCH
MICROSOFT EXCEL 2010- Microsoft Excel is a spreadsheet application developed by Microsoft for Microsoft Windows and Mac OS. It features calculation, graphing tools, pivot tables, and a macro programming language called Visual Basic for Applications. It has been a very widely applied spreadsheet for these platforms, especially since version 5 in 1993, and it has replaced Lotus 1-2-3 as the industry standard for spreadsheets. Excel forms part of Microsoft Office. IBM SPSS STATISTICS- Version 19- SPSS Statistics is a software package used for statistical analysis. Long produced by SPSS Inc., it was acquired by IBM in 2009, and current versions are officially named IBM SPSS Statistics. Companion products in the same family are used for survey authoring and deployment (IBM SPSS Data Collection), data mining (IBM SPSS Modeler), text analytics, and collaboration and deployment (batch and automated scoring services).
6.
QUANTITATIVE ANALYSIS
For the purpose of analyzing the performance of the students, we divided the class into four quartiles on the basis of the final scores of each student for each year.
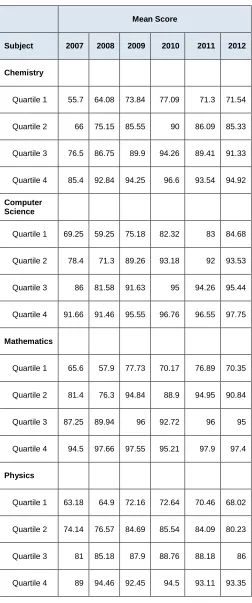
TABLE 1: Means of different quartiles of different subjects
Mean Score
Subject 2007 2008 2009 2010 2011 2012
Chemistry
Quartile 1 55.7 64.08 73.84 77.09 71.3 71.54
Quartile 2 66 75.15 85.55 90 86.09 85.33
Quartile 3 76.5 86.75 89.9 94.26 89.41 91.33
Quartile 4 85.4 92.84 94.25 96.6 93.54 94.92
Computer Science
Quartile 1 69.25 59.25 75.18 82.32 83 84.68
Quartile 2 78.4 71.3 89.26 93.18 92 93.53
Quartile 3 86 81.58 91.63 95 94.26 95.44
Quartile 4 91.66 91.46 95.55 96.76 96.55 97.75
Mathematics
Quartile 1 65.6 57.9 77.73 70.17 76.89 70.35
Quartile 2 81.4 76.3 94.84 88.9 94.95 90.84
Quartile 3 87.25 89.94 96 92.72 96 95
Quartile 4 94.5 97.66 97.55 95.21 97.9 97.4
Physics
Quartile 1 63.18 64.9 72.16 72.64 70.46 68.02
Quartile 2 74.14 76.57 84.69 85.54 84.09 80.23
Quartile 3 81 85.18 87.9 88.76 88.18 86
Quartile 4 89 94.46 92.45 94.5 93.11 93.35
64
The following inferences are based on the yearly improvement in the performance of students for each subject in each quartile.
Difference in Mean Scores
2007-08
2008-09
2009-10
2010-11
2011-12
Chemistry
Quartile 1 15% 15% 4% -8% 0%
Quartile 2 14% 14% 5% -4% -1%
Quartile 3 13% 4% 5% -5% 2%
Quartile 4 9% 2% 2% -3% 1%
Computer Science
Quartile 1 -14% 27% 9% 1% 2%
Quartile 2 -9% 25% 4% -1% 2%
Quartile 3 -5% 12% 4% -1% 1%
Quartile 4 0% 4% 1% 0% 1%
Mathematics
Quartile 1 -12% 34% -10% 10% -9%
Quartile 2 -6% 24% -6% 7% -4%
Quartile 3 3% 7% -3% 4% -1%
Quartile 4 3% 0% -2% 3% -1%
Physics
Quartile 1 3% 11% 1% -3% -3%
Quartile 2 3% 11% 1% -2% -5%
Quartile 3 5% 3% 1% -1% -2%
Quartile 4 6% -2% 2% -1% 0%
From the analysis, it is visible that lowest performing students across all quartile sets recorded significant improvement in their average score after the implementation of ICT. Students in Quartile 1 recorded the highest increase in percentage score across all four subjects, immediately after the implementation of ICT. Students in Quartile 1, i.e. the best performing students recorded only a marginal increase in their average score over the years. This improvement in performance of low performing students can be attributed to the improvement in understanding of topics and participation of the students in the classroom. Since the implementation of ICT, it has been easier for teachers to explain complex concepts coupled with increased level of discussion.The absolute improvement in performance of students has varied across subjects, but has definitely recorded a rise in the scores.
Post implementation of ICT, a steady improvement in the lowest score of the students has been recorded. A linear trend predicts steady improvement in the performance of the weakest student in the classroom helping narrow the difference between the best and worst performer. It is indicative of an overall improvement in the learning and understanding abilities of the students, especially average performers.
7.
SCOPE AND DELIMITATIONS OF STUDY
The present study includes students studying in the CBSE board only. The sample for the study comprises of students with English as their medium of instruction and not any other medium. The present study studies all the variables with respect to the students and not their teachers or peers.
8.
FINDINGS
On the basis of various descriptive measures analyzed, preliminary findings are:
1. It is difficult to get a macro view of any marked improvement in performance.
2. Students need to be classified into performance groups to access the success of the tool.
3. ICT has been successfully used to teach Physics, Chemistry & partly successful in Computer Science 4. Use of ICT has not been very successful in
teaching Mathematics
9.
HYPOTHESIS TESTING
On the basis of our preliminary findings, we assume
Null hypothesis - the performance of students in each subject differs significantly even after the implementation of our tool.
Alternative hypothesis - Not showing significant difference in the performance of the students.
We hence make use of Pearson‘s Chi square tests, where the significant (tabulated) value is taken to be 0.05.
Significant
Value Physics Chemistry
Computer
Science Mathematics
65
Since calculated values are less than tabulated value for three of the subjects namely Physics, Chemistry and Computer Science, we accept the null hypothesis that the performances of the students differ over the years because of the implementation of the new tool. Mathematics does not show any significant difference and hence tool is not successful in contributing to the performance of the students.
ANOVA Table: - the tabulated values of F test are all greater than the calculated values of four subjects and hence we accept the null hypothesis.
10.
CONCLUSIONS
The study reviewed in this report showed that ICT, through an e-learning intervention, can improve student performance as measured in test scores. Critically, this improvement was not global, and some students showed reduced numerical outcomes despite a reported enjoyment of the altered environment. All learning environments are complex, and arguably, there is difficulty in drawing global conclusions from any setting. The stinging nettles for research in ICT education are identified here as being (1) ICT as an agent of learning, (2) site specificity, and (3) global improvement. ICT can be a positive agent in learning in both the attainment of knowledge and more effective outcomes, but the agency will not be evidenced in the same way by all students.
11.
ACKNOWLEDGEMENTS
I would like to thank my Research guide Mr. Sanjeev Thakur, Assistant Professor, Amity University, for always being the guiding force behind the conceptulisation of the report. My sincere gratitude towards DAV Public School, Sreshtha Vihar, and Madam Principal Mrs. PremLata Garg for allowing me to perform the anaylsis of Student‘s performance of her school.
12.
REFERENCES
[1]. Betts, J., Zau, A., Rice, L. (2003), ―Determinants of student achievement: new evidences from San Diego‖, Public Policy Institute of California, San Francisco.
[2]. Bhadwal, S.C., (1984). Effects of Interim Tests on the Performance and Test Anxiety of High School Students Following Programmed Instruction Material in a Segment of General Science, Ph.D. Edu., HPU, Fourth Survey of Research In Education(1983- 88).M.B Buch,. (Ed). New Delhi: NCERT.
[3]. Goldberg, A., Russell, M. and Cook, A. (2003). The effect of computers on student writing: A meta-analysis of studies from 1992-2002. Journal of Technology, Learning, and Assessment, 2
(1).www.jtla.org ,
http://www.literacytrust.org.uk/Research/ ICTreviews.html #motivation
[4]. Haveman, R., Wolfe, B. (1995), ―The Determinants of Children's Attainments: A Review of Methods and Findings‖. Journal of Economic Literature,
American Economic Association, vol. 33(4), pages 1829-1878.
[5]. Jeyamani, P. (1991). The effectiveness of the simulation model of teaching through Computer Assisted Instruction (CAI).Fifth Survey of Research in Education. M. B Buch,. (Ed). New Delhi: NCERT. P 1375.
[6]. Kanmani, M, Annaraja, P. (2009). Influence of self-esteem and Awareness of ICT on Academic Achievement of M.Edstudents.Edutracks, Volume-8 No.10
[7]. Rivkin, S. G., E. A. Hanushek, Kain, J. F. (2005), ―Teachers, schools and academic achievement‖. Econometrica, 73(2), 417–458.