Patient Related Outcome Measures 2018:9 197–209
Patient Related Outcome Measures
Dovepress
submit your manuscript | www.dovepress.com 197
M E T H O D O L O G Y open access to scientific and medical research
Open Access Full Text Article
Comparison of statistical approaches for analyzing
incomplete longitudinal patient-reported outcome
data in randomized controlled trials
Ines Rombach1,2
Crispin Jenkinson3
Alastair M Gray1
David W Murray2
Oliver Rivero-Arias4 1Health Economics Research Centre,
Nuffield Department of Population Health, University of Oxford, Oxford, UK; 2Nuffield Department
of Orthopaedics, Rheumatology and Musculoskeletal Sciences, University of Oxford, Oxford, UK; 3Health
Services Research Unit, Nuffield Department of Population Health, University of Oxford, Oxford, UK;
4National Perinatal Epidemiology Unit,
Nuffield Department of Population Health, University of Oxford, Oxford, UK
Purpose: Missing data are a potential source of bias in the results of RCTs, but are often unavoidable in clinical research, particularly in patient-reported outcome measures (PROMs). Maximum likelihood (ML), multiple imputation (MI), and inverse probability weighting (IPW) can be used to handle incomplete longitudinal data. This paper compares their performance when analyzing PROMs, using a simulation study based on an RCT data set.
Methods: Realistic missing-at-random data were simulated based on patterns observed during the follow-up of the knee arthroscopy trial (ISRCTN45837371). Simulation scenarios covered different sample sizes, with missing PROM data in 10%–60% of participants. Monotone and nonmonotone missing data patterns were considered. Missing data were addressed by using ML, MI, and IPW and analyzed via multilevel mixed-effects linear regression models. Root mean square errors in the treatment effects were used as performance parameters across 1,000 simulations.
Results: Nonconvergence issues were observed for IPW at small sample sizes. The performance of all three approaches worsened with decreasing sample size and increasing proportions of missing data. MI and ML performed similarly when the MI model was restricted to baseline variables, but MI performed better when using postrandomization data in the imputation model and also in nonmonotone versus monotone missing data scenarios. IPW performed worse than ML and MI in all simulation scenarios.
Conclusion: When additional postrandomization information is available, MI can be benefi-cial over ML for handling incomplete longitudinal PROM data. IPW is not recommended for handling missing PROM data in the simulated scenarios.
Keywords: missing data, repeated measures, patient-reported outcome measures, PROMS, multilevel mixed-effects models, multiple imputation, inverse probability weighting
Introduction
Repeated follow-up assessments are common in randomized controlled trials (RCTs).1,2
The multiple observations obtained from each participant are likely to be more corre-lated with one another than with the values between different individuals. Appropriate statistical analyses, such as mixed-effects linear regression, are needed to handle this aspect of longitudinal data.3–5
Although longitudinal data analysis is an important tool in medical research, the robustness of its results can be affected by missing data. Longitudinal follow-up data can be subject to monotone missingness, where no observations are available for a participant after a specific follow-up time point, such as when a patient drops out or withdraws from the trial. They can also be affected by intermittent missingness, where Correspondence: Ines Rombach
Health Economics Research Centre,
Nuffield Department of Population
Health, University of Oxford, Old Road Campus, Oxford, OX3 7LF, UK Tel +44 1865 617 911
Email [email protected]
Journal name: Patient Related Outcome Measures Article Designation: METHODOLOGY Year: 2018
Volume: 9
Running head verso: Rombach et al
Running head recto: Analyzing incomplete longitudinal PROMs data DOI: http://dx.doi.org/10.2147/PROM.S147790
Patient Related Outcome Measures downloaded from https://www.dovepress.com/ by 118.70.13.36 on 26-Aug-2020
For personal use only.
Dovepress
Rombach et al
missing data points are followed by observed data at later follow-ups.6 Often only a small subset of participants from
a longitudinal data set have follow-up data available at all time points.
Patient-reported outcome measures (PROMs) are instru-ments, often in questionnaire form, which include “any report coming directly from patients, without interpretation by physicians or others, about how they [the patients] func-tion or feel in relafunc-tion to a health condifunc-tion and its therapy.”7
Before they are used in research, PROMs undergo rigorous testing for validity, reliability, and robustness, to ensure that even small relevant changes in health-related quality of life can be measured and that measurement differences are not due to error or noise.8–11 These characteristics make PROMs
an important addition to objective measures, which may not fully capture the patient experience of a specific treatment or disease burden,12 and they are increasingly used in medical
research. However, PROMs are susceptible to being miss-ing, particularly in longitudinal follow-up.6,13,14 Missing data
patterns and mechanisms for PROMs may differ from those of clinical and more objective outcomes.
The literature provides numerous overviews of statistical methods to handle longitudinal data with missing observa-tions.1,6,15–19 Ad hoc missing data methods include deletion
methods, which discard observations with missing data, and single imputation methods, which carry the last observation forward.6,16,20,21 These methods are likely to cause bias and
generate overly precise standard errors (SEs). Although their use is generally discouraged, they are commonly used in the analysis of all RCTs, including those with longitudinal follow-up data.1,2,16,19,22–24
The use of model-based approaches, including maximum likelihood (ML) estimation,25 multiple imputation (MI), and
inverse probability weighting (IPW),26,27 is encouraged. Their
use is supported by their robust underlying methodology, easy implementation in standard statistical software, and use in RCT analyses to date.1,2,23
The literature offers few direct comparisons between the ML, MI, and IPW approaches for missing data. Guidance on best practice is limited, particularly for analyzing PROMs. It is important to understand which statistical approaches are most appropriate for the analysis of longitudinal RCT data, particularly with a focus on PROMs.
Missing data mechanisms
The literature distinguishes between three missing data mechanisms. When missing completely at random (MCAR), the probability of a value being missing is independent of
both the observed and unobserved data for this participant. When missing at random (MAR), the probability of data being missing depends on the values of other observed data, but is independent of the values of the missing data. When missing not at random (MNAR), the probability that data are missing is related to the underlying value of these data, and this dependence remains to some extent even when the observed data are taken into account.
Any analysis of MCAR data will produce unbiased results. Unbiased results can be obtained for MAR data if the analysis approach takes into account the variables related to the missing data mechanism. Analyses under an MNAR scenario are always biased if based on conventional statistical techniques which make MAR assumptions.
It is impossible to determine the underlying missing data mechanism using only observed data. Most approaches for handling missing data assume an MAR mechanism, and MAR data are used here. However, possible MNAR mecha-nisms should always be investigated in supporting sensitivity analyses, as emphasized later.
Statistical methods considered in this
simulation study
The methodology and implementation of ML, MI, and IPW are explained briefly here and in detail elsewhere.6,16,24,26–28,30–32
The ML approach “implicitly impute[s] the unobserved data”6 to estimate model parameters.16,28,30 It uses all of the
observed data for the relevant outcome collected within the relevant follow-up, provided that baseline covariate data are also available where applicable. Parameter estimates are obtained through an iterative process to maximize the likelihood of producing the sample data.16 The observed data
points are used to make inferences about any missing data. MI is a common simulation-based technique for handling and analyzing missing data. It is generally described as a three-step process.24,32 First, an “imputation model” is created,
which regresses the variable to be imputed on a set of vari-ables that are predictive of the missing outcome. Imputations are drawn at random from the posterior distribution of this model. This process is repeated to generate multiple complete data sets. Second, each data set is analyzed separately using an identical prespecified statistical method. The results of these analyses differ only because the imputed observations differ. Third, the results are pooled using Rubin’s rule.33
Including the variation across the imputed data sets reflects the uncertainty around the imputed values.6,24,34,35 MI uses all
of the observed outcome data for the relevant variable and assumes that the data are MAR.
Patient Related Outcome Measures downloaded from https://www.dovepress.com/ by 118.70.13.36 on 26-Aug-2020
Dovepress Analyzing incomplete longitudinal PROMs data
MI can be used in cross-sectional settings and to impute missing baseline or follow-up data in RCTs and observational studies. If several variables include missing observations, MI can be applied separately or using an approach such as MI by chained equation (MICE), which facilitates the simultaneous imputation of several incompletely observed variables. In this simulation study, we use MICE to handle missing longitudinal data.
IPW is traditionally used in survey studies. Observations with a low probability of being included in the survey are given a higher weight in the analysis model to mitigate against bias introduced by the sampling design.36,37 However, the
technique has also gained popularity in the handling of miss-ing data.26,27,31 The rationale for using IPW in the presence of
missing data is that the subset of participants with complete data for all covariates and follow-up time points, called the complete-cases subset, may not be representative of the full data set. The complete-cases data subset is analyzed under IPW, but the cases are weighted differentially to adjust for the bias that would be introduced by a conventional complete-cases analysis.28 Complete cases that have a low probability
of being observed due to missing data in comparable par-ticipants are given a higher weight in the analysis compared with those with a high probability of being observed. This accounts for the participants who cannot be included in the analysis model due to missing data. However, IPW may pro-duce biased results if a small subgroup of participants has a very low probability of having missing data.18
Hypotheses for this work
The three statistical approaches discussed in this paper (ML, MI, and IPW) all assume an MAR mechanism, but differ in important aspects. Under ML, inferences about missing data are restricted to variables contained in the analysis model. In contrast, the IPW missingness model and MI imputation model are independent from the analysis models and can use information from other variables in the data set, including postrandomization information. This can make the MAR mechanism more plausible38 and may produce less biased
estimates.37
ML and MI use all of the available follow-up data col-lected within the relevant time frame for a particular outcome, provided that any relevant covariate data are also nonmissing. In contrast, some observed data are discarded in IPW, which may increase bias and decrease precision around the results.
We hypothesized that MI would produce the best (ie, least biased) results when other variables outside the analysis model are available to predict missing values. MI and ML
were expected to perform similarly if the imputation model was unable to include variables outside the analysis model that were predictive of the missing outcomes. As IPW can potentially discard large amounts of available information, it was expected to produce inferior results than those of its comparators when analyzing RCTs with no more than 1,000 participants.
Aims of this research
This research aimed at directly comparing the performances of ML, MI, and IPW when handling missing longitudinal PROM data in RCT analyses, using simulations based on the data from an RCT. The three approaches are all well established and can be routinely implemented in standard statistical software. The simulation study also aimed at gen-erating guidance on the most appropriate analysis approach for a range of sample sizes, missing data prevalence, and auxiliary data availability.
Methods
Case study
This simulation study was based on data collected within the knee arthroscopy trial (KAT).40,41 KAT is a large multicenter
RCT considering the clinical and cost-effectiveness of new developments in knee replacements. KAT was designed as a partial factorial pragmatic trial. Participants were random-ized to at least one of four comparisons: patellar resurfacing versus no patellar resurfacing; mobile versus fixed bearing; all-polyethylene versus metal-backed tibial components; and unicompartmental versus total knee replacements. This simulation study used data from only the patellar resurfacing versus no patellar resurfacing comparison.
Long-term follow-up of >10 years is ongoing for KAT. This simulation study used data over the initial 5-year follow-up and included only participants with fully observed baseline and outcome data. Outcome assessments were performed at 3 months, 1 year, and yearly thereafter. In total, 983 partici-pants had completely observed data for the relevant PROM.
Design of the simulation exercise
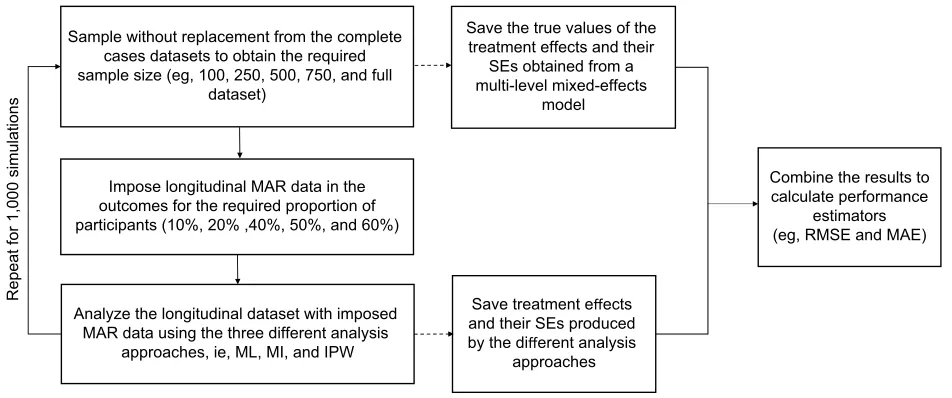
Figure 1 provides the overview of the simulation study. Simulations started with a complete data set (no missing data) of the relevant sample size, from which estimates of the treatment effects and corresponding SEs were obtained. A prespecified proportion of MAR data was then introduced in the PROM follow-up data. The different analysis approaches were applied to the data set with simulated incomplete follow-up. Treatment effects and corresponding SEs were
Patient Related Outcome Measures downloaded from https://www.dovepress.com/ by 118.70.13.36 on 26-Aug-2020
Dovepress
Rombach et al
estimated from the imputed data sets and compared with the “true” estimates obtained from the complete data sets. Here, we define “true” estimates as those calculated by using the multilevel mixed-effects model before the introduction of missing data, ie, the estimates that the various approaches for handling missing data aim at replicating. The simulation scenarios considered combinations of sample sizes (100, 250, 500, 750, and 983 participants) and proportions of participants with missing follow-up data (10%, 20%, 40%, 50%, and 60%).
This simulation study aimed at obtaining 1,000 valid imputation results for each scenario. The performance of the three approaches was measured by the root mean square error (RMSE) and mean absolute error (MAE) between the “true” and imputed treatment effect estimates, which is defined as follows:
RMSE = N1 N1 q qi i 2 i
ˆ
MAE = N1 N1q qi
i= −
∑
ˆiwhere N denotes the number of simulations run (1,000 where feasible), q the true value for the estimate of interest, and ˆθi the estimate of interest obtained from the ith simulation. The simulation work was performed in Stata/SE Version 14.39
Instruments
The 5-year follow-up data for a PROM, the Oxford Knee Score (OKS), are considered. The OKS assesses pain and
functional outcomes following knee replacement.42,43 Its 12
items are combined into a composite score ranging from 0 to 48, with higher scores indicating higher levels of function and less pain. Table 1 shows the mean OKS values observed for the participants in each trial arm at each relevant assess-ment time point.
Missing data simulation
Missing data were introduced into data sets with fully observed OKS data of the relevant sample size. For the major-ity of simulations, mixtures of monotone and intermittently missing data, based on the eight most commonly observed missing data patterns in the KAT (Table 2), were imposed for the relevant proportion of participants. Additional simu-lations explored monotone missing data patterns, in which participants were equally likely to drop out at any of the follow-up time points.
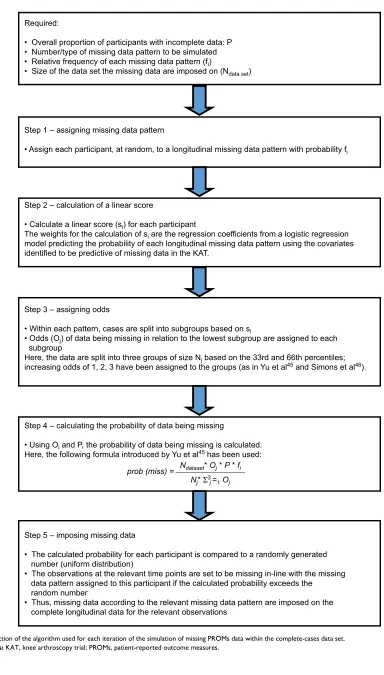
MAR data were simulated using an algorithm proposed by van Buuren et al44 and outlined by Yu et al45 and Simons
et al.46 This algorithm allows researchers to vary the
miss-ing data patterns and the percentage of participants with missing data. Figure 2 outlines the steps the implementation followed. Missing data were generated for 5%, 10%, 20%, 30%, 40%, 50%, and 60% of participants. Sample sizes of 100, 250, 500, and 750 and the maximum sample avail-able were considered. Smaller sample sizes were obtained by sampling the required number of participants from the full data set without replacement before simulating the missing data.
Figure 1 Design of the simulation study.
Abbreviations: IPW, inverse probability weighting; MAE, mean absolute error; MAR, missing at random; MI, multiple imputation; ML, maximum likelihood; RMSE, root mean square error; SE, standard error.
Repeat for 1,000 simulation
s
Impose longitudinal MAR data in the outcomes for the required proportion of participants (10%, 20% ,40%, 50%, and 60%)
Save treatment effects
and their SEs produced by the different analysis
approaches
Combine the results to calculate performance
estimators (eg, RMSE and MAE) Sample without replacement from the complete
cases datasets to obtain the required sample size (eg, 100, 250, 500, 750, and full
dataset)
Save the true values of the treatment effects and their
SEs obtained from a multi-level mixed-effects
model
Analyze the longitudinal dataset with imposed MAR data using the three different analysis
approaches, ie, ML, MI, and IPW
Patient Related Outcome Measures downloaded from https://www.dovepress.com/ by 118.70.13.36 on 26-Aug-2020
Dovepress Analyzing incomplete longitudinal PROMs data
The MAR mechanism was based on logistic regression models using baseline variables and follow-up PROM infor-mation, where relevant, to predict whether participants fell into a specific missing data pattern. Explanatory variables were randomization allocation, OKS (baseline and follow-up where appropriate), age, gender, body mass index, American Society of Anesthesiologists’ physical status classification, randomizing center size (small/medium/large), postoperative complications, and adherence to the randomized procedure. The coefficient estimates for each covariate were used in the algorithm to generate missing data.
The effects of a different MAR mechanism were also investigated in a “stronger MAR” scenario. The coefficient estimates used in the logistic regression model for determin-ing the probability of participants havdetermin-ing missdetermin-ing data were changed. The coefficients of covariates outside the analysis model were increased threefold, while the coefficients included in the analysis model were halved.
Analysis approaches
The longitudinal PROM data were analyzed using a multilevel mixed-effects regression model to compare the PROM over time between the two randomization allocations. The statisti-cal model was based on the analysis prespecified for the KAT study. It was adjusted for randomization allocation, baseline OKS, gender, age, and follow-up time point (implemented as a dummy variable for each year, using the 1-year follow-up
as the reference category). Nonlinear terms or interactions were not used. Although the KAT analysis included interac-tions between treatment and time,41 they were excluded from
this simulation because the main focus was estimating the overall treatment effect using the three approaches. The model included a random intercept and random slope, was fitted using an ML approach, and used an unstructured covariance.
The MI and IPW missingness models included all of the variables in the analysis model, as well as those used to generate the missing data. For exploratory simulations, two more PROMs collected in the trial, the EuroQol 5 Dimen-sion 3 Level questionnaire (EQ-5D-3L)47 and 12-Item Short
Form Health Survey (SF-12) physical component score,48,49
were also included. Both were assumed to be fully observed. Missing composite scores were replaced with values obtained from a single imputation. Imputations for each time point were based on relevant baseline data and available OKS, SF-12, and EQ-5D follow-up data. The IPW missingness model included the composite PROM scores at baseline and 5-year follow-up. The MI model used all of the baseline and follow-up PROM scores.
Imputations were run separately by treatment arm.24,50 MI
used MICE and a predictive mean matching approach. For the IPW approach, the missingness model was used to estimate the probability of missing follow-up data for each participant, using a logistic regression model with the outcome variable indicating if any follow-up data were missing. The inverse of Table 1 Mean OKSs across the follow-up in the subset of participants with completely observed outcome data
Assessment time point
No patellar resurfacing Patellar resurfacing Total
n Mean (SD) n Mean (SD) n Mean (SD)
Baseline 492 18.7 (7.4) 491 18.9 (7.3) 983 18.8 (7.3)
3 months 492 31.8 (9.2) 491 32.3 (9.4) 983 32 (9.3)
1 year 492 35.7 (9.7) 491 35.6 (9.5) 983 35.6 (9.6)
2 years 492 36.3 (10) 491 36.2 (10) 983 36.3 (10)
3 years 492 35.6 (10.1) 491 36.1 (9.9) 983 35.9 (10)
4 years 492 34.9 (10.3) 491 35.6 (10.4) 983 35.3 (10.4)
5 years 492 34.9 (10.3) 491 35.6 (10.4) 983 35.3 (10.3)
Abbreviation: OKS, Oxford Knee Score.
Table 2 Longitudinal missing data pattern observed in the case study and imposed on the complete data set
Missingness pattern Total Observed in trial %* % used in simulation Cumulative %
No follow-up data available 62 13.51 22.06 22.06
Only 3-month data missing 49 10.68 17.44 39.50
Only 5-year data missing 46 10.02 16.37 55.87
Data available to year 1 34 7.41 12.10 67.97
Data available to year 2 26 5.66 9.25 77.22
Only 4-year data missing 23 5.01 8.19 85.41
Only 3-year data missing 22 4.79 7.83 93.24
Data available to year 3 19 4.14 6.76 100.00
Note: *Missing data observed for participants still alive at 5 years.
Patient Related Outcome Measures downloaded from https://www.dovepress.com/ by 118.70.13.36 on 26-Aug-2020
Dovepress
Rombach et al
Figure 2 Depiction of the algorithm used for each iteration of the simulation of missing PROMs data within the complete-cases data set. Abbreviations: KAT, knee arthroscopy trial; PROMs, patient-reported outcome measures.
Required:
• Overall proportion of participants with incomplete data: P • Number/type of missing data pattern to be simulated
• Relative frequency of each missing data pattern (fi)
• Size of the data set the missing data are imposed on (Ndata set)
Step 1 – assigning missing data pattern
• Assign each participant, at random, to a longitudinal missing data pattern with probability fi
Step 2 – calculation of a linear score
• Calculate a linear score (si) for each participant
The weights for the calculation of si are the regression coefficients from a logistic regression
model predicting the probability of each longitudinal missing data pattern using the covariates identified to be predictive of missing data in the KAT.
Step 3 – assigning odds
• Within each pattern, cases are split into subgroups based on si
• Odds (Oj) of data being missing in relation to the lowest subgroup are assigned to each
subgroup
Here, the data are split into three groups of size Nj based on the 33rd and 66th percentiles;
increasing odds of 1, 2, 3 have been assigned to the groups (as in Yu et al45 and Simons et al46).
Step 4 – calculating the probability of data being missing
• Using Oi and P, the probability of data being missing is calculated.
Here, the following formula introduced by Yu et al45 has been used:
Step 5 – imposing missing data
• The calculated probability for each participant is compared to a randomly generated number (uniform distribution)
• The observations at the relevant time points are set to be missing in-line with the missing data pattern assigned to this participant if the calculated probability exceeds the random number
• Thus, missing data according to the relevant missing data pattern are imposed on the complete longitudinal data for the relevant observations
prob (miss) = Ndataset* Oj * P * fi Nj* Σ3 j=1Oj
Patient Related Outcome Measures downloaded from https://www.dovepress.com/ by 118.70.13.36 on 26-Aug-2020
Dovepress Analyzing incomplete longitudinal PROMs data
this probability was used as the weight in the IPW analysis model (subject-specific weight), which used only cases with completely observed OKS outcome data.
The MI and IPW approaches were analyzed by using the same multilevel mixed-effects regression model described above, except that the MI approach analyzed the imputed data, and the IPW approach analyzed the complete-cases sub-set using subject-specific weights to account for missing data.
The Stata commands “mixed” and “mi impute” were used to implement the statistical models.
Ethics approval
Approval for the KAT study was obtained from the Multi-Research Ethics Committee for Scotland (research protocol MREC/98/0/100 – November 1998, ISRCTN45837371) and from the Local Research Ethics Committees at each study site recruiting participants. All the participants gave written informed consent prior to being included in the study. No additional ethics approval was required for the performance of this simulation study.
Results
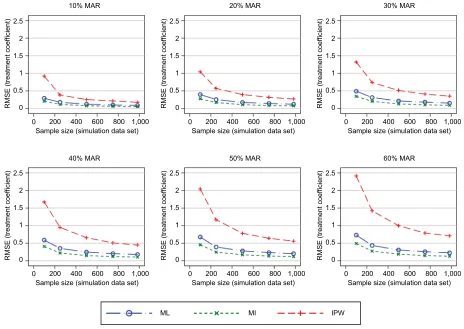
In general, the results consistently showed that the RMSE (and MAE) increased with increasing proportions of missing
data and decreasing sample sizes (Figures 3–5). The graphs presented in these figures show the RMSE and SE results, while the MAE results are presented in the Supplementary materials. For clarity, separate plots are provided for the dif-ferent proportions of missing data.
Feasibility of the analysis approaches
The ML approach could obtain valid results in all simulation scenarios. A negligible proportion of the MI models did not converge. Valid results could not be obtained for ~20% of the IPW simulations for a sample size of 100 with 10% missing data, ~3% for a sample size of 100 with 20% missing data, and ~1% for a sample size of 250 with 10% missing data. Very low proportions of invalid results were observed for the remaining simulations for a sample size of 100.
Performance of the different analysis
approaches
The first simulation scenario considered the observed patterns of missing data. Figure 3 shows the RMSEs introduced into the treatment effects. The ML and MI approaches performed very similarly, irrespective of the sample size or proportion of missing data. The IPW approach consistently resulted in worse RMSEs compared with the ML and MI approaches.
Figure 3 RMSE of the estimated treatment coefficient using the observed missing data pattern.
Abbreviations: IPW, inverse probability weighting; MAR, missing at random; MI, multiple imputation; ML, maximum likelihood; RMSE, root mean square error.
10% MAR 20% MAR
0 0 0.5 1 1.5 2 2.5
RMSE (treatment coef
ficient
)
200 400 600 800 1,000
Sample size (simulation data set) 0 0 0.5 1 1.5 2 2.5
RMSE (treatment coef
ficient)
200 400 600 800 1,000 Sample size (simulation data set)
30% MAR
0 0 0.5 1 1.5 2 2.5
RMSE (treatment coef
ficient)
200 400 600 800 1,000 Sample size (simulation data set)
40% MAR
0 0 0.5 1 1.5 2 2.5
RMSE (treatment coef
ficient
)
200 400 600 800 1,000
ML MI IPW
Sample size (simulation data set)
50% MAR
0 0 0.5 1 1.5 2 2.5
RMSE (treatment coef
ficient
)
200 400 600 800 1,000 Sample size (simulation data set)
60% MAR
0 0 0.5 1 1.5 2 2.5
RMSE (treatment coef
ficient
)
200 400 600 800 1,000 Sample size (simulation data set)
Patient Related Outcome Measures downloaded from https://www.dovepress.com/ by 118.70.13.36 on 26-Aug-2020
Dovepress
Rombach et al
The difference between the performance of the IPW approach and of the ML and MI approaches was more pronounced for smaller sample sizes. The same patterns were observed when using the MAE as a performance measure (see the
Supplementary materials).
Figure 6 presents the SEs for the treatment effects. The ML and MI approaches produced SEs that were very similar to the true SEs. The IPW approach produced elevated SEs, particularly under scenarios with both higher proportions of missing data and smaller sample sizes.
Similar patterns for all three performance measures were observed for the three approaches for handling missing data under the “stronger MAR” scenario (see the Supplementary materials).
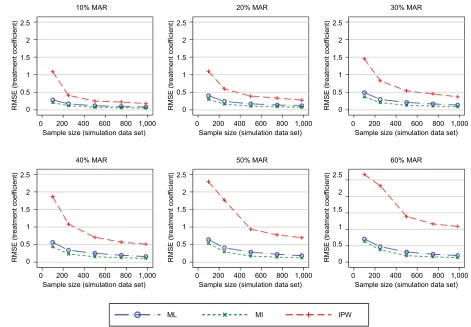
Further simulations added more PROM follow-up data (SF-12 and EQ-5D-3L) into the MI and IPW models. The MI approach introduced smaller RMSEs into the treatment effects compared with the ML approach when the original missing data pattern (a mixture of intermittent and monotone missingness) was maintained. The IPW approach intro-duced similar RMSEs in this and the previous simulations ( Figure 4). When considering a scenario with only monotone
missingness, the differences in the RMSEs introduced by the MI approach decreased marginally, particularly for large proportions of participants with missing follow-up data ( Figure 5), compared with intermittent missing data patterns. IPW produced greater errors than the other approaches.
The MAE in the estimated treatment effects was also used to measure the performance of the three approaches when handling missing data. The results for the MAE (shown in the Supplementary materials) were consistent with those presented above for the RMSE. Estimates of the SE of the treatment effects remained consistent across the simulation scenarios considered.
Discussion
This paper aimed at comparing the performance of the three approaches for analyzing longitudinal PROMs with some missing data: ML, MI, and IPW. These approaches are all well established and straightforward to implement using standard statistical software.
The simulation results obtained from ML and MI were very similar under MAR, when the MI model took into
Figure 4 RMSE of the estimated treatment coefficient adding the SF-12 and EQ-5D-3L to the MI and IPW models.
Abbreviations: EQ-5D-3L, EuroQol 5 Dimension 3 Level questionnaire; IPW, inverse probability weighting; MAR, missing at random; MI, multiple imputation; ML, maximum
likelihood; RMSE, root mean square error; SF-12, 12-Item Short Form Health Survey. 0
10% MAR 20% MAR 30% MAR
40% MAR 50% MAR 60% MAR
0 0.5 1 1.5 2 2.5
RMSE (treatment coef
ficient
)
200 400 600 800 1,000
Sample size (simulation data set) 0 0 0.5 1 1.5 2 2.5
RMSE (treatment coef
ficient
)
200 400 600 800 1,000
Sample size (simulation data set) 0 0 0.5 1 1.5 2 2.5
RMSE (treatment coef
ficient
)
200 400 600 800 1,000 Sample size (simulation data set)
0 0 0.5 1 1.5 2 2.5
RMSE (treatment coef
ficient
)
200 400 600 800 1,000
Sample size (simulation data set) 0 0 0.5 1 1.5 2 2.5
RMSE (treatment coef
ficient
)
200 400 600 800 1,000
Sample size (simulation data set) 0 0 0.5 1 1.5 2 2.5
RMSE (treatment coef
ficient
)
200 400 600 800 1,000 Sample size (simulation data set)
ML MI IPW
Patient Related Outcome Measures downloaded from https://www.dovepress.com/ by 118.70.13.36 on 26-Aug-2020
Dovepress Analyzing incomplete longitudinal PROMs data
account baseline data, data collected early in the trial, and the relevant outcome scores. These results agree with the existing literature.34,50 However, when the MI model included
additional auxiliary variables collected over the follow-up period of the study, MI performed better than ML. This is an important finding as RCTs commonly collect information on a number of different PROMs, as well as clinical information such as clinical assessments, readmissions, and complica-tions. This information should be used in MI models, where appropriate. Using auxiliary variables can also make the MAR assumption, on which all these three approaches rely, more plausible,38 particularly when some missing data are
related to a change in health states.51 In such scenarios, MI
should be favored over ML.
The MI model including auxiliary variables performed slightly worse with monotone missing data than with inter-mittently missing data. This finding emphasizes the impor-tance of continued data collection and including all collected data in the analysis.
IPW performed notably worse than its comparators, in terms of both bias and variability around the estimates
of the treatment effects. IPW potentially uses only a small subset of the observed outcome data. In line with the current literature, we do not recommend using IPW as implemented here to handle missing longitudinal PROM data in RCTs.52
Some convergence issues were observed for the IPW models for small sample sizes, as the same statistical models were used across all simulation scenarios. Outside the context of a simulation study, models should be tailored to the data avail-able and simplified for smaller sample sizes, as appropriate.
The differences in the performance measures for the three approaches are relatively small. They lie within the measure-ment error of the PROM and do not exceed its minimal impor-tant difference, which have been estimated at 4 and 5 points, respectively.10 These differences are unlikely to be clinically
meaningful. However, many trials are powered to detect small differences between treatment arms. For example, the KAT study was powered to detect a 1.5 point difference in the OKS for the patella resurfacing comparison.40 Thus, even these
moderate differences can affect trial conclusions; they can be used to derive guidance on which approach for handling missing data to be used.
Figure 5 RMSE of the estimated treatment coefficient – considering dropouts only while also using the SF-12 and EQ-5D-3L as auxiliary variables in the MI and IPW models.
Abbreviations: EQ-5D-3L, EuroQol 5 Dimension 3 Level questionnaire; IPW, inverse probability weighting; MAR, missing at random; MI, multiple imputation; ML, maximum
likelihood; RMSE, root mean square error; SF-12, 12-Item Short Form Health Survey. 0
10% MAR 20% MAR 30% MAR
40% MAR 50% MAR 60% MAR
0 0.5 1 1.5 2 2.5
RMSE (treatment coef
ficient
)
200 400 600 800 1,000
Sample size (simulation data set) 0 0 0.5 1 1.5 2 2.5
RMSE (treatment coef
ficient
)
200 400 600 800 1,000
Sample size (simulation data set) 0 0 0.5 1 1.5 2 2.5
RMSE (treatment coef
ficient
)
200 400 600 800 1,000 Sample size (simulation data set)
0 0 0.5 1 1.5 2 2.5
RMSE (treatment coef
ficient
)
200 400 600 800 1,000
Sample size (simulation data set) 0 0 0.5 1 1.5 2 2.5
RMSE (treatment coef
ficient
)
200 400 600 800 1,000
Sample size (simulation data set) 0 0 0.5 1 1.5 2 2.5
RMSE (treatment coef
ficient
)
200 400 600 800 1,000 Sample size (simulation data set)
ML MI IPW
Patient Related Outcome Measures downloaded from https://www.dovepress.com/ by 118.70.13.36 on 26-Aug-2020
Dovepress
Rombach et al
Limitations
A limited number of missing data scenarios were consid-ered, and the maximum sample sizes were restricted by the number of complete cases in the trial that this simulation study is based on. However, sample sizes ranging from 100 to almost 1,000 participants were deemed representative of the vast majority of RCTs.
Most of the simulations considered the same missing data pattern, a mixture of intermittent and monotone missing-ness. Missing data patterns are likely to vary between trials and, to a smaller extent, between PROMs. Other patterns of missingness could have been investigated here. However, monotone and intermittently missing data are commonly observed in RCTs, and we believe that the patterns used, as well as the conclusions drawn, are generalizable to a large proportion of RCTs.
The simulation scenarios that added auxiliary PROM data in the MI and IPW approaches assumed that these PROMs were completely observed, which may not have been realistic. However, most RCTs collect information on several PROMs, which are likely to have different completion rates. More
resources may be spent on ensuring high completion rates for the primary or key secondary outcome measures, eg, through follow-ups by telephone. It is also possible that RCT participants are more inclined to complete shorter question-naires or those they consider more relevant to themselves. Different follow-up schedules may be used for different PROMs, and those collected more frequently can be used to make inferences about missing data in other questionnaires. Information on clinical assessments, readmissions, additional treatment, or complications may be less prone to missing data and could be used in imputation models. In short, any available additional postrandomization information should be included in imputation models if deemed appropriate to reduce bias.
The ML, MI, and IPW approaches were implemented as described in the “Methods” section. These specifica-tions were included in this simulation study as they are well established, commonly used by the statistical community, and easily implementable using standard statistical software. Other specifications of these models are possible, but were not considered here. IPW performed worse than ML and MI
Figure 6 SE of the estimated treatment coefficient using the observed missing data pattern.
Abbreviations: IPW, inverse probability weighting; MAR, missing at random, MI, multiple imputation; ML, maximum likelihood; SE, standard error.
10% MAR 20% MAR
0 0 0.5 1 1.5 2 2.5
SE (treatment coef
ficient
)
200 400 600 800 1,000 Sample size (simulation data set)
0 0 0.5 1 1.5 2 2.5
SE (treatment coef
ficient
)
200 400 600 800 1,000 Sample size (simulation data set)
30% MAR
0 0 0.5 1 1.5 2 2.5
SE (treatment coef
ficient
)
200 400 600 800 1,000 Sample size (simulation data set)
40% MAR 50% MAR
0 0 0.5 1 1.5 2 2.5
SE (treatment coef
ficient
)
200
ML MI IPW True SE
400 600 800 1,000
Sample size (simulation data set) 0 0 0.5 1 1.5 2 2.5
SE (treatment coef
ficient
)
200 400 600 800 1,000 Sample size (simulation data set)
60% MAR
0 0 0.5 1 1.5 2 2.5
SE (treatment coef
ficient
)
200 400 600 800 1,000 Sample size (simulation data set)
Patient Related Outcome Measures downloaded from https://www.dovepress.com/ by 118.70.13.36 on 26-Aug-2020
Dovepress Analyzing incomplete longitudinal PROMs data
here, possibly because the IPW approach implemented did not use data from participants with any missing follow-up data. Other implementations of IPW have been suggested, including a stratification approach to account for different missing data patterns, which may be due to differences in patient characteristics; however, this approach is only thought to be appropriate if the number of missing data patterns is small.26 Doubly robust IPW approaches,37 or IPW
incor-porating some imputations,27,31 have also been suggested
as alternatives. However, as the implementations for these approaches are complex and not routinely available in stan-dard statistical software, they did not match the criteria for methods compared here.
The simulation studies presented here are restricted to the KAT study and the OKS. Validation in other PROMs could be beneficial. However, the OKS shares characteristics with many composite-score PROMs: it is used as a continuous score, baseline variables have some predictive ability for the OKS at follow-up, and there is moderate correlation between the OKS and other PROMs collected at follow-up. The results of the simulations using the OKS are thus likely to be generalizable to many other PROMs.
This work did not consider the effect of MNAR mecha-nisms or misspecifications of the analysis model on the performance of the three approaches. As misspecification and MNAR can occur in a number of ways, the effect of different misspecifications or different MNAR mechanisms may have very different effects on the performance of the three approaches for handling missing data in longitudinal data sets. We therefore avoided general statements about the performance of the investigated analysis approaches that may not be applicable to all MNAR and misspecification scenarios, which could lead to underestimating the bias intro-duced through missing data. The effects of MNAR scenarios should be investigated for all analyses on incomplete data in appropriate sensitivity analyses, as recommended in the literature.29,51,53–55
Conclusion
This simulation study directly compared the performances of ML, MI, and IPW in handling incomplete PROM data in a longitudinally collected data set from an RCT. The IPW model performed worse than the ML and MI approaches, introducing greater RMSE and MAE. It should therefore not be used for the analysis of similar small RCT data sets, especially when some missing outcome data are observed for ≥30% of participants.
ML and MI perform similarly under MAR when no additional follow-up data are available. However, if auxiliary PROMs have been more completely observed during follow-up than the PROM of primary interest, or other postrandom-ization data are available, then MI performs better and should be favored over non-imputation-based ML approaches. As both approaches assume an MAR mechanism, additional sensitivity analyses considering MNAR scenarios should be conducted to supplement the primary analysis.
Availability of data and materials
The data used for this simulation work were collected as part of the KAT study. As the authors obtained permission to use the data for prespecified analyses and simulation studies performed as part of Ines Rombach’s doctoral thesis, the data set cannot be made publicly available. Data requests should be directed to the trial coordinating office, the Health Services Research Unit at the University of Aberdeen. The simulation work was performed in Stata and is available from the cor-responding author upon request.Acknowledgments
We are very grateful to the KAT study group for providing data for this methodological work. We recognize the contri-butions of all of the KAT investigators, collaborators, and those who coordinated the KAT study. We also thank all of the trial participants and the National Institute for Health Research – Health Technology Assessment who funded the KAT. We acknowledge English language editing by Jennifer A de Beyer.
This research is part of Ines Rombach’s doctoral thesis, and financial support was provided entirely by a Medical Sciences Graduate School Studentship from the Medical Research Council and the Department of Population Health, University of Oxford (Grant Number: MR/J500501/1).
This work was previously presented in the follow-ing conferences: 1) Rombach I, Gray AM, Jenkinson C, Rivero-Arias O. To impute or not to impute? A comparison of statistical approaches for analyzing missing longitudinal patient reported outcome data in randomized controlled tri-als. PROMs Research Conference; June 2017; Oxford, UK. 2) Rombach I, Gray AM, Jenkinson C, Rivero-Arias O. A comparison of statistical approaches for analyzing miss-ing longitudinal patient reported outcome data in RCTs. 4th International Clinical Trials Methodology Conference (ICTMC) and the 38th Annual Meeting of the Society for Clinical Trials (SCT); May 2017; Liverpool, UK.
Patient Related Outcome Measures downloaded from https://www.dovepress.com/ by 118.70.13.36 on 26-Aug-2020
Dovepress
Rombach et al
Disclosure
All authors are employed by the University of Oxford. The funding agreement ensured the authors’ independence in designing the study, interpreting the data, and writing and publishing the report. The authors report no other conflicts of interest in this work.
References
1. Bell ML, Fiero M, Horton NJ, Hsu CH. Handling missing data in RCTs; a review of the top medical journals. BMC Med Res Methodol. 2014;14:118.
2. Rombach I, Rivero-Arias O, Gray AM, Jenkinson C, Burke O. The current practice of handling and reporting missing outcome data in eight widely used PROMs in RCT publications: a review of the current literature. Qual Life Res. 2016;25(7):1613–1623.
3. Beunckens C, Molenberghs G, Kenward MG. Direct likelihood analy-sis versus simple forms of imputation for missing data in randomized clinical trials. Clin Trials. 2005;2(5):379–386.
4. Mallinckrodt CH, Clark SW, Carroll RJ, Molenbergh G. Assessing response profiles from incomplete longitudinal clinical trial data under regulatory considerations. J Biopharm Stat. 2003;13(2):179–190. 5. White IR, Moodie E, Thompson SG, Croudace T. A modelling strategy
for the analysis of clinical trials with partly missing longitudinal data.
Int J Methods Psychiatr Res. 2003;12(3):139–150.
6. Bell ML, Fairclough DL. Practical and statistical issues in missing data for longitudinal patient-reported outcomes. Stat Methods Med Res. 2014;23(5):440–459.
7. Patrick DL, Burke LB, Powers JH, et al. Patient-reported outcomes to support medical product labeling claims: FDA perspective. Value Health. 2007;10 (Suppl 2):S125–S137.
8. Jenkinson C, Morley D. Patient reported outcomes. Eur J Cardiovasc Nurs. 2016;15(2):112–113.
9. Kazi AM, Khalid W. Questionnaire designing and validation. J Pak Med Assoc. 2012;62(5):514–516.
10. Beard DJ, Harris K, Dawson J, et al. Meaningful changes for the Oxford hip and knee scores after joint replacement surgery. J Clin Epidemiol. 2015;68(1):73–79.
11. Dawson J, Rogers K, Fitzpatrick R, Carr A. The Oxford shoulder score revisited. Arch Orthop Trauma Surg. 2009;129(1):119–123.
12. Lohr KN, Zebrack BJ. Using patient-reported outcomes in clinical practice: challenges and opportunities. Qual Life Res. 2009;18(1): 99–107.
13. Fielding S, Maclennan G, Cook JA, Ramsay CR. A review of RCTs in four medical journals to assess the use of imputation to overcome missing data in quality of life outcomes. Trials. 2008;9:51.
14. Gomes M, Gutacker N, Bojke C, Street A. Addressing missing data in patient-reported outcome measures (PROMS): implications for the use of PROMS for comparing provider performance. Health Econ. 2016;25(5):515–528.
15. Ibrahim JG, Molenberghs G. Missing data methods in longitudinal studies: a review. Test (Madr). 2009;18(1):1–43.
16. Enders CK. Analyzing longitudinal data with missing values. Rehabil Psychol. 2011;56(4):267–288.
17. Verbeke G, Fieuws S, Molenberghs G, Davidian M. The analysis of multivariate longitudinal data: a review. Stat Methods Med Res. 2014;23(1):42–59.
18. Faria R, Gomes M, Epstein D, White IR. A guide to handling missing data in cost-effectiveness analysis conducted within randomised con-trolled trials. Pharmacoeconomics. 2014;32(12):1157–1170. 19. Powney M, Williamson P, Kirkham J, Kolamunnage-Dona R. A review
of the handling of missing longitudinal outcome data in clinical trials.
Trials. 2014;15:237.
20. Mallinckrodt CH, Sanger TM, Dube S, et al. Assessing and interpreting treatment effects in longitudinal clinical trials with missing data. Biol Psychiatry. 2003;53(8):754–760.
21. Lachin JM. Fallacies of last observation carried forward analyses. Clin Trials. 2016;13(2):161–168.
22. Eekhout I, de Boer RM, Twisk JW, de Vet HC, Heymans MW. Miss-ing data: a systematic review of how they are reported and handled.
Epidemiology. 2012;23(5):729–732.
23. Lang KM, Little TD. Principled missing data treatments. Prev Sci. 2018;19(3):284–294.
24. White IR, Royston P, Wood AM. Multiple imputation using chained equations: issues and guidance for practice. Stat Med. 2011;30(4): 377–399.
25. Kenward MG, Lesaffre E, Molenberghs G. An application of maximum likelihood and generalized estimating equations to the analysis of ordinal data from a longitudinal study with cases missing at random. Biometrics. 1994;50(4):945–953.
26. Doidge JC. Responsiveness-informed multiple imputation and inverse probability-weighting in cohort studies with missing data that are non-monotone or not missing at random. Stat Methods Med Res. 2018;27(2): 352–363.
27. Seaman SR, White IR. Review of inverse probability weighting for dealing with missing data. Stat Methods Med Res. 2013;22(3):278–295. 28. Little RJA, Rubin DB. Statistical Analysis with Missing Data. 2nd ed.
Hoboken, NJ: John Wiley & Sons; 2002.
29. Mallinckrodt CH, Lane PW, Schnell D, Peng Y, Mancuso JP. Recommen-dations for the primary analysis of continuous endpoints in longitudinal clinical trials. Drug Inf J. 2008;42(4):303–319.
30. Carpenter JR, Kenward MG. Multiple Imputation and Its Application. 1st ed. Chichester: John Wiley & Sons; 2013.
31. Seaman SR, White IR, Copas AJ, Li L. Combining multiple imputation and inverse-probability weighting. Biometrics. 2012;68(1):129–137. 32. van Buuren S. Multiple imputation of discrete and continuous data
by fully conditional specification. Stat Methods Med Res. 2007;16(3): 219–242.
33. Rubin D. Multiple Imputation for Nonresponse in Surveys. New York, NY: Wiley & Sons; 1987.
34. Kenward MG, Carpenter J. Multiple imputation: current perspectives.
Stat Methods Med Res. 2007;16(3):199–218.
35. Fielding S, Fayers P, Ramsay CR. Analysing randomised controlled trials with missing data: choice of approach affects conclusions. Contemp Clin Trials. 2012;33(3):461–469.
36. Mansournia MA, Altman DG. Inverse probability weighting. BMJ. 2016;352:i189.
37. Carpenter JR, Kenward MG, Vansteelandt S. A comparison of multiple imputation and doubly robust estimation for analyses with missing data.
J R Stat Soc Ser A Stat Soc. 2006;169(3):571–584.
38. White IR, Kalaitzaki E, Thompson SG. Allowing for missing out-come data and incomplete uptake of randomised interventions, with application to an Internet-based alcohol trial. Stat Med. 2011;30(27): 3192–3207.
39. StataCorp. Stata Statistical Software: Release 14. College Station, TX: StataCorp LP; 2015.
40. KAT Trial Group, Johnston L, MacLennan G, McCormack K, Ramsay C, Walker A. The Knee Arthroplasty Trial (KAT) design features, baseline char-acteristics, and two-year functional outcomes after alternative approaches to knee replacement. J Bone Joint Surg Am. 2009;91(1):134–141. 41. Murray DW, MacLennan GS, Breeman S, et al. A randomised controlled
trial of the clinical effectiveness and cost-effectiveness of different knee prostheses: the Knee Arthroplasty Trial (KAT). Health Technol Assess. 2014;18(19):1–235, vii–viii.
42. Dawson J, Fitzpatrick R, Murray D, Carr A. Questionnaire on the per-ceptions of patients about total knee replacement. J Bone Joint Surg Br. 1998;80(1):63–69.
43. Murray DW, Fitzpatrick R, Rogers K, et al. The use of the Oxford hip and knee scores. J Bone Joint Surg Br. 2007;89(8):1010–1014.
Patient Related Outcome Measures downloaded from https://www.dovepress.com/ by 118.70.13.36 on 26-Aug-2020
Dovepress
Patient Related Outcome Measures
Publish your work in this journal
Submit your manuscript here: http://www.dovepress.com/patient-related-outcome-measures-journal
Patient Related Outcome Measures is an international, peer-reviewed, open access journal focusing on treatment outcomes specifically relevant to patients. All aspects of patient care are addressed within the journal and practitioners from all disciplines are invited to submit their work as well as healthcare researchers and patient support groups.
The journal is included in PubMed. The manuscript management system is completely online and includes a very quick and fair peer-review system. Visit http://www.dovepress.com/testimonials.php to read real quotes from published authors.
Dovepress
Analyzing incomplete longitudinal PROMs data44. Van Buuren S, Brand JPL, Groothuis-Oudshoorn CG, Rubin DB. Fully conditional specification in multivariate imputation. J Stat Comput Simul. 2006;76(12):1049–1064.
45. Yu LM, Burton A, Rivero-Arias O. Evaluation of software for mul-tiple imputation of semi-continuous data. Stat Methods Med Res. 2007;16(3):243–258.
46. Simons CL, Rivero-Arias O, Yu LM, Simon J. Multiple imputation to deal with missing EQ-5D-3L data: Should we impute individual domains or the actual index? Qual Life Res. 2015;24(4):805–815. 47. Oemar M, Oppe M. EQ-5D-3L User Guide – basic information on how
to use the EQ-5D-3L instrument, Version 5.0; 2013. Available from: http://www.euroqol.org/fileadmin/user_upload/Documenten/PDF/ Folders_Flyers/EQ-5D-3L_UserGuide_2013_v5.0_October_2013.pdf. Accessed October 1, 2014.
48. Jenkinson C, Layte R. Development and testing of the UK SF-12 (short form health survey). J Health Serv Res Policy. 1997;2(1):14–18. 49. Jenkinson C, Layte R, Jenkinson D, et al. A shorter form health survey:
can the SF-12 replicate results from the SF-36 in longitudinal studies?
J Public Health Med. 1997;19(2):179–186.
50. Sullivan TR, White IR, Salter AB, Ryan P, Lee KJ. Should multiple imputation be the method of choice for handling missing data in ran-domized trials? Stat Methods Med Res. Epub 2016 Jan 1.
51. Graham JW. Missing data analysis: making it work in the real world.
Ann Rev Psychol. 2009;60:549–576.
52. Horton NJ, Kleinman KP. Much ado about nothing: a comparison of missing data methods and software to fit incomplete data regression models. Am Stat. 2007;61(1):79–90.
53. Eekhout I, Enders CK, Twisk JW, de Boer MR, de Vet HC, Heymans MW. Including auxiliary item information in longitudinal data analyses improved handling missing questionnaire outcome data. J Clin Epide-miol. 2015;68(6):637–645.
54. Cornish RP, Tilling K, Boyd A, Davies A, Macleod J. Using linked educational attainment data to reduce bias due to missing outcome data in estimates of the association between the duration of breastfeeding and IQ at 15 years. Int J Epidemiol. 2015;44(3):937–945.
55. Permutt T. Sensitivity analysis for missing data in regulatory submis-sions. Stat Med. 2016;35(17):2876–2879.
Patient Related Outcome Measures downloaded from https://www.dovepress.com/ by 118.70.13.36 on 26-Aug-2020