OPTIMIZATION OF PROCESS PARAMETERS IN
LASER BENDING OF INCONEL-625 METAL SHEET
Nikesh Hembram
1, Jitendra Kumar Singh
2, Manowar Hussain
3, Mr.
Amitava Mandal
41,2
M.tech,
3JRF,
4Assistant Professor, Department of Mechanical Engineering,
ISM Dhanbad, Jharkhand, (India)
ABSTRACT
In recent years, laser beam forming has been a new and promising technique in manufacturing. Laser sheet
metal bending is a thermo mechanical process where a partially or defocused laser beam is used to induce
localized heating and consequently deflection of the sheet along with the incident beam occurs. This paper
presents a study on the bending behavior of inconel-625 sheet material which is highly tensile and has excellent
weldability and brazebility. An experimental investigation is performed for getting the bending of the material
by varying the laser power, beam diameter and scanning speed. In this study, a low power fiber laser was used
to bend inconel-625 sheet material. The experimental result shows that at lower values of laser power, the
bending angle tends to be almost negligible and with increasing laser power and scanning speed the bending
angle increases. Furthermore, the Taguchi experimental method has been employed with L-16 orthogonal array
and anova table has been used for statistical analysis.
Keywords
:
laser forming, laser bending, DOE, taguchi method
I. INTRODUCTION
Laser forming is a process of adding of plastic strain gradually to a metal component to generate desired bend
shape. Laser forming can be used to bend high strength metal such in this case inconel625. The laser forming is
a process which involves scanning a focused or partially defocused laser beam over the metal surface causing
heating along the bend line. By repeating laser beam over the surface, desired bend angles can be obtained. The
thermal gradients which is present in the material cause the sheet to bend towards or away from the laser source.
Previously laser bending on inconel625 sheet has not been performed. Some of the earliest works on the laser
forming process was first modeled by Vollertsen, Geiger and Li using both FEM and FDM [1]. D.P. Shidid[2]
studied the effects of process parameters on titanium sheet metal bending using Nd:YAG laser. Experimental
study and empirical modeling were carried out by Gollo et al. (2008)[3] in laser bending of sheet metal with a
bending angle using numerical simulations and experiments. Shichun and Jinsong (2001)[5] studied the effects
of different process parameters related to the laser source, material and work-piece geometry on bending angle
in laser bending of sheet metals. The laser energy parameters included laser power, scan speed, beam spot
diameter and number of scans. Marya and Edwards(2001)[5] investigated the laser forming of two titanium
alloys and developed and empirical model for bending angle and section thickness. Majumdar et al. (2004)[6]
investigated the effect of various process parameters on laser bending of AISI 304 stainless steel sheet using a
high power (2 kW) continuous wave CO
2 laser.
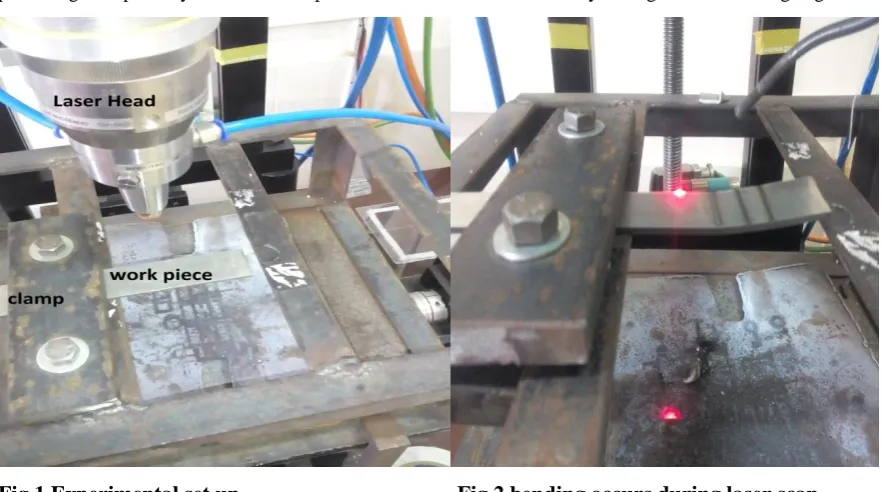
II. EXPERIMENTAL EQUIPMENT AND SET UP
A continuous Fiber laser with maximum laser power of 50- 400W with wavelength of 1070nm was used for the
experiments. The tests were performed focusing the laser beam on Inconel625 sheet with 200x25mm2 area and
2.0mm thickness. No coating was applied on the metal sheets. Argon gas was used as shielding gas for
protecting the optical system. Each sample is scanned 5 times continuously so to get better bending angle
.
Fig.1 Experimental set up
Fig.2 bending occurs during laser scan
Metal sheet had been clamped to make it fixed in the CNC table so that it metal sheet would not get disturbed
during experiment. The material composition of the inconel sheet is given in table1.
Table 1. Material Composition of Inconel 625
Ni Cr Fe Mo C Mn Si P S Al Ti Co
58%
20-23
5-0%
8-10%
Fig.3 w/p before laser scan
Fig4. w/p after laser scan beam
Fig5. Bevel protractor for measuring bending angles
For measuring the bending angles of the laser bend samples, bevel protractor was used. The samples were
observed in the optical microscope
.
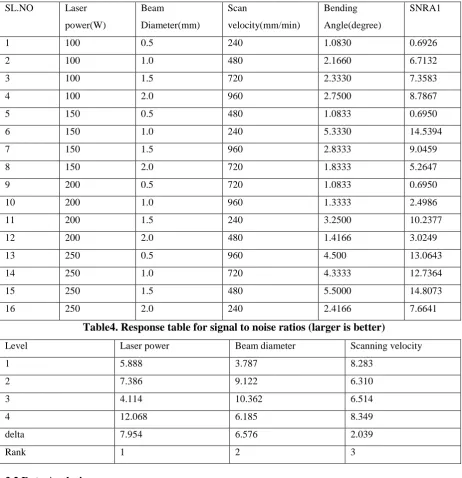
III. DESIGN OF EXPERIMENT
3.1 Taguchi Experiments
A set of experiments were performed to get the bending angle of metal sheet components formed by the laser.
The effects which were occurred by the parameters such as laser power, scan velocity and beam diameter on the
bending angle were investigated experimentally.
Taguchi experiments design were used to limit the experimental costs. A L-16 Taguchi array with three
parameters ( Laser power, Scanning speed and beam diameter) and four levels for each factor is given in tables
(2) and (3).
Table2. Control factors and their selected levels
Level 1 Level 2 Level 3 Level 4
Laser Power(W) 100 150 200 250
Beam
Diameter(mm)
0.5 1.0 1.5 2.0
Scanning
speed(mm/min)
Table 3. design of experiments by Taguchi method
SL.NO Laser
power(W)
Beam
Diameter(mm)
Scan
velocity(mm/min)
Bending
Angle(degree)
SNRA1
1 100 0.5 240 1.0830 0.6926
2 100 1.0 480 2.1660 6.7132
3 100 1.5 720 2.3330 7.3583
4 100 2.0 960 2.7500 8.7867
5 150 0.5 480 1.0833 0.6950
6 150 1.0 240 5.3330 14.5394
7 150 1.5 960 2.8333 9.0459
8 150 2.0 720 1.8333 5.2647
9 200 0.5 720 1.0833 0.6950
10 200 1.0 960 1.3333 2.4986
11 200 1.5 240 3.2500 10.2377
12 200 2.0 480 1.4166 3.0249
13 250 0.5 960 4.500 13.0643
14 250 1.0 720 4.3333 12.7364
15 250 1.5 480 5.5000 14.8073
16 250 2.0 240 2.4166 7.6641
Table4. Response table for signal to noise ratios (larger is better)
Level Laser power Beam diameter Scanning velocity
1 5.888 3.787 8.283
2 7.386 9.122 6.310
3 4.114 10.362 6.514
4 12.068 6.185 8.349
delta 7.954 6.576 2.039
Rank 1 2 3
3.2 Data Analysis
The bending angle which is influenced by parameters laser power, scan velocity and beam diameter usually
indicated by the ANOVA. ANOVA is used to investigate which bending parameters is affecting the response
and its effective contribution. The individual contribution of the process parameters that affecting the most and
Table5. ANOVA table for bending angle
Source DF Adj SS Adj MS F-Value P-Value
Laser power 3 13.8466 4.6155 2.47 0.159
Beam
diameter
3 7.5732 2.5244 1.35 0.344
Scanning
velocity
3 0.9770 0.3257 0.17 0.910
Error 6 11.2146 1.5691 - -
Total 15 33.6114 - - -
3.2.1 Effect of parameters on bending angle
Effects plots by the parameters can be used to to draw towards the conclusion on bending angle. These plots are
shown in figure6
.
Figure6. Main effects curve for S/N ratios
Figure 6 shows that how laser power has a significant effect on bending angle. As increase with the laser power,
bending angle also increases significantly. It can also seen from this figure that effect of the laser power is
proportional with the bending angle.
Figure6 also shows about the effects of beam diameter on bending angle. It can be seen that increasing rate of
bending angle is reduced by increasing beam diameter. It can also seen that bending angle is inversely
proportional to the beam diameter.
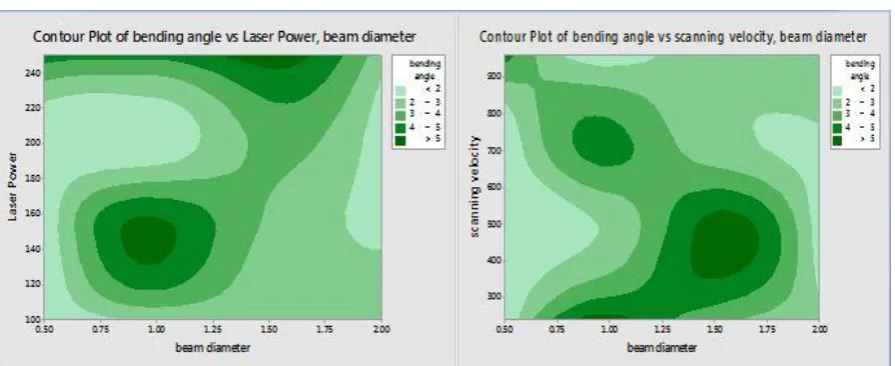
3.2.2 Effect of laser power and beam diameter on bending angle
Fig.7 contour plot of laser power and beam Fig.8 Contour plot of scan velocity and beam
Diameter on the bending angle diameter on bending angle
Figure7 shows the relationship between laser power and beam diameter. It can be seen from the figure that
maximum bending angle is obtained by high laser powers and at high beam diameter of 1.50mm approximately.
Effect of beam diameter and scan velocity on bending angle
Figure8 shows the interaction between beam diameter and scan velocity on bending angle. The maximum
bending angle is found at the increasing section of beam diameter and also at the higher scan velocity.
3.2.3 Effect of scan velocity and laser power on bending angle
0 5 2 0 0 2 2 150 4 300 6 600 100 900
ben ingd angle
r e w o P r e s a L y t i c o l e v g can s nin
urface Plot of bending angle vs Laser P
S ower, scanning velocity
Fig9. Surface plot of bending angle between laser power and scanning velocity
Figure 9 indicates about the interaction of laser power and scan velocity on bending angle. It can be seen that
3.2d Interaction plot for bending Angle
Figure10. Interaction plot for the bending angle
3.3 Regression analysis
This analysis is usually performed to find the relationship between the parameters and bending angle.
Bending angle(degree)=0.83-0.00027scanning velocity+0.138 beam diameter+0.01063 laser Power
The R2 value gives 66.63% which indicates this model can be used with sufficient accuracy
.
IV. CONCLUSION
In this paper laser bending of inconel625 sheet has been studied experimentally. The effects of main process
parameters including laser power, beam diameter and scan velocity on bending angle were investigated.
Bending angle is strongly affected by the parameter laser power and beam diameter. It increases as the laser
power and beam diameter increases.
Bending angle decreased with increasing of scanning velocity.
A formula is obtained using a regression analysis to obtain the bending angle.
REFERENCES
[1] Vollertsen, F., M. Geiger, and W. M. Li. "FDM and FEM simulation of laser forming: a comparative
study." Advanced Technology of Plasticity 3 (1993): 1793-1798.
[5] Gollo, M. Hoseinpour, S. M. Mahdavian, and H. Moslemi Naeini. "Statistical analysis of parameter
effects on bending angle in laser forming process by pulsed Nd: YAG laser." Optics & Laser
Technology 43.3 (2011): 475-482.
[6] Shichun, Wu, and Zheng Jinsong. "An experimental study of laser bending for sheet metals." Journal of
Materials Processing Technology 110.2 (2001): 160-163.
[7] Marya, M., and G. R. Edwards. "A study on the laser forming of near-alpha and metastable beta titanium
alloy sheets." Journal of materials processing technology 108.3 (2001): 376-383.
[8] Majumdar, J. Dutta, A. K. Nath, and I. Manna. "Studies on laser bending of stainless steel." Materials