Accepted 18 April 2013 Revised 09 April 2013 Received 18 October 2012 Indian J Pharm Sci 2013;75(3):368-372
Stability-indicating Method for the Estimation of Riluzole
in Tablets
T. NEEHA, P. BHARGAVI, A. ARUNA JYOTHI, G. DEVALARAO AND B. N. NALLURI*
Department of Pharmaceutical Analysis, K. V. S. R. Siddhartha College of Pharmaceutical Sciences, Pinnamaneni Polyclinic Road, Siddhartha Nagar, Benz Circle, Vijayawada-520 010, India
*Address for correspondence
E-mail: [email protected]
the lowest in the oil no. 1 (10.7%) as compared with the positive control (ascorbic acid) which showed 94% inhibition.
From the results of the present study, it may be concluded that the variations in % oil yield and physicochemical parameters of the extracted essential oils could be attributed to the quality of the exudates, their storage‑period, the type of packaging materials used and the temperature at the collection‑points of guggul exudates. The essential oils extracted from guggul exudates can be exploited as a source of antioxidant agent, besides their physicochemical parameters being comparable with the virgin oils.
ACKNOWLEDGMENTS
The authors acknowledge the financial support from Network Project on ‘Harvesting, Processing and Value Addition of Natural Resins and Gums’, ICAR, New Delhi. The technical assistance rendered by Sri D. D. Singh,
Senior Technical Officer, in determining physicochemical
parameters of essential oils and Dr. A. R. Chowdhury for FT‑IR spectra is gratefully acknowledged.
REFERENCES
1. Siddiqui MZ. Guggul: An excellent herbal panacea: A review. Asian J Pharm Health Sci 2011;1:35‑9.
2. Rehman SU, Ahmad MM, Kazmi ZH, Raza MS. Physico‑chemical variations in essential oils of Citrus reticulata. J Food Sci Technol 2007;44:353‑6.
3. Bhati A. Essential oil from the resin of Commiphora mukul, Hook. EX. Stocks. J Indian Chem Soc 1950;27:436‑40.
4. Kakrani HK. Physico‑chemical properties of seed oil of C. mukul. Indian Drugs 1982;19:339.
5. Kakrani HK, Bagi MK, Kalyani GA, Satyanarayan D, Manavi FV. Preliminary pharmacological activity of essential oil of C. mukul. Fitoterapia 1985;56:245.
6. Ali NAA, Wurster M, Arnold N, Lindequist U, Wessjohan L. Essential oil composition from oleo gum‑resin of Soqotrean Commiphora kua. Rec Nat Prod 2008;2:70‑5.
7. Craveiro A, Corsano S, Proietti G, Strappaghetti G. Constituents of essential oil of Commiphora guidoni. Planta Med1983;48:97‑8.
8. Morteza‑semnani K, Saeedi M. Constituents of the essential oil of
Commiphora myrrha (Nees) Engl. Var. molmol. J Essent Oil Res 2003;15:50‑1.
9. Singh K, Chander R, Kapoor NK. Guggulsterone, a potent hypolipidemic prevents oxidation of low density lipoproteins. Phytother Res 1997;11:291‑4.
10. Patel BH, Thakore S, Nagar PS. Chemical composition and characteristics of Commiphora wightii (Arnott) Bhandari seed oil. J Am Oil Chem Soc 2009;86:497‑8.
11. Anonymous. Official methods of analysis of the Association of Official Analytical Chemists. 17th ed. Washington, DC: Association of Official Analytical Chemists; 1997.
12. Govindarajan R, Vijayakumar M, Rao ChV, Rawat AK, Shirwaikar A, Mehrotra S, et al. Antioxidant potential of Anogeissus latifolia. Biol Pharm Bull 2004;27:1266‑9.
13. Billary MR. Suspensions and emulsions. In, Aulton ME, editor. Aulton’s Pharmaceutics: The design and manufacture of medicines, 3rd ed. Edinburgh: Churchill Livingstone; 2007. p. 383‑405.
14. Nouros PG, Georgiou CA, Polissiou MG. Direct parallel flow injection multichannel spectrophotometric determination of olive oil peroxide value. Anal Chim Acta1999;389:239‑45.
15. Deuel HJ. The lipids: Their chemistry and biochemistry, Vol. 1. New York: Interscience Publishers; 1951. p. 53‑7.
16. Selke SEM, Culter JD, Hernandez RJ. Plastics packaging: Properties, processing, applications and regulations, 2nd ed. Cincinnati: Hanser Publication; 2004.
17. Grube M, Muter O, Strikauska S, Gavare M, Limane B. Application of FT‑IR spectroscopy for control of the medium composition during the biodegradation of nitro aromatic compounds. J Ind Microbiol Biotechnol 2008;35:1545‑9.
18. Guillen MD, Nerea C. Infrared spectroscopy in the study of edible oils and fats. J Sci Food Agric 1997;75:1‑11.
19. Goburdhun D, Jhaumeer‑Laulloo SB, Musruck R. Evaluation of soy bean oil quality during conventional frying by FT‑IR and some chemical indexes. Int J Food Sci Nutr 2001;52:31‑42.
20. Vlachos N, Skopelitis Y, Psaroudaki M, Konstantinidou V, Chatzilazarou A, Tegou E. Application of Fourier transform‑ infrared spectroscopy to edible oils. Anal Chim Acta 2006;573‑574:459‑65.
21. Kemp W. Organic Spectroscopy. 3rd ed. New York: Palgrave Publisher; 1991.
22. Kalsi PS. Spectroscopy of organic compounds. 6th ed. New Delhi: New Age International Publishers; 2004.
Riluzole (RIL) is a glutamate antagonist used in the treatment of amyotrophic lateral sclerosis, a neurodegenerative disease[1]. RIL chemically is 2‑amino‑6‑trifluoromethoxy‑benzothiazole. In vivo, it has neuroprotective, anticonvulsant, and sedative properties[2]. Stability testing plays an important role in the drug development process. The purpose of these studies is to provide evidence on how the quality of drug substance or drug product varies with time under a variety of environmental conditions, for example temperature, humidity and light, which enables storage conditions, retest periods and shelf life to be recommended. Results of stress studies can facilitate stability indicating method (SIM) development, drug formulation design, selection of storage conditions and packaging, better understanding of potential liabilities of drug molecule chemistry and solving of stability‑related problems.
A recent literature survey revealed that very few high pressure liquid chromatography (HPLC)[3] methods were reported for the estimation of RIL in pharmaceutical formulations and in biological fluids[4‑6]. A few spectrophotometric methods for the determination of RIL in dosage forms[7,8] were also reported. None of the reported procedures enable estimation of RIL in the presence of its degradation products. This manuscript describes the development and validation of stability‑indicating reverse‑phase high‑pressure liquid chromatography method with photodiode arry detector (RP‑HPLC‑PDA) for the determination of RIL as bulk drug and in pharmaceutical dosage forms. The method enables the separation of drug from the degradation products under the stress conditions (hydrolysis, oxidation, photolysis and thermal). A rapid, robust and economic method was developed which separates the degradation products from the main RIL peak and
the method was validated as per ICH guidelines. The developed method is stability indicating and can be used for assessing the stability of RIL in bulk drugs and tablet formulations.
RIL was a gift sample from Veeda CR Las, Ahmedabad, India. Acetonitrile, water and formic acid were purchased from E. Merck, Mumbai, India. All the solvents and reagents are of HPLC grade. RIL tablets of Rilutor® 50 mg were commercially purchased. Chromatographic separation was performed on a Shimadzu LC‑20AD dual pump, DGU‑20A degasser, SPD‑M20A PDA detector, and SIL‑20A HT auto sampler. LC solution software was used for analyzing the data.
Mobile phase of 0.02% v/v formic acid: acetonitrile (35:65) at 1 ml/min flow rate was used and the mobile phase was filtered through membrane filter (Millipore Nylon disc filter of 0.45 μm) and sonicated for 5 min in ultrasonic bath before use. For quantitative analytical purpose wavelength was set at 260 nm and the Inertsil‑ODS column (250×4.6 mm) was used at ambient temperature.
Stock solution of RIL (1 mg/ml) was prepared using methanol. Appropriate volumes of this stock solution was then further diluted with the diluent, acetonitrile (ACN) to get the required concentrations of standard solutions at a concentration range of 10‑50 μg/ml. The method described above was validated as per the ICH guidelines[9] for the parameters like specificity, accuracy, linearity, precision, detection limit (LOD), quantitation limit (LOQ), and robustness.
For assay, 20 tablets were weighed and finely powdered and a powder quantity equivalent to 25 mg RIL was accurately weighed and transferred Neeha, et al.: Stability Indicating RP-HPLC-PDA Method for Riluzole
A stability-indicating reverse-phase high-pressure liquid chromatography method with photodiode array detector was developed and validated for estimation of riluzole in the bulk and tablet dosage forms. Riluzole was subjected to stress conditions (light, heat, humidity, acid/base hydrolysis and oxidation) and the stressed samples were analyzed by developed method. Degradation was observed in acidic, basic, oxidative and thermal conditions. The degradation products were well resolved from riluzole peak. An inertsil-ods column (250×4.6 mm, 5 μ) with a mobile phase comprising 0.02% v/v formic acid:acetonitrile(35:65 v/v) at a flow rate of 1.0 ml/min was used and eluents were monitored at 260 nm. The retention time of riluzole was 5.7 min. Complete validation for the method was carried out according to Internation Conference on Harmonization guidelines. Linearity was achieved in the range 10-50
μg/ml with a correlation coefficient (r) 0.9998. The percent assay was 100.92 and mean percentage recovery was found to be 101.10.
TABLE 1: FORCED DEGRADATION STUDIES OF RIL
(Stress condition/duration) tR of RIL and its degradation products (min) Percent peak area
RIL peak Peak D1 Peak D2 RIL peak Peak D1 Peak D2
Control 5.7 – – 100 – –
Acidic/0.1 N HCl/40º/2 days 5.72 3.493 15.31 93.804 3.986 2.210
Alkali/1 N NaOH/40º/2 days 5.71 4.563 5.037 95.281 2.526 2.194
Oxidizing/3% H2O2/40º/2 days 5.73 2.840 7.429 88.085 8.343 3.577
Thermal/70º/24 h 5.72 18.77 – 97.810 2.190 –
Photo degradation/2 days 5.74 – – – – –
to a 25 ml volumetric flask and 10 ml of diluent, was added to the same. The flask was sonicated for 5 min and volume was made up to the mark with diluent. The above solution was filtered using nylon disposable syringe filter (13 mm, 0.45 μm) and the filtrate was diluted with diluent to obtain a concentration of 30 μg/ml and from this solution, 20 μl was injected into HPLC system.
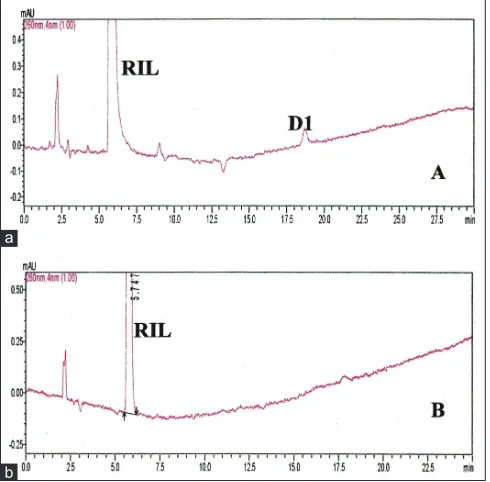
The primary target in developing this stability‑indicating LC method was to achieve the resolution between riluzole and its degradation products. Different analytical columns with various stationary phases and mobile phase combinations were tested. Initial trial was done with Phenomenex column using 0.02% v/v formic acid:methanol (50:50 v/v), the RIL peak was eluted at 27.0 min with peak splitting. Whereas with the same mobile phase composition using Inertsil ODS column a broad peak was eluted at 22.0 min. So, further trials were carried out on Inertsil ODS column with 0.02% v/v formic acid:acetonitrile as mobile phase (35:65 v/v). The RIL was eluted at 5.7 min with all the parameters like tailing factor, theoretical plates and symmetry, which are with in the limits. These LC conditions were further used to establish SIM development. Samples of the forced degradation conditions like acidic and basic hydrolysis, oxidation, thermal and photo degradation were run with the above LC conditions. The forced degradation studies showed the method was highly specific where the entire degradation products were well resolved from the main RIL peak. The results from forced degradation studies are given in Table 1. Chromatograms obtained from after degradation under different stress conditions are shown in figs 1 and 2. No peaks co‑eluted with the drug peak, suggesting the method enabled specific analysis of RIL in the presence of its degradation products. The peak purity (or peak homogeneity) analysis of the main peak, to assess for the presence of
impurities within the main peak, is an essential part of the validation of a SIM. The peak purity test results confirm that analyte peak is homogeneous in all the stress conditions tested. The peak purity of RIL was found to be greater than 0.999. These results confirm the enabling of the developed LC conditions to quantify RIL from bulk and pharmaceutical dosage forms with out any interferences.
A linear relationship was evaluated across the range (10‑50 μg/ml) of the analytical procedure in triplicate. The correlation coefficient (R) was found to be 0.9998 and shows good linearity. The data of the calibration curve were given in Table 2. Precision studies were carried out in terms of repeatability. Five determinations of 100% concentration at 30 μg/ml level was evaluated and the data given in Table 2. The % RSD was found to be less than 2 and fulfilled the ICH guidelines criteria.
Accuracy of the method was examined by performing recovery studies by standard addition method and the analyte peak was also evaluated by 3D plots of the chromatogram in order to confirm the existence of one component at 5.7 min elution time of RIL as the impurities are not available. The recovery of the added standard to the drug product sample was calculated and it was found to be 99.26‑101.6%, which indicates a good recovery of the method to that of the labeled claim. The obtained recovery results were given in Table 2.
System suitability parameters like theoretical plate count, tailing factor, and capacity factor were found to be within the limits and the results are given in Table 2. Assay was found to be 100.92±1.2% indicating good compliance with the label claim.
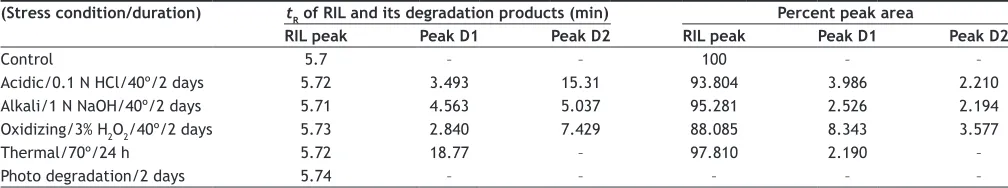
Fig. 2: Chromatograms of thermal and photo degradation samples. Chromatograms of thermal (b) and photo degradation (c) samples. D1 is the degradation product obtained with tR of 18.7 min under thermal condition. No degradation was observed in photo degradation.
a
b
Fig. 1: Overlay chromatograms of riluzole after degradation under acid, alkali, and oxidising conditions.
Tract 1: RIL in 0.1N HCl, Tract 2: 0.1N HCl blank, Tract 3: RIL in 1N NaOH, Tract 4: 1N NaOH blank, Tract 5: RIL in H2O2, Tract 6: H2O2 blank. H2O2 is Hydrogen peroxide, NaOH is Sodium hydroxide, HCl is Hydrochloric acid, D1 and D2 are the degradation products observed with all the stress conditions. D1 with tR of 3.4 min and D2 with tR of 15.3 min under acidic hydrolysis. D1 with tR of 4.5 min and D2 with tR of 5.0 min under basic hydrolysis. D1 with tR of 2.8 min and D2 with tR of 7.4 min under oxidation.
TABLE 2: VALIDATION DATA OF RIL
Validation data of RIL
Linearity (n=3) Range 10–50 ug/mL y=27076x‑21990
R² = 0.9997
R=0.9998
‑ ‑
Accuracy (n=3) Level of Addition Mean percent recovery
%RSD
80% 99.26 0.74
100% 101.43 0.79
120% 101.6 0.87
Precision (n=5) Average peak area of the standard
sample (%RSD) 787954.2 (0.062)
‑ ‑
System suitability (10–50 µl)
Tailing factor
(%RSD) plates (%RSD)Theoretical
Mean (%RSD) 1.246 (1.312) 6479.022 (1.83) Robustness Flow rate
(ml/min) Theoretical plates (N) Tailing factor
0.8 6945.4 1.5
1.0 6882.9 1.3
1.2 6848.9 1.4
Variation in Mobile phase composition
50:50 6976.4 1.5
35:65 (actual) 6882.9 1.3
40:60 6848.9 1.5
*Address for correspondence
E-mail: [email protected]
In vitro and in vivo Antiinflammatory Activity of
Clerodendrum paniculatum Linn. Leaves
JEENU JOSEPH*, A. R. BINDHU1 AND N. A. ALEYKUTTY
Department of Pharmacognosy, Pushpagiri College of Pharmacy, Medicity, Perumthuruthy, Tiruvalla-689 101, 1Department
of Pharmacognosy, University College of pharmaceutical Science, M. G. University, Kottayam-686 631, India
Joseph, et al.: Antiinflammatory Activity of Clerodendrum paniculatum Linn
Preliminary phytochemical screening showed the presence of terpenes, flavonoids, tannins, alkaloids, phenolic acid, sterols, and glycosides. This study was intended to evaluate the antiinflammatory activity of various extracts of fresh leaves of Clerodendrum paniculatum Linn experimentally by in vitro (human red blood cell membrane stabilization method) and in vivo methods (0.1 ml of 1% w/v carrageenan-induced rat paw oedema model). Petroleum ether, chloroform, ethyl acetate, alcohol, and aqueous extracts were screened for in vitro antiinflammatory activity. Petroleum ether and chloroform extracts which showed, best in vitro antiinflammatory activity was screened for in vivo antiinflammatory activity at the dose level of 200 and 400 mg/kg. Indomethacin at the dose level of 10 mg/kg was used as reference standard drug. Both the extracts showed a dose dependent significant (P<0.001) reduction in paw edema when compared to the control, at all the time intervals and comparable to indomethacin (reference standard) treated group. The results of the present study demonstrate that petroleum ether and chloroform extracts possess significant (P<0.001) antiinflammatory potential which provide scientific basis for the traditional claims of Clerodendrum paniculatum Linn leaves as an antiinflammatory drug.
Key words: Antiinflammatory activity, carrageenan, Clerodendrum paniculatum Linn, human red blood cells membrane, verbenaceae
Accepted 22 April 2013 Revised 13 April 2013 Received 25 November 2011 Indian J Pharm Sci 2013;75(3):372-376 None of the tablet ingredients interfered with the
analysis of RIL.
It can be concluded that the method developed for the estimation of RIL is rapid, precise, accurate, and selective. The method was completely validated as per ICH guidelines and satisfactory results were obtained for all characteristics tested. The method is stability indicating and can be used to assess the stability of RIL in bulk and pharmaceutical dosage forms and can be conveniently used in quality control laboratory.
REFERENCES
1. O’Neil MJ, editors. In: The Merck Index, An encyclopedia of chemicals, drugs and biologicals, 13th ed. White Hosue Station, NJ: Merck and Co Inc.; 1997. p. 8305.
2. Sweetman SC. Martindale: The complete drug reference. 33rd ed. London: Pharmaceutical Press; 2002. p. 1658.
3. Maltese A, Maugeri F, Drago F, Bucolo C. Simple determination
of riluzole in rat brain by HPLC method. J Chromatogr B 2005;817:331‑334.
4. Chandu BR, Nama S, Kanala K, Challa BR, Shaik RP, Khagga M. Quantitative estimation of riluzole in human plasma by LC‑ESI‑MS/ MS and its application to bioequivalence study. Anal Bioanal Chem 2010;398:1367‑74.
5. Sharma MC, Sharma S, Sharma AD. Validation of riluzole by densitometry application. J Pharm Res 2011;4:1545‑7.
6. Van Kan HJ, Spieksma M, Groeneveld GJ, Toraño JS, Van den Berg LH, Guchelaar HJ. A validated HPLC assay to monitor riluzole plasma or serum concentrations in patients with amyotrophic lateral sclerosis. Biomed Chromatogr 2004;18:723‑6.
7. Telekone RS, Shah AN, Khan MJ, Deshpande SV, Mahaparale SP. Spectrophotometric estimation of riluzole in tablet dosage form. Int J Pharma Res Dev 2010;2:12.
8. Saminathan J, Vetrichelvan T. Validation of UV spectrophotometric method of riluzole in dosage forms. Int J Chem Tech Res 2011;3:560‑4. 9. ICH Q2B. Stability Testing of New Drug Substances and Products;