O R I G I N A L R E S E A R C H
The Value of Prostate-Speci
fi
c Antigen-Related
Indexes and Imaging Screening in the Diagnosis of
Prostate Cancer
This article was published in the following Dove Press journal: Cancer Management and Research
Xiaojing Bai1,2,*
Yumei Jiang1,2,*
Xinwei Zhang1,2 Meiyu Wang3 Juanhua Tian1 Lijun Mu1 Yuefeng Du1,2
1Department of Urology, The First Affiliated Hospital of Xi’an Jiaotong University, Xi’an, Shaanxi 710061, People’s Republic of China;2Oncology Research Lab, Key Laboratory of Environment and Genes Related to Diseases, Ministry of Education, Xi’an, Shaanxi 710061, People’s Republic of China;3Department of Imaging, The First Affiliated Hospital of Xi’an Jiaotong University, Xi’an, Shaanxi 710061, People’s Republic of China
*These authors contributed equally to this work
Objective:The aim of this study was to explore the value of the prostate-specific antigen (PSA) levels, the ratio of free PSA to total PSA (fPSA/TPSA), the PSA density (PSAD), digital rectal examination (DRE), transrectal prostate ultrasound (TRUS), and multipara-meter MRI (MP-MRI) in the differential diagnosis of benign prostatic hyperplasia (BPH) and prostate cancer (PCa).
Methods:From February 2016 to September 2019, data from 620 patients who underwent systematic transrectal ultrasound-guided prostate biopsy (STURS-PB) in our hospital were retrospectively collected, including the PSA levels, the fPSA/TPSA ratio, the PSAD, DRE, TRUS, MP-MRI, prostate volume, and other clinical data.
Results:Among the 620 patients, 249 patients were in the PCa group, and 371 patients in the BPH group. The positive puncture rate was 40.16%. The positive predictive values of DRE, TRUS, mpMRI, and TPSA levels for PCa were 39.91%, 39.38%, 64.14%, and 41.57%, respectively; the sensitivity of these parameters was 37.35%, 51.41%, 74.69%,
and 57.43%, respectively; and the specificity of these parameters was 62.26%, 46.90%,
71.97%, and 45.82%, respectively. When the TPSA concentration was in the range of
4–20 ng/mL, the positive puncture rate of STURS-PB was 23.18%, with a high rate of
misdiagnosis. When the TPSA concentration was in the range of 4–20 ng/mL, the fPSA/
TPSA ratio was 0.15, the PSAD was 0.16, the comprehensive evaluation of PCa was optimal
(the sensitivity of these parameters was 88.85% and 84.09%, respectively; the specificity was
80.17% and 67.29%, respectively; the positive predictive value was 57.41% and 51.39%,
respectively). When the TPSA concentration >4 ng/mL, the fPSA/TPSA ratio≤0.15 and the
PSAD≥0.16, the sensitivity, specificity, and correctness index of the PCa and BPH diagnosis
were 80.54%, 82.75%, and 67.07%, respectively.
Conclusion: When using DRE, TRUS, and MP-MRI to screen for PCa, MP-MRI has
a relatively high sensitivity and specificity. Using these three thresholds (TPSA >4 ng/mL
combined with an fPSA/TPSA ratio≤0.15 and a PSAD ≥0.16) is significantly better than
using TPSA levels alone for the differential diagnosis of PCa and BPH.
Keywords: total prostate-specific antigen, free prostate-specific antigen, prostate-specific antigen density, prostate cancer, benign prostatic hyperplasia
Introduction
Prostate cancer (PCa) is the most common male tumor in Europe and the US, and it has the second highest mortality rate among male tumors. Although the incidence of prostate cancer in Asia is lower than that in Europe and the US, it has been increasing rapidly in recent years.1,2It has been reported that the 5-year survival rate of early PCa
Correspondence: Yuefeng Du Department of Urology, The First Affiliated Hospital of Xi’an Jiaotong University, 277 Western Yanta Road, Xi’an, Shaanxi 710061, People’s Republic of China
Tel/Fax +86-29-8532-3945 Email [email protected]
Cancer Management and Research
Dove
press
open access to scientific and medical research
Open Access Full Text Article
Cancer Management and Research downloaded from https://www.dovepress.com/ by 118.70.13.36 on 27-Aug-2020
can be as high as 99% after timely and reasonable treatment. Therefore, diagnosing PCa safely, early, and accurately has been a major focus of urologists.3–5
At present, the diagnostic methods of PCa include digital rectal examination (DRE), prostate-specific antigen (PSA), transrectal prostate ultrasound (TRUS), and multi-parameter MRI (MP-MRI), but systematic transrectal ultrasound-guided prostate biopsy (STURS-PB) is the gold standard for the diagnosis of PCa.1,4 STURS-PB can obtain prostate tissue samples and make pathological diagnoses of PCa.6–9However, because STURS-PB is an invasive test, the procedure is painful and difficult for patients, and it can be accompanied by many complica-tions, such as hematuria, urinary retention, hemospermia, and infection, which are not suitable for routine screening.6–9Therefore, it is of great clinical significance to determine the need for STURS-PB according to the results of DRE, PSA, PSA-related indexes, TRUS, and MP-MRI. Although DRE, PSA, PSA-related indexes, TRUS, and MP-MRI can significantly improve the posi-tive diagnostic rate of STURS-PB and reduce unnecessary punctures and economic burdens for patients, there are also problems with these methods, such as insufficient sensitivity and specificity, especially when the PSA ranges from 4–20 ng/mL.10–15Accordingly, the clinical data from 620 patients who underwent STURS-PB in our hospital were collected, and the patients were divided into two groups (BPH group and PCa group). The diagnostic effi -ciency of TRUS, DRE, and MP-MRI was analyzed, and the critical values of the fPSA/TPSA ratio and the PSAD for diagnosing PCa was determined when the TPSA levels ranged from 4–20 ng/mL. Furthermore, the clinical value of the fPSA/TPSA and the PSAD thresholds for the differ-ential diagnosis of PCa and BPH when the TPSA levels >4 ng/mL was discussed.
Data and Methods
Inclusion Criteria and Exclusion Criteria
The clinical data of 620 patients who underwent STURS-PB in our hospital from February 2016 to September 2019 were collected and analyzed retrospectively. The inclusion criteria were as follows: 1) STURS-PB patients; 2) patho-logical diagnosis of PCa or BPH; and 3) complete clinical data. The exclusion criteria were as follows: 1) pathological diagnosis was not prostate cancer or hyperplasia; and 2) incomplete clinical data. The study was performed in accor-dance with the ethical standards of the institutional and/or
national research committee and with the 1964 Declaration of Helsinki and its later amendments or comparable ethical standards. The study was approved by the ethics committee of The First Affiliated Hospital of Xi’an Jiaotong University and all participants signed informed consent.
STURS-PB and Clinical Data Collection
STURS-PB has been described in previous research.16,17 The clinical data, including the PSA levels1, the fPSA levels, the prostate volume, the fPSA/TPSA ratio, the PSAD, transrectal ultrasound, DRE and MP-MRI, were collected and analyzed. The TPSA and fPSA levels are determined by the chemiluminescence method. The detec-tion instrument was an automatic chemiluminescence immunoanalyzer from Beckman Coulter Company in the US. The kit was provided by the company and operated by special personnel. The ultrasound diagnosis was per-formed using the PHILIPS HD-11 GE-VOLUSION 730 EXPERT color Doppler ultrasound diagnostic instrument, and the probe frequency was 6–12 MHz. The prostate was observed by the rectum; the anterior, posterior, left, right, upper diameter, and lower diameter of the prostate were measured. The prostate volume was calculated according to the formula: prostate volume=(front and rear diameter×-left and right diameter×upper and lower diameter)×π/6. The PSAD was calculated according to the following for-mula: PSAD=PSA/prostate volume. MP-MRI was per-formed using a ge-3.0 clinical MRI scanner (twin speed scanner, General Electric Medical System, USA).
Statistical Methods
SPSS19.0 statistical software was used for analysis, and the measurement data were expressed as x±s. The one-sample K–S test was used to assess the normal distribution of continuous variables before performing further comparisons. Student’st-test and the Wilcoxon test were used to compare clinical characteristics between the PCa group and BPH group. Categorical data were expressed as percentages, and compar-isons between groups were made using theχ2test or Fisher’s exact test. WhenP<0.05, the difference was significant.
Results
Positive Predictive Value, Sensitivity, and
Speci
fi
city Analysis of DRE, TRUS,
MP-MRI, and TPSA Levels
Among 620 patients, 249 patients were in the PCa group, and 371 patients were in the BPH group. The positive
Cancer Management and Research downloaded from https://www.dovepress.com/ by 118.70.13.36 on 27-Aug-2020
puncture rate was 40.16%. As shown inTable 1, the positive predictive values of DRE, TRUS, mpMRI, and the TPSA levels for PCa were 39.91%, 39.38%, 64.14%, and 41.57%, respectively; the sensitivity of these parameters was 37.35%, 51.41%, 74.69%, and 57.43%, respectively; and the specifi -city of these parameter was 62.26%, 46.90%, 71.97%, and 45.82%, respectively. As shown inTable 2, when the TPSA levels ranged from 4–10 ng/mL and 10–20 ng/mL, the positive puncture rates for STURS-PB are 17.24% and 25.97%, respectively. When the TPSA levels ranged from 4–20 ng/mL, the positive puncture rate for STURS-PB was 23.18%. The results showed that when the PSA ranged from 4–20 ng/mL, the positive puncture rate for STURS-PB was not high, and there was a high negative puncture rate.
Comparison of the TPSA Levels, fPSA/
TPSA Ratio, Prostate Volume, and PSAD
Between the BPH Group and PCa Group
When the TPSA Levels Were in the
Range of 4
–
20 ng/mL
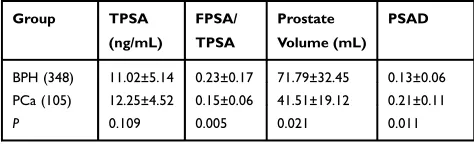
As shown inTable 3, there was no significant difference in the TPSA levels (11.02±5.14 vs 12.25±4.52, P=0.109) between the BPH group and the PCa group. The fPSA/TPSA ratio (0.23±0.17 vs 0.15±0.06, P=0.005) and prostate volume (71.79±32.45 vs 41.51±19.12, P=0.021) were significantly higher in the BPH group than in the PCa group, but the
PSAD (71.79±32.45 vs 41.51±19.12,P=0.011) was signifi -cantly lower in the BPH group than in the PCa group (P<0.01).
When the TPSA Levels Ranged from
4
–
20 ng/mL, Comparison of Different
fPSA/TPSA Thresholds in the Diagnosis of
PCa
Table 4 shows the results of different fPSA/TPSA cutoff values for the sensitivity, specificity, and positive predictive values for BPH and PCa discrimination when the TPSA levels ranged from 4–20 ng/mL. When the fPSA/TPSA ratio was 0.15, the comprehensive evaluation of PCa screen-ing was optimal (the sensitivity was 88.85%, the specificity was 80.17%, and the positive predictive value was 57.41%).
When the TPSA Levels Ranged from
4
–
20 ng/mL, Comparison of Different
PSAD Thresholds in the Diagnosis of PCa
Table 5shows the results of different PSAD cutoff values for the sensitivity, specificity, and positive predictive values for BPH and PCa discrimination when the TPSA levels ranged from 4–20 ng/mL. When the PSAD was 0.16, the compre-hensive evaluation of PCa screening was optimal (the sensi-tivity was 84.09%, the specificity was 67.29%, and the positive predictive value was 51.39%).
Comparison of Different Index
Thresholds for Diagnosing PCa When the
TPSA Levels >4 ng/mL
Table 6 shows the sensitivity, specificity, and positive predictive values for PCa when the TPSA levels were >4.0 ng/mL, the fPSA/TPSA ratio ≤0.15, and the PSAD
≥0.16. As shown inTable 6, when the TPSA levels were >4.0 ng/mL, the fPSA/TPSA ratio ≤0.15, and the PSAD
≥0.16, the comprehensive evaluation of PCa screening was optimal (the sensitivity was 80.54%, the specificity was 82.75%, and the positive predictive value was 67.07%).
Table 1Analysis of the Positive Predictive Value, Sensitivity, and Specificity of Different Examination Methods
Parameter Positive
Predictive
Value
Sensitivity Specificity
DRE 39.91% (93/233) 37.35% (93/249) 62.26% (231/371) TRUS 39.38% (128/325) 51.41% (128/249) 46.90% (174/371) mpMRI 64.14% (186/290) 74.69% (186/249) 71.97% (267/371) TPSA (ng/mL) 41.57% (143/344) 57.43% (143/249) 45.82% (170/371) Abbreviations:DRE, digital rectal examination; TPSA, total prostate-specific anti-gen; TRUS, transrectal prostate ultrasound; mpMRI, multiparameter MRI.
Table 2 Comparison of the Puncture Positive Rate Across Different TPSA Concentrations
Parameter Scope (n) Positive Puncture Rate (%, n)
TPSA (ng/mL) 4~10 (145) 17.24% (25/145) 10~20 (308) 25.97% (80/308) 4~20 (453) 23.18% (105/453) >20 (167) 86.82% (144/167)
Table 3Comparison of TPSA Levels, fPSA/TPSA Ratios, Prostate Volumes, and PSAD Levels Between the BPH Group and PCa Group When the TPSA Concentration Ranged from 4–20 ng/mL
Group TPSA
(ng/mL)
FPSA/
TPSA
Prostate
Volume (mL) PSAD
BPH (348) 11.02±5.14 0.23±0.17 71.79±32.45 0.13±0.06 PCa (105) 12.25±4.52 0.15±0.06 41.51±19.12 0.21±0.11
P 0.109 0.005 0.021 0.011
Cancer Management and Research downloaded from https://www.dovepress.com/ by 118.70.13.36 on 27-Aug-2020
Discussion
PCa is one of the most common malignant diseases in males, and the incidence rate has been increasing in recent years.1,3 The early detection and diagnosis of PCa is of great clinical significance.1,3 DRE and TRUS are important methods for the early detection of PCa. They have the advantages of simplicity and reproduci-bility, but both have the disadvantages of low specificity and sensitivity.18–20 It has been reported that the false negative rate of TRUS is as high as 30–45%, while the missed diagnosis rate of DRE alone is as high as 48–85%.21–23 In this study, we found that the positive predictive value of DRE and TRUS in PCa screening
was 39.91% and 39.38%, respectively; the sensitivity was 37.35% and 51.41%, respectively; and the specifi -city was 62.26% and 46.90%, respectively. The results suggested that the sensitivity and specificity of TRUS for PCa were low, but the sensitivity and specificity of DRE for PCa were relatively high. The reasons for this result are mainly related to the size of the lesion, the location of the lesion, the level of operator experience, and the subjective consciousness of the examiner. In recent years, MP-MRI has attracted increasing attention in the early diagnosis of PCa. It has been reported that the sensitivity and specificity of MP-MRI for PCa diagnosis range from 54–82% and 46–91%, respectively.24,25 In this study, we found that the positive predictive value of MP-MRI for PCa diagnosis was 64.14%, the sensitiv-ity was 74.69%, and the specificity was 71.97%. The results suggest that multiparameter MRI has high sensi-tivity and specificity in the diagnosis of PCa and has important clinical value for the early screening of PCa.
PSA is the most important marker for the early detec-tion and identification of PCa. It has high organ specificity (not disease specificity), so both PCa and BPH lead to an increase in the PSA.26–28 It is suggested that there is a large overlap of PSA levels in BPH and PCa patients, so the examination of PSA levels alone affects the differ-ential diagnosis of BPH and PCa.26–28 In this study, we found that the positive predictive value of the PSA alone
Table 4Comparison of Different fPSA/TPSA Thresholds to Diagnose PCa Between the BPH Group and the PCa Group When the TPSA Concentration Ranged from 4–20 ng/mL
fPSA/ TPSA
True Positive
False Negative
True Negative
False Positive
Sensitivity (%)
Specificity (%)
Positive Predictive Value (%)
0.13 66 39 315 33 62.86 90.51 66.67
0.14 84 21 291 57 80.00 83.26 59.57
0.15 93 12 279 69 88.85 80.17 57.41
0.16 96 9 258 99 91.43 74.14 49.23
0.17 99 6 216 132 94.28 62.07 42.86
Table 5Comparison of Different PSAD Thresholds to Diagnose PCa Between the BPH Group and the PCa Group When the TPSA Concentration Ranged from 4–20 ng/mL
PSAD True Positive
False Negative
True Negative
False Positive
Sensitivity (%)
Specificity (%)
Positive Predictive Value (%)
0.14 123 9 66 255 93.18 20.56 32.29
0.15 114 18 135 186 86.36 42.06 38.00
0.16 111 21 216 105 84.09 67.29 51.39
0.17 99 33 240 81 75.00 74.76 55.00
0.18 84 48 273 48 63.63 85.05 63.63
Table 6 Comparison of Diagnostic Values of PCa When the TPSA Concentration >4 ng/mL
Diagnostic Value
FPSA/ TPSA≤0.15
PSAD≥0.16 FPSA/TPSA≤0.15 PSAD≥0.16
True positive 179 169 149
True negative 216 300 360
False positive 195 114 75
False negative 30 39 36
Total 620 620 620
Sensitivity (%) 85.64 82.04 80.54
Specificity (%) 52.55 72.46 82.75 Correct index 38.19 48.18 67.07
Cancer Management and Research downloaded from https://www.dovepress.com/ by 118.70.13.36 on 27-Aug-2020
for the diagnosis of PCa was 41.57%, the sensitivity was 57.43%, and the specificity was 45.82%. The results sug-gest that the PSA alone has low sensitivity and specificity in the diagnosis of PCa. Currently, a novel immunosensor constructed via the assembly of prostate-specific antibo-dies on the surface of Au@Pt NCs shows high sensitivity and specificity and shows promise.29,30It is suggested that the serum PSA level is above the normal range in approxi-mately 21–47% of BPH patients, and a high PSA level leads to unnecessary STURS-PB and limits its value as a screening method for PCa.28,31,32In this study, we found that when the TPSA levels ranged from 4–20 ng/mL, there was no significant difference in the TPSA concentration between the BPH group and the PCa group (11.08±5.14 vs 12.25±4.52, P=0.109), and the positive puncture rate of STURS-PB was 23.18%. The results showed that when the PSA ranged from 4–20 ng/mL, the TPSA levels of the BPH group and PCa group overlapped, the positive punc-ture rate of STURS-PB was not high, and the negative puncture rate was high.
At present, it is suggested that the fPSA/TPSA ratio and the PSAD can increase the positive predictive value of PSA for PCa when the PSA concentration ranges from 4–10 ng/mL, thus reducing unnecessary biopsies.33Because of the overlap of TPSA levels between the BPH group and PCa group at a concentration of 4–20 ng/mL and because of the high negative puncture rate, we explored the optimal values for the fPSA/TPSA ratio and the PSAD for diagnosing PCa when the TPSA levels ranged from 4–20 ng/mL. In this study, we found that when the PSA levels ranged from 4–20 ng/mL, the fPSA/TPSA ratio and the PSAD were signifi -cantly different between the PCa group and BPH group, and when the fPSA/TPSA ratio was equal to or less than 0.15 and the PSAD was equal to or greater than 0.16, the screen-ing and diagnosis efficiency of PCa was optimal (the sensi-tivity of these parameters was 88.85% and 80.17%, and the specificity was 84.09% and 67.29%, respectively). The threshold of the PSAD ≥0.16 is selected in this paper, as the sensitivity is higher for this threshold than the sensitivity obtained when using the recommended threshold of PSAD >0.15 to diagnose PCa (52.0–67.9%); however, the specifi -city is still relatively low compared to 78.9–81.0%.32,34The reason for this result may be related to the different research objects, reagents, and detection methods. Because there are some limitations when using PSA >4 ng/mL as the thresh-old of PCa screening,34,35we explored the diagnostic effi -ciency of using an fPSA/TPSA≤0.15 and a PSAD≥0.16 as thresholds for diagnosing PCa when the PSA levels were >
4 ng/mL. In this study, we used the principle of combining sensitivity and specificity tofind that when using these three thresholds (PSA >4 ng/mL, fPSA/TPSA≤0.15 and PSAD
≥0.16) to diagnose PCa and BPH, the sensitivity, specificity, and positive predictive value were 80.54%, 82.75%, and 67.07%, respectively. Therefore, in the differential diagno-sis of BPH and PCa, a TPSA level >4 ng/mL combined with an fPSA/TPSA ratio ≤0.15 and a PSAD ≥0.16 is recom-mended for optimal screening results. However, the follow-ing limitations still exist in this study: 1) this is a retrospective study with inherent limitations and bias risks; 2) the sample size of this study is small, and the research results need to be further validated across multiple centers and with a large sample size; and 3) the research results only represent the cases in our center and cannot be extended to different groups and units.
Funding
This study was supported by the National Natural Science Foundation of China (NSFC81372736) and the Project of Shaanxi Provincial Natural Science Basic Research Program (2020JM-370, 2020JM-390).
Disclosure
The authors report no conflicts of interest in this work.
References
1. Chang AJ, Autio KA, Scher HI. High-risk prostate cancer-classification and therapy.Nat Rev Clin Oncol.2014;11(6):308–323. doi:10.1038/ nrclinonc.2014.68
2. Center MM, Jemal A, Lortet-Tieulent J. International variation in prostate cancer incidence and mortality rates. Eur Urol. 2012;61 (6):1079–1092. doi:10.1016/j.eururo.2012.02.054
3. Litwin MS, Tan HJ. The diagnosis and treatment of prostate cancer: a review.JAMA.2017;317(24):2532–2542. doi:10.1001/jama.2017.7248 4. Freedland S. Prostate cancer: race and prostate cancer personalized medicine: the future.Nat Rev Urol.2018;15(4):207–208. doi:10.1038/ nrurol.2017.215
5. Hoogland AM, Kweldam CF, van Leenders GJ. Prognostic histopatho-logical and molecular markers on prostate cancer needle-biopsies: a review.Biomed Res Int.2014;2014:341324. doi:10.1155/2014/341324 6. Schoots IG, Roobol MJ, Nieboer D, et al. Magnetic resonance imaging-targeted biopsy may enhance the diagnostic accuracy of sig-nificant prostate cancer detection compared to standard transrectal ultrasound-guided biopsy: a systematic review and meta-analysis. Eur Urol.2015;68(3):438–450.
7. Borghesi M, Ahmed H, Nam R, et al. Complications after systematic, random, and image-guided prostate biopsy. Eur Urol. 2017;71 (3):353–365. doi:10.1016/j.eururo.2016.08.004
8. Schouten MG, Barentsz JO, Thompson LC, et al. Why and where do we miss significant prostate cancer with multi-parametric magnetic resonance imaging followed by magnetic resonance-guided and trans-rectal ultrasound-guided biopsy in biopsy-naïve men? Eur Urol.
2017;71(6):896–903. doi:10.1016/j.eururo.2016.12.006
Cancer Management and Research downloaded from https://www.dovepress.com/ by 118.70.13.36 on 27-Aug-2020
9. Baco E, Rud E, Eri LM, et al. A randomized controlled trial to assess and compare the outcomes of two-core prostate biopsy guided by fused magnetic resonance and transrectal ultrasound images and traditional 12-core systematic biopsy. Eur Urol. 2016;69 (1):149–156. doi:10.1016/j.eururo.2015.03.041
10. Moul JW. Comparison of DRE and PSA in the detection of prostate cancer.J Urol.2017;197(2S):S208–S209. doi:10.1016/j.juro.2016.11.031 11. Quaas J. PSA screening for prostate cancer. Am Fam Physician.
2015;91(9).
12. Thompson JE, Stricker PD. Diagnostic accuracy of multi-parametric MRI and transrectal ultrasound-guided biopsy in prostate cancer. Lancet.
2017;389(10071):767–768. doi:10.1016/S0140-6736(17)30121-6 13. Mayor S. Targeted biopsy with MRI and ultrasound improves
detec-tion of high risk prostate cancer.BMJ.2015;350:h472.
14. Carlsson S, Vickers A, Lilja H, Hugosson J. Screening for prostate cancer.Ann Intern Med. 2012;156(7):539. doi:10.7326/0003-4819-156-7-201204030-00014
15. Kim KS, Jeong WS, Park SY, et al. The effect of two weeks of treatment with dutasteride on bleeding after transurethral resection of the prostate.World J Mens Health.2015;33(1):14–19. doi:10.5534/ wjmh.2015.33.1.14
16. Han M, Chang D, Kim C, et al. Geometric evaluation of systematic transrectal ultrasound guided prostate biopsy. J Urol. 2012;188 (6):2404–2409. doi:10.1016/j.juro.2012.07.107
17. Wu YP, Li XD, Ke ZB, et al. Risk factors for infectious complica-tions following transrectal ultrasound-guided prostate biopsy.Infect Drug Resist.2018;11:1491–1497. doi:10.2147/IDR.S171162 18. Carvalhal GF, Smith DS, Mager DE. Digital rectal examination for
detecting prostate cancer at prostate specific antigen levels of 4 ng./ mL. or less. J Urol. 1999;161(3):835–839. doi:10.1016/S0022-53 47(01)61785-3
19. Catalona WJ, Richie JP, Ahmann FR, et al. Comparison of digital rectal examination and serum prostate specific antigen in the early detection of prostate cancer: results of a multicenter clinical trial of 6630 men. J Urol. 2017;197(2S):S200–S207. doi:10.1016/j. juro.2016.10.073
20. Catalona WJ, Partin AW, Finlay JA, et al. Use of percentage of free prostate-specific antigen to identify men at high risk of prostate cancer when PSA levels are 2.51 to 4 ng/mL and digital rectal examination is not suspicious for prostate cancer: an alternative model. Urology. 1999;54(2):220–224. doi:10.1016/S0090-4295(99) 00185-5
21. Mueller EJ, Crain TW, Thompson IM. An evaluation of serial digital rectal examinations in screening for prostate cancer.J Urol.1988;140 (6):1445–1447. doi:10.1016/S0022-5347(17)42069-6
22. Halpern E, Strup S. Using gray-scale and color and power Doppler sonography to detect prostatic cancer. AJR Am J Roentgenol.
2000;174(3):623–627. doi:10.2214/ajr.174.3.1740623
23. El-Shater Bosaily A, Parker C, Brown LC. PROMIS–Prostate MR imaging study: a paired validating cohort study evaluating the role of multi-parametric MRI in men with clinical suspicion of prostate cancer. Contemp Clin Trials. 2015;42:26–40. doi:10.1016/j. cct.2015.02.008
24. Graser A, Heuck A, Sommer B, et al. Per-sextant localization and staging of prostate cancer: correlation imaging findings with whole-mount step section histopathology. AJR Am J Roentgenol.
2007;188(1):84–90. doi:10.2214/AJR.06.0401
25. Haider MA, Tanguay J, Evans AJ. Combined T2-weighted and diffusion-weighted MRI for localization of prostate cancer.AJR Am J Roentgenol.2007;189(2):323–328. doi:10.2214/AJR.07.2211 26. Froehner M, Hakenberg OW, Koch R, et al. Comparison of the
clinical value of complexed PSA and total PSA in the discrimination between benign prostatic hyperplasia and prostate cancer.Urol Int.
2006;76(1):27–30. doi:10.1159/000089731
27. Helfand BT, Anderson CB, Fought A, et al. Postoperative PSA and PSA velocity identify presence of prostate cancer after various surgi-cal interventions for benign prostatic hyperplasia.Urology.2009;74 (1):177–183. doi:10.1016/j.urology.2008.10.062
28. Sershon PD, Barry MJ, Oesterling JE. Serum prostate-specific anti-gen discriminates weakly between men with benign prostatic hyper-plasia and patients with organ-confined prostate cancer.Eur Urol.
1994;25(4):281–287. doi:10.1159/000475302
29. Wang R, Liu W, Wang A, Xue Y, Wu L, Feng J. A new label-free electrochemical immunosensor based on dendritic Core-Shell AuPd@Au nanocrystals for highly sensitive detection of prostate spe-cific antigen. Biosens Bioelectron. 2018;99:458–463. doi:10.1016/j. bios.2017.08.010
30. Wang R, Wang A, Liu W, et al. A novel label-free electrochemical immunosensor for ultra-sensitively detecting prostate specific antigen based on the enhanced catalytic currents of oxygen reduction cata-lyzed by Core-Shell Au@Pt nanocrystals. Biosens Bioelectron.
2018;102:276–281. doi:10.1016/j.bios.2017.11.041
31. Hochberg DA, Armenakas NA, Fracchia JA. Relationship of prostate-specific antigen and prostate volume in patients with biopsy proven benign prostatic hyperplasia.Prostate. 2000;45(4):315–319. doi:10.1002/1097-0045(20001201)45:4<315::AID-PROS5>3.0. CO;2-2
32. Fu S, Zhang X, Niu Y, Wang RT. Prostate specific antigen, mean platelet volume, and platelet distribution width in combination to discriminate prostate cancer from benign prostate hyperplasia.Asian Pac J Cancer Prev.2018;19(3):699–702. doi:10.22034/APJCP.2018.19.3.699 33. Kang SH, Bae JH, Park HS, et al. Prostate-specific antigen adjusted
for the transition zone volume as a second screening test: a prospective study of 248 cases. Int J Urol. 2006;13:910–914. doi:10.1111/j.1442-2042.2006.01439.x
34. Seaman E, Whang M, Olsson CA, et al. PSA density (PSAD). Role in patient evaluation and management.Urol Clin North Am.1993;20 (4):653–663.
35. Verma A, St Onge J, Dhillon K, Chorneyko A. PSA density improves prediction of prostate cancer.Can J Urol.2014;21(3):7312–7321.
Cancer Management and Research
Dove
press
Publish your work in this journal
Cancer Management and Research is an international, peer-reviewed open access journal focusing on cancer research and the optimal use of preventative and integrated treatment interventions to achieve improved outcomes, enhanced survival and quality of life for the cancer patient.
The manuscript management system is completely online and includes a very quick and fair peer-review system, which is all easy to use. Visit http://www.dovepress.com/testimonials.php to read real quotes from published authors.
Submit your manuscript here:https://www.dovepress.com/cancer-management-and-research-journal
Cancer Management and Research downloaded from https://www.dovepress.com/ by 118.70.13.36 on 27-Aug-2020