141 |
P a g e
ELIMINATION OF HIGH DENSITY IMPULSE NOISE
USING DISTANCE BASED ADAPTIVE MEAN FILTER
ALGORITHM
Snekha
1, Bandaru Vasu Mani Kumar
21, 2
Department of Electronics and Communication Engineering
ABSTRACT
A distance based adaptive mean filter method for the re-establishment of gray-scale images that are highly corrupted by impulse noise, is proposed in this paper .This method efficiently removes the impulse noise .This technique differentiates between corrupted and uncorrupted pixels and performs the filtering process only on the corrupted ones. This paper proposes a two-stage system for eliminating impulse noise. In the first stage, a filter is used to identify some of the corrupted pixels and the pixels are replaced using the mean filter. In the second phase, in the resulted image rest of the corrupted pixels are detected and restored using an adaptive mean method that applies only to those selected corrupted pixel. The proposed algorithm is analyzed for different grayscale images such as Lena images and house images. It provides a better peak signal to noise ratio (PSNR in dB) and MSE (dB) than othertechniques with a noise level as high as 95%.
Keywords: Impulse Noise, PSNR, MSE and Distance Based Adaptive Mean Filter
I. INTRODUCTION
142 |
P a g e
high). At high noise densities, if the selected window contains all 0‟s or 255‟s or both then the processing pixel is replaced by mean value of the selected window. The algorithm fails if all the elements within the window are „0‟ or „255‟ then the mean value will be „0‟ or „255‟ hence noisy pixel will not be efficiently processed. The paper is systematized as follows. In Section II, First distance based adaptive mean filter algorithm is discussed and also we explain our proposed method for determining the components of interest. Section III describes the experimental results and discussion with different grayscale images. Finally in Section IV; the conclusion is drawn.
II. PROPOSED ALGORITHM
In the proposed approach first decide the window size. Then take a window of the given size in the image and if the center pixel is 0 or 255 find the distance dij between the center pixel and the neighboring pixels
Fig: 1 Window of 3*3
Where,
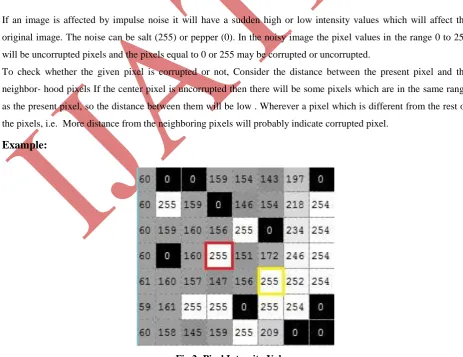
If an image is affected by impulse noise it will have a sudden high or low intensity values which will affect the original image. The noise can be salt (255) or pepper (0). In the noisy image the pixel values in the range 0 to 255 will be uncorrupted pixels and the pixels equal to 0 or 255 may be corrupted or uncorrupted.
To check whether the given pixel is corrupted or not, Consider the distance between the present pixel and the neighbor- hood pixels If the center pixel is uncorrupted then there will be some pixels which are in the same range as the present pixel, so the distance between them will be low . Wherever a pixel which is different from the rest of the pixels, i.e. More distance from the neighboring pixels will probably indicate corrupted pixel.
Example:
143 |
P a g e
In the above image by calculating the distance between the neighboring pixels and the pixels in the yellow and the red box we can decide whether they are corrupted or not. For red box we get differences as,
So if we keep threshold T=30 and n=4 this pixel will be marked as corrupted and in the same way for yellow box, we get differences as,
This will be marked as uncorrupted. We added a second stage even though first stage works well for low-noise densities because at high densities (densities ranging from 80 to 95 %) the pixel values presented in the image will be mostly noisy. So first stage will not replace all the corrupted pixels. In the second stage of the algorithm, Consider the output image of the first stage now it will have less noise than the original image then again we will apply the same approach to detect the corrupted pixel. After detecting the corrupted pixel the pixel will be replaced by adaptive mean of the mask instead of normal mean. The adaptive mean will be calculated by using members of the mask other than 0 or 255. If all the members of the mask are only (0 or 255) then we will replace the pixel with the last modified pixel.
The steps of the proposed technique are elucidated as follows:
1. Select a window (W) of size 3*3 in the image
2. If the Center pixel is between 0 and 255 then go to step1 otherwise go to step3
3. Calculate the absolute distance between the center pixel and the neighboring pixels.
4. Count how many pixels are satisfying the equation
5. If Count (c) is greater than n then mark the middle pixel as noisy and go to next step otherwise go to step7
6. Now replace with mean of the window
7. Shift the window to the next pixel and Go to step1
Now on the resulted Image
8. repeat steps 1 to 5 if the center pixel is noisy go to next step otherwise go to step7
9. Replace the middle pixel with the adaptive mean i.e.
If all the elements in A are 0 or 255 then replace with the last processed pixel.
10. Shift the window to the next pixel and Go to step 8
III.
EXPERIMENTAL RESULTS AND DISCUSSION
144 |
P a g e
Where N1 X N2is the size of the image, x denotes the original image and x^ represents the noisy image.
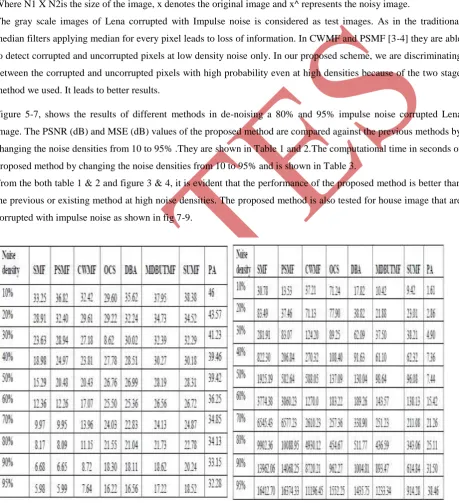
The gray scale images of Lena corrupted with Impulse noise is considered as test images. As in the traditional median filters applying median for every pixel leads to loss of information. In CWMF and PSMF [3-4] they are able to detect corrupted and uncorrupted pixels at low density noise only. In our proposed scheme, we are discriminating between the corrupted and uncorrupted pixels with high probability even at high densities because of the two stage method we used. It leads to better results.
Figure 5-7, shows the results of different methods in de-noising a 80% and 95% impulse noise corrupted Lena image. The PSNR (dB) and MSE (dB) values of the proposed method are compared against the previous methods by changing the noise densities from 10 to 95% .They are shown in Table 1 and 2.The computational time in seconds of proposed method by changing the noise densities from 10 to 95% and is shown in Table 3.
From the both table 1 & 2 and figure 3 & 4, it is evident that the performance of the proposed method is better than the previous or existing method at high noise densities. The proposed method is also tested for house image that are corrupted with impulse noise as shown in fig 7-9.
Table2: Comparison of MSE (dB) values of proposed Table2: Comparison of MSE (dB) values of proposed
method at different noise densities with existing methods method at different noise densities with existing
145 |
P a g e
Table3: Computing RUN TIME (sec), Noise image PSNR,Fig 3: PSNR (dB) Vs Noise image densities (%) for
Output PSNR (DB) Lena Image
Fig 4: MSE (dB) Vs Noise image densities (%) for Lena Images
5(a) Noisy image 5 (b) Output of SMF 5 (c) Output of PSMF5(d) Output of CWMF 5(e) Output of OCSF
5(f) Output of DBA 5(g) Output of MDBUTMF5 (h) Output of SUMF 5(i) Output of Proposed Method
146 |
P a g e
6(a) Noisy image 6 (b) Output of SMF 6 (c) Output of PSMF 6(d) Output of CWMF 6(e) Output of OCSF
6(f) Output of DBA 6(g) Output of MDBUTMF 6(h) Output of SUMF 6(i) Output of proposed method
Fig.6 Results of Various Filters for Lena Image Corrupted By 90% Noise Densities
7(a) Noisy image 7(b) Output of SMF 7 (c) Output of PSMF 7(d) Output of CWMF 7(e) Output of OCSF
7(f) Output of DBA 7(g) Output of MDBUTMF 7(h) Output of SUMF 7(i) Output of proposed method
Fig.7 Results of Various Filters for Lena Image Corrupted By 95% Noise Densities
8(a) Noisy image 8(b) Output of SMF 8(c) Output of PSMF 8(d) Output of CWMF 8(e) Output of OCSF
8(f) Output of DBA 8(g) Output of MDBUTMF 8(h) Output of SUMF 8(i) Output of proposed method
147 |
P a g e
9(a) Noisy image 9(b) Output of SMF 9(c) Output of PSMF 9(d) Output of CWMF 9(e) Output of OCSF
9(f) Output of DBA 9(g) Output of MDBUTMF 9(h) Output of SUMF 9(i) Output of Proposed Method
Fig.9 Results Of Various Filters For House Image Corrupted By 90% Noise Densities
10(a) Noisy image 10(b) Output of SMF 10(c) Output of PSMF 10(d) Output of CWMF 10(e) Output of OCSF
10(f) Output of DBA 10(g) Output of MDBUTMF 10(h) Output of SUMF 10(i) Output of proposed method
Fig.10 Results Of Various Filters For House Image Corrupted By 95% Noise Densities
IV. CONCLUSIONS
148 |
P a g e
REFERENCES
[1] A.K. Jain, “Fundamentals of digital image processing”, Prentice Hall, Englewood Cliffs, 1989.
[2] J. Astola and P. Kuosmaneen, Fundamentals of Nonlinear Digital Filtering.Boca Raton, FL: CRC, 1997 [3] D. R.K. Brownrigg, The weighted median filter, Communication of ACM,vol. 27, issue 8, 1984, pp. 807–818. [4] Z. Wang and D. Zhang, Progressive switching median filter for the removal of impulse noise from highly
corrupted images,IEEE Transactions on Circuits and Systems-II, vol. 46, 1999, pp. 78–80.
[5] Deng Ze Feng, Yin Zhou Ping and Xiong You Lou, High probability impulse noise removing algorithm based on mathematical morphology, IEEE Signal Processing Letters, vol. 14, no. 1, 2007, pp. 31–34.
[6] K. Aiswarya, V. Jayaraj, and D. Ebenezer, “A new and efficient algorithm for the removal of high density salt and pepper noise in images and videos, in Second Int. Conf. Computer Modeling and Simulation, 2010, pp.409–413.
[7] K. S. Srinivasan and D. Ebenezer, “A new fast and efficient decision based algorithm for removal of high density impulse noise,” IEEESignal Process.Lett., vol. 14, no. 3, pp. 189–192, Mar. 2007.
[8] S. Esakkirajan, T. Veerakumar, Adabala N. Subramanyam, and C. H. Prem Chand, “ Removal of High Density Salt and Pepper Noise Through Modified Decision Based Unsymmetric Trimmed Median Filter”, IEEE Signal Processing Letters, vol. 18, no. 5, 2011, pp- 287-290.