2016 International Conference on Computer, Mechatronics and Electronic Engineering (CMEE 2016) ISBN: 978-1-60595-406-6
Research on Application Level of Big Data and Cloud
Computing Information Technologies in Smart Grid
Jing ZHOU*
School of Control and Computer Engineering, North China Electric Power University, Beijing 102206, China
Keywords: Cloud computing, Big data, Smart grid, Application level evaluation.
Abstract. With the rapid development, smart grid and information technologies have been integrated so tightly that it is imperative to evaluate the application level of advanced information technologies for the informatization in smart grid. In this article, from two aspects (cloud computing and big data), an evaluation index system with 15 indexes has been established to evaluate the application level of advanced technologies in smart grid information system. An evaluation model has been built by combining order relation weight method and matter-element extenics. Finally, this evaluation model has been validated via a case of provincial power grid in China, which shows that the evaluation result on application level of advanced technologies could help very well to make decisions, and be theoretically and practically significant for the informatization in smart grid.
Introduction
With the rapid development in China, the robust smart grid needs and depends more and more tightly on information technologies[1], it has become an inevitable trend to research how to make new information technologies and smart grid integrated with each other[2]. New advanced information technologies like big data and cloud computing cannot only change technology application, services and development ideas of electric enterprises, but also help to improve user experiences, to make enterprises and customers share values, to eliminate barriers among industries, to realize energy interconnection, to use energy efficiently, and to harmonically control energy and power[3]. Cloud computing technology with features of unique virtualization, massive data processing function, and high reliability can help electrical power software system (which is characterized with huge data, multi-type information, complicated computation, and independent resources) to analyze data efficiently and to save space on system disk. It has become an indispensible method that electrical enterprises analyze data in circumstance of new information technologies. Some scholars have introduced cloud computing technology into power grid restoration, user-side response, power flow analysis, distributed data management and dispatch system[4,5]. By making use of electric power big data, we can deeply analyze the extra values of massive data from electrical enterprises so to aid them make decisions on management and development in context of big data. At present, big data technology has been applied in processes of electricity generation, transmission, transformation, distribution, utilization and dispatch, and become the basis of information communication platform for enterprises[2].
To sum up, application depth and breadth of new advanced technologies mentioned above will directly impact on the application architecture of power grid information system, and on further reform of informatization, interaction and automation in smart grid[6]. In this article, by establishing an index system, the application levels of advanced technologies used in the information system of power grid enterprises including big data and cloud computing have been analyzed and evaluated so to put forward decision references on application, construction and development of these technologies.
Establishing an Evaluation Model Based on Order Relation Weight Method and Matter-element Extenics
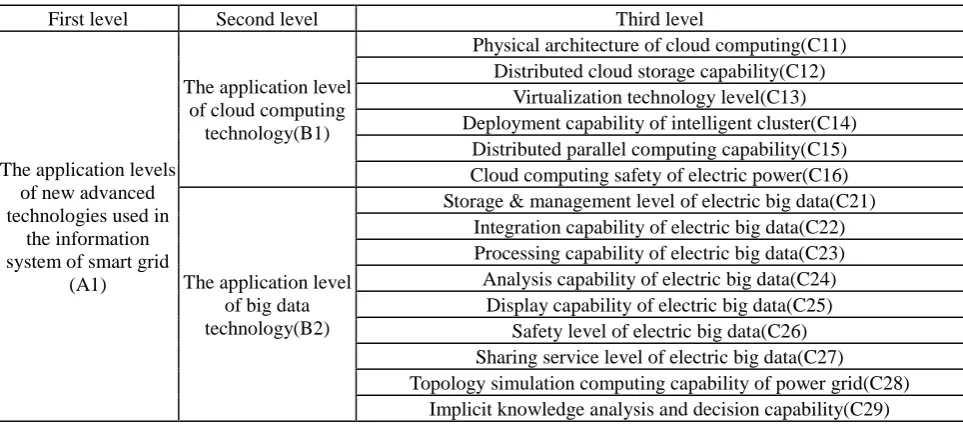
computing and big data as used in the information system of power grid has been established. Table 1. Index system on the application levels of advanced technologies used in the information system of smart grid.
First level Second level Third level
The application levels of new advanced technologies used in
the information system of smart grid
(A1)
The application level of cloud computing
technology(B1)
Physical architecture of cloud computing(C11) Distributed cloud storage capability(C12)
Virtualization technology level(C13) Deployment capability of intelligent cluster(C14)
Distributed parallel computing capability(C15) Cloud computing safety of electric power(C16)
The application level of big data technology(B2)
Storage & management level of electric big data(C21) Integration capability of electric big data(C22) Processing capability of electric big data(C23) Analysis capability of electric big data(C24)
Display capability of electric big data(C25) Safety level of electric big data(C26) Sharing service level of electric big data(C27) Topology simulation computing capability of power grid(C28)
Implicit knowledge analysis and decision capability(C29)
Matter-element Theory
As one basic theory for extenics[7], matter-element is a method to describe things formally. The feature C and its value V of the matter N are expressed as a triple in order as R=(N,C, V). N, C, V are three elements for the matter-element R[8].
When the matter N has multiple features, R could be expressed as a n-dimension matter-element:
1 1 1
2 2 2
( , , )
n n n
R N c v
R c v
R N c v
R c v
(1)
Here, Ri ( , , ),N c vi i i1, 2, ,n is called sub- matter-element ofR.
Extension Set
Extension set can be used to describe the status that the matter is true or false, and the degree that the matter has some feature. A positive value means that the matter has the feature. The larger is the value, the higher is the degree, and vice versa. A negative value means that the matter does not have the feature. The value “0” means that the matter possibly has or does not have the feature. Correlation function is a common approach to describe extension set. In extenics, the distance between the point x on real axis and the interval X0=(a b, ) is defined as below[9].
0
( , )
2 2
a b b a
x X x
(2)
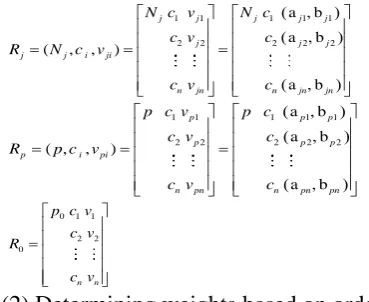
Establishing Matter-element Extenics Evaluation Model
(1) Determining classical threshold and sectional threshold
Given that there are totally t evaluation ranks.Nj stands for the j th evaluation rank,
characteristic variable c ii( 1, 2, , )n is defined within the range of vji (i.e. classical threshold).
p stands for the overall rank, and at the same time characteristic variable ( 1, 2, , ) i
c i n is defined within the range of sectional threshold. p0 stands for the evaluated matter-element, and
the to-be evaluated matter-element is expressed as R0 respectively as following.
1 1 1 1 1
2 2 2 2 2
a b
a b
( , , )
a b
j j j j j
j j j
j j i ji
n jn n jn jn
N c v N c
c v c
R N c v
c v c
(3)
1 1 1 1 1
2 2 2 2 2
a b
a b
( , , )
a b
p p p
p p p
p i pi
n pn n pn pn
p c v p c
c v c
R p c v
c v c
(4)
0 1 1 2 2 0
n n p c v
c v R
c v
(5)
(2) Determining weights based on order relation method
Weights could be determined based on order relation method without establishing judgment matrix, without conducting consistency test, and with characters of small computation volume and high utility. Besides, the numbers of indexes are not limited in this way. Firstly, the hierarchical structure of the evaluation index system has been established. In this evaluation index system, 3-level architecture has been used. The target level is the application level of advanced technologies in company information system framework. There are 3 first-level indexes and several second-level indexes. If evaluation index cmi is more important than evaluation index cmj on the same
evaluation level m m( 1, 2,3) , it is expressed as cmi cmj . As for evaluation index set
1 2
{cm,cm , ,cmk}, k is the numbers of indexes on the evaluation level m. Then the order relation
could be established according to the following steps:
1) Experts will choose the most important index which they think it is, in index set
1 2
{cm,cm , ,cmk} and make it expressed as * 1
m
c .
2) Experts will again choose the most important index which they think it is, from the left k1 index and make it expressed as c*m2.
3) Repeat the steps above.
In this way, a sole order relation could be defined as following.
* * *
1 2
m m mk
c c c (6)
Given that experts’ rational judgment on the importance between evaluation index *
mi
c andc*m i(1)
is expressed as wmi/wm(i 1) as following.
(i 1) 1
/ ( 1, 2, , 1)
mi m i
w w r i k (7)
[image:3.595.68.253.98.249.2]The value of ri1 is given in Table 2.
Table 2. The given value of ri1.
1 i
r Description
1.0 Index c*mi is as important as index c*m i(1)
1.2 Index cmi* is slightly more important than index c*m i(1)
1.4 Index c*miis more important than index cm i*(1)
1.6 Index c*miis critically more important than index
1.8 Index cmi* is extremely more important than index
1.1,1.3,1.5,1.7 intermediate values
1
2
(1 )
k k
mk i
j i j
w r
(8)1 ( 1)( 1, 2, , 1)
mi i m i
w r w i k (9)
In the same way, weight wm for the first level index can be figured out. Finally, weights for each
index could be calculated as below.
*
mk wm wmk
(10)
(3) Determining correlation degree and evaluation rank based on correlation function
The correlation function of each evaluation index to the jth evaluation rank is expressed as
below.
( , ) ( )
( , ) ( , ) ( , )
i ji
i ji ji
j i
i ji
i ji i pi i ji
v V
v V V
K v
v V
v V v V v V
(11)
Here, ( ,v Vi ji) stands for the distance from the to-be-evaluated matter element ci to the
classical threshold. ( ,v Vi pi) stands for the distance from the to-be-evaluated matter element ci to
the sectional threshold. Vji stands for the distance from index ci to the classical threshold of the
jth evaluation rank. The correlation degree of the to-be-evaluated matter element to each
evaluation rank is calculated as Eq. 12, Ranking formula is shown as Eq. 13.
0 1
( ) ( )
n
j i j i
i
K p K v
(12)0 0
0
0 0
( ) min{ ( )}
( ) 1, 2, , max{ ( )} min{ ( )}
j e
j
e e
K p K p
K p e t
K p K p
(13)
Case Study
Determining the Classical Threshold
We will take the practical application of advanced technologies in information system of some electric power company in some coastal province in China to analyze and evaluate here below. The evaluation results are classified as 5 ranks as better (N1)、 good(N2)、 general(N3)、 bad(N4)
and worse(N5). According to experts’ experience, classical thresholds of R1,R2,R3, R4and R5 are
given individually. In table 3, classical threshold intervals for 3 second-level indexes are given. The values of classical threshold for third-level indexes are the same as the one for second-level indexes. Here, a、b are the lower limit and the upper limit respectively. The threshold R1 has both lower
and upper limits, and the left thresholds only have the lower limits.
Table 3. The classical threshold settings for the application level of advanced technologies in company information system framework.
Index R1 R2 R3 R4 R5
a b a b a b a b a b
B1 0.9 1 0.8 0.9 0.6 0.8 0.5 0.6 0 0.5
B2 0.9 1 0.8 0.9 0.7 0.8 0.6 0.7 0 0.6
Weights of Index
Table 4. Weights of each index for the application level of advanced technologies in company information system framework.
Importance order
importance degree
wei
ght Importance order
importa nce degree
weight combination weight
impact of big data(B2)
0.4 3
Storage & management level of electric big
data(C21) 0.18 0.097
Processing capability of electric big data(C23) 1 0.18 0.097 Analysis capability of electric big data(C24) 1.1 0.16 0.088 Integration capability of electric big data(C22) 1.4 0.11 0.063
Topology simulation computing capability of
power grid(C28) 1.2 0.10 0.052
Implicit knowledge analysis and decision
capability(C29) 1 0.10 0.052
Safety level of electric big data(C26) 1.4 0.07 0.037 Display capability of electric big data(C25) 1.1 0.06 0.034 Sharing service level of electric big data(C27) 1.3 0.05 0.026
Impact of cloud computing(
B1)
1.2 0.2
6
Physical architecture of cloud computing(C11) 0.21 0.097 Deployment capability of intelligent cluster(C14) 1 0.21 0.097 Distributed parallel computing capability(C15) 1.2 0.18 0.081 Cloud computing safety of electric power(C16) 1.1 0.16 0.073 Distributed cloud storage capability(C12) 1.3 0.12 0.056 Virtualization technology level(C13) 1.1 0.11 0.051
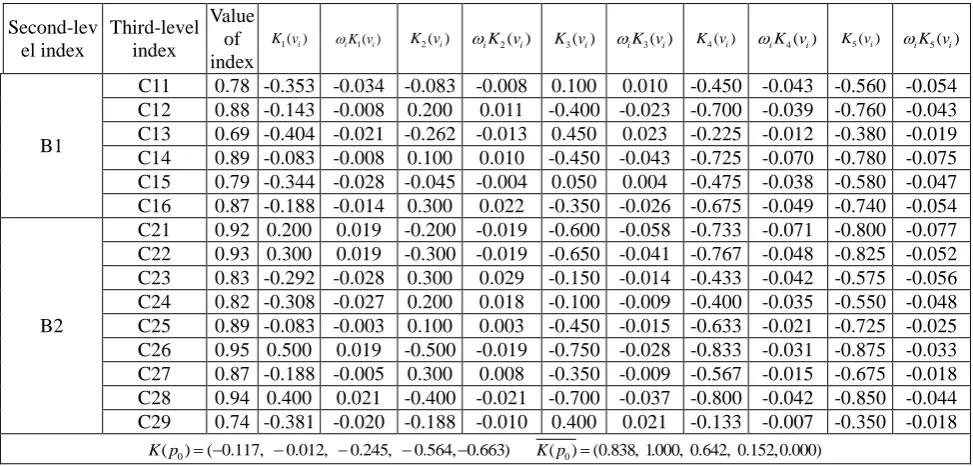
Comprehensive Evaluation on the Application Levels
To make the application of advanced technologies deep into information system framework of this provincial electric power grid company, we firstly have evaluated the application levels of technologies as big data and cloud computing in its information system framework. Scores on each index given by experts are listed in the column 3, Table 5. According to formula(11) and formula
( ) iK vj i
, weight for each index is calculated and listed in column 4 to 13, Table 5. Finally,
[image:5.595.55.542.524.757.2]according to formula(12) and formula(13), the correlation degree and the comprehensive evaluation rank could be figured out. See Table 5:
Table 5. Comprehensive evaluation result on the application level of advanced technologies in company information system framework.
Second-lev el index
Third-level index
Value of index
1( )i
K v iK v1( )i K v2( )i iK v2( )i K v3( )i iK v3( )i K v4( )i iK v4( )i K v5( )i iK v5( )i
B1
C11 0.78 -0.353 -0.034 -0.083 -0.008 0.100 0.010 -0.450 -0.043 -0.560 -0.054 C12 0.88 -0.143 -0.008 0.200 0.011 -0.400 -0.023 -0.700 -0.039 -0.760 -0.043 C13 0.69 -0.404 -0.021 -0.262 -0.013 0.450 0.023 -0.225 -0.012 -0.380 -0.019 C14 0.89 -0.083 -0.008 0.100 0.010 -0.450 -0.043 -0.725 -0.070 -0.780 -0.075 C15 0.79 -0.344 -0.028 -0.045 -0.004 0.050 0.004 -0.475 -0.038 -0.580 -0.047 C16 0.87 -0.188 -0.014 0.300 0.022 -0.350 -0.026 -0.675 -0.049 -0.740 -0.054
B2
C21 0.92 0.200 0.019 -0.200 -0.019 -0.600 -0.058 -0.733 -0.071 -0.800 -0.077 C22 0.93 0.300 0.019 -0.300 -0.019 -0.650 -0.041 -0.767 -0.048 -0.825 -0.052 C23 0.83 -0.292 -0.028 0.300 0.029 -0.150 -0.014 -0.433 -0.042 -0.575 -0.056 C24 0.82 -0.308 -0.027 0.200 0.018 -0.100 -0.009 -0.400 -0.035 -0.550 -0.048 C25 0.89 -0.083 -0.003 0.100 0.003 -0.450 -0.015 -0.633 -0.021 -0.725 -0.025 C26 0.95 0.500 0.019 -0.500 -0.019 -0.750 -0.028 -0.833 -0.031 -0.875 -0.033 C27 0.87 -0.188 -0.005 0.300 0.008 -0.350 -0.009 -0.567 -0.015 -0.675 -0.018 C28 0.94 0.400 0.021 -0.400 -0.021 -0.700 -0.037 -0.800 -0.042 -0.850 -0.044 C29 0.74 -0.381 -0.020 -0.188 -0.010 0.400 0.021 -0.133 -0.007 -0.350 -0.018
0
( ) ( 0.117, 0.012, 0.245, 0.564, 0.663)
K p K p( 0)(0.838, 1.000, 0.642, 0.152,0.000)
ranks better, and reflects that the application level of advanced technologies in this company is higher. By calculating, the correlation degrees of each rank to classical threshold are figured out for big data and cloud computing respectively as following: (0.778, 1.000, 0.333, 0.111, 0.000)
(0.415, 1.000, 0.792, 0.132,0.000).
It is obvious that the application levels of big data technology and cloud computing technology rank good. The evaluation process and results reflect the real situation on application level of advanced technologies in company information system framework of this provincial power grid. The application of big data and cloud computing in this provincial power grid company is advanced and can be referenced for follow-up similar evaluation. Besides, the comprehensive evaluation model has been proved as a feasible, scientific and rational evaluation method.
Summary
Based on the depth and breadth of the advanced technologies’ application in company information system framework, an index system for the application level has been established. After describing and analyzing how to determine weight of index and how to choose the comprehensive evaluation model, order relation method and matter-element extenics method have been applied to this evaluation model. Via a case study on the application level of advanced technologies in information system framework of a provincial power grid company, the evaluation model has been proved as a scientific, rational and feasible method.
Acknowledgement
This paper is supported by the Fundamental Research Funds for the Central Universities (Grant No.2015MS36).
References
[1] Yu Yixin, Luan Wenpeng. Smart Grid and Its Implementation[J]. Proceedings of the CSEE, 2009, 29(34):1-8.
[2] Zhu Chaoyang, Wang Jiye, Deng Chunyu. Research and Design of Electric Power Big Data Platform[J]. Electric Power Information and Communication Technology, 2015,13(6):1-7.
[3] Duan Junhong, Zhang Naidan, Zhao Bo, et al. Electric Power Information and Communication Technology, 2015,13(2):92-95.
[4] Zhang Hao, He Jinghan, Yin Hang, Bo Zhiqian, Tony Yip. Power Grid Islands Service Restoration Based on Cloud Computing[J]. Proceedings of the CSEE, 2011,31(34):77-84.
[5] Cao Zijian, Lin Jin, Song Yonghua. Optimization Model for Resources Allocation of Cloud Computation in Active Distribution Networks[J]. Proceedings of the CSEE, 2014,(19):3043-3049.
[6] Li Xiangzhen, Liu Jianming. Telecommunications Network Technology, 2010,(8):41-45.
[7] Cai Wen. Matter-element Model and Its Application [M]. Beijing: Scientific and Technical Documentation Press, 1994.
[8] Wang Yonghua, Luo Guoliang. Research on power quality evaluation based on matter-element extension model [J]. Applied Mechanics and Materials, 2013, 411-414:2735-2741.