Patient Related Outcome Measures
Identifying functional decline: a methodological
challenge
Karen Grimmer Kate Beaton Kevan Hendry
International Centre for Allied Health Evidence, University of South Australia, Adelaide, SA, Australia
Correspondence: Karen Grimmer International Centre for Allied Health Evidence, University of South Australia, City East Campus, North Tce, Adelaide, SA 5000, Australia
Email [email protected]
Background: Functional decline (FD) in older people has commonly been measured in the hospital setting with instruments which have been validated on decrease over time in capacity to undertake basic activities of daily living (ADL). In a nonhospitalized sample of older people (independently community dwelling, but potentially on the cusp of FD), it is possible that other measures could be used to predict decline. Early, accurate, and efficient identification of older community-dwelling people who are on the cusp of FD can assist in identifying appropriate interventions to slow the rate of decline.
Methods: This paper reports on associations between four outcome measures which have been associated with FD (instrumental ADLs [IADLs], quality of life, hospitalizations and falls). The sample was older individuals who were discharged from one large metropolitan emergency department (ED) during 2011–2012, without an inpatient admission.
Results: Of 597 individuals aged 65+ who provided baseline information, 148 subjects provided four outcome measures at both 1 and 3 months follow up. Overall, approximately 24% dem-onstrated decreased IADL scores over the 3 months, with domains of home activities, laundry, shopping, and getting places declining the most. Over this time, 18% fell often, and 11% were consistently hospitalized. Between 1 and 3 months follow up, 41% declined in mental component scores, and 50% declined in physical component scores. Low mental and physical component quality of life scores were associated with downstream increased falls and hospitalizations, and decreased quality of life and IADLs. However, change in the four outcome measures was largely independent in factor analysis.
Conclusion: Measuring the four outcome measures over 3 months post-discharge from an ED presentation, showed that changes in one were not generally correlated with changes in another. This result suggests that a wider measurement net could be cast to identify individuals who may not be coping safely or independently in the community after a minor health crisis. Individuals who declined in at least one outcome measure at 1 month, generally continued to decline over the next 2 months, thus suggesting early opportunities to screen and intervene to slow FD.
Keywords: IADL, falls, hospitalization, quality of life, emergency department
Introduction
Functional decline (FD) has been characterized as loss of functional autonomy associ-ated with age.1,2 Relationships between FD, its progress and manifestations, and frailty have been proposed, but no standard approach exists for defining or measuring either state.3,4 FD often occurs subtly, and thus can be undetected until an unexpected and often catastrophic event occurs. This can be a bad fall, or unexplained ill health which requires hospitalization, which then highlights the magnitude of an individual’s loss of capacity to function safely at home.2,5,6 FD has been correlated with factors such as
Dovepress
O R I G I N A L R E S E A R C H
open access to scientific and medical research
Open Access Full Text Article
Patient Related Outcome Measures downloaded from https://www.dovepress.com/ by 118.70.13.36 on 26-Aug-2020
For personal use only.
Number of times this article has been viewed
This article was published in the following Dove Press journal: Patient Related Outcome Measures
infirmity, chronic illness, loss of self-esteem and confidence, cognitive loss, falls from standing height, loss of muscle bulk and strength, and taking multiple medications.2,3,6–11 However there is no agreement on the best measures to detect the onset of FD, nor when a point of critical deterioration has been reached (when intervention to provide support for community living is essential).11
Our research is focused on older adults living indepen-dently in the community, who are not yet on the “health radar” because no serious health event has occurred to date, yet may be on the cusp of FD (eg, they are “accidents waiting to happen”). These individuals usually do not come to the attention of the health system until they are in later stages of health and/or social crisis.12 Even individuals who are already receiving community services at home (such as government-funded community care packages) may not be receiving the care required to prevent FD.13 Evaluation of recent changes to the way that general medical practitioner (GP) services are provided in Australia (eg, by large corporate health ser-vices, or in multidisciplinary community clinics) suggest that many older people no longer have regular contact with the same GP, and thus they are known to use hospital emergency departments (ED) as a source of “general practice” care for non-catastrophic health crises.14,15 However ED may not be the best place to identify them as having incipient FD because of its focus and organization on emergency care, and thus we hypothesized that this cohort of older people attending ED was potentially an unrecognized community-dwelling group whose functional changes after discharge from ED for a non-catastrophic health event could provide rare insights into unaddressed FD.
Detecting FD early, and putting supports in place to address areas of need has been proposed as a way of arrest-ing FD, and assistarrest-ing older people to remain independent, willingly and safely, for longer, at home.6,16–19 Comprehensive frailty indices with multiple screening items have been pro-posed from population research, mainly conducted in the UK and Canada.2,10,11,20 However there are few opportunities in Australia to capture this amount of information from the type of older person in which we are interested. Thus, capturing them in ED with a non-catastrophic health event not requiring hospitalization was one persuasive recruitment approach to capture a broad representation of the target group.
The FD screening tools currently reported in the litera-ture are implemented at “point-in-time”, usually when the older person is in a health crisis (during hospitalization). We found seven published FD screening instruments for use in hospital in our recent systematic literature review.21 However
the validity of applying these FD assessment instruments to older people in hospital is questionable, as assessment occurs in abnormal circumstances (unfamiliar environments, when they are unwell, disoriented, affected by new medications, anxious about the future, or perhaps without family support). FD assessments are therefore likely to provide different scores in hospital, than in usual community circumstances.
The hospital FD screening instruments have mostly been validated by comparison with capacity to undertake basic activities of daily living (ADLs).5 Items and measures of FD in the current hospital FD screening instruments21 are outlined in Table 1. Assessment of basic ADLs requires self-report of ability to complete everyday tasks within a recent time period (days or weeks), proposed as valid ways of assessing function.18–20 These tasks include bathing, dress-ing, transferrdress-ing, toiletdress-ing, and eating. However early FD requires more sensitive detection, which is why instrumental activities of daily living (IADLs) are often used. These mea-sure higher order functioning such as using the telephone, managing medications and money, getting to places beyond walking distance, preparing meals, grocery shopping, doing housework or handyman work, and doing laundry.22,23 In a number of FD screening instruments, however, self-reports of IADLs are made at the time of screening, while instru-ment validation is made with loss of functional ability over time, assessed as change in basic ADLs.23 This discrepancy reflects a mismatch in ADL measures, which may influence the sensitivity of initial screening.
This paper reports on change over 3 months in our target group, in four measures which are reported in the literature as potential indicators of FD (IADLs, quality of life, rate of falls, and unplanned hospitalization).2,3,6–11
Methods
Ethical approval was obtained from the two universities of the researchers, and the participating hospital.
This paper and our previous publication on this dataset30 were guided by the Strengthening the Reporting of Obser-vational Studies in Epidemiology (STROBE) statement for quality reporting of observational studies.31
Design and setting
This paper reports on follow up data from an observational study on the Royal Adelaide Hospital ED (without an inpatient admission), from which a cohort of independent, community-dwelling older people was recruited, and dis-charged. This paper reports on outcome data collected at telephone follow up at 1 and 3 months, post-ED discharge.
Dovepress Grimmer et al
Patient Related Outcome Measures downloaded from https://www.dovepress.com/ by 118.70.13.36 on 26-Aug-2020
Tab
le 1
Summary of items in functional decline assessment instruments
Instrument
Items
Measure of functional decline
Psychometric properties
HARP
6
Age Cognition (Mini Mental State Examination [MMSE])
33
Instrumental activities of daily living (managing finances, taki
ng
m
ed
ic
at
io
ns
, t
el
ep
ho
ni
ng
, s
ho
pp
in
g,
u
sin
g
tr
an
sp
or
ta
tio
n,
preparing meals, and doing housework) 2 weeks before admission
Rate of ADL decline (unspecified instrument) over 3 months (2 sets of measures taken 3 months apart of ADLs in the preceding 2 weeks)
Validity: Area under ROC curve
=
0.65
Reliability: Not reported Population: Aged
$
70 who were hospitalized for acute medical illness in
one of 6 hospitals in the USA
Inouye et al
24
Decubitus ulcer Cognitive impairment Functional impairment Low social activity level
Katz
23 time until ADL decline as the
outcome, Inouye et al
19 indicated
decline on two points or more on ADLs, no specified time period
Validity: ‘Low’ cut off
=
Sensitivity: 88% Specificity: 54%
Reliability: not reported Population: Aged
$
70 in ED of a US urban teaching hospital
ISAR
25
Functional dependence (premorbid and acute change), recent hospitalization, impaired memory and vision, and poly-medication
ADL change over 6 months
Validity: Cut off 2/6
=
Sensitivity: 0.72 Specificity: 0.58 AUC: 0.71
Reliability: Test-retest reliability. Concordance correlation c
oefficient: 0.78
Population: Aged
$
65 in ED of four acute care university affiliated
hospitals in Montreal
SHERPA
26
Age, impairment in premorbid instrumental ADLs, falls in the year before hospitalization, cognitive impairment (Abbreviated MMSE below 15/21) and poor self-rated health ADL functioning assessed at discharge and 1 and 3 months later, functional decline defined as the loss of at least one point on the ADL scale in this time Validity: Sensitivity: 67.9% Specificity: 70.8% AUC: 0.734 Reliability: not reported Population: aged
$
70 in ED of 2 academic hospitals in Belgium
TRST
8
Presence of cognitive impairment Difficulty walking, transferring or recent fall Lives alone with no available caregiver Five or more prescription medications ED use in previous 30 days or hospitalization in previous 90 days Registered nurse concern (eg, presence of alcohol use) Loss of one or more ADLs and one or more IADLs from baseline, at 30 and 120 days Validity: At 30 days Sensitivity: 0.87 Specificity: 0.30 AUC: 0.64 Reliability: not reported Population: aged
$
65 EDs of two urban
academic hospitals, USA
BRIGHT
27
Need help with housework, times tripped or fallen, depression, general health, shortness of breath with light activity, need help with bathing, memory problems, difficulty making decisions, need help dressing lower body, need help with transfers, and need help with personal grooming
Geriatric assessment (iNTER-RAI)
28
Validity: Predicting IADL deficit Cut off 3
+
Sensitivity: 0.76 Specificity: 0.79 AUC: 0.83 Predicting cognitive performance Cut off 4
+
Sensitivity: 0.70 Specificity: 0.74 AUC 0.73 Predicting ADLs Cut off 3 or 4 Sensitivity: 0.69 Specificity: 0.70 AUC: 0.66 Reliability: reported as good, but no supporting statistics supplied Population: aged
$
75 years in an acute care hospital in New Zealand
(
Continued
)
Dovepress Detecting the onset of functional decline
Patient Related Outcome Measures downloaded from https://www.dovepress.com/ by 118.70.13.36 on 26-Aug-2020
Sample recruitment
Comprehensive details on sample recruitment, retention, and characteristics are reported elsewhere.30 In summary, older individuals who presented to ED without life-threatening health situations, and who were discharged directly to home were eligible to participate. They were identified using a standard protocol, by independent researchers situated in ED for 12 hours a day, 7 days a week, for 14 weeks, to capture a consecutive sample.
Eligibility criteria
Subjects were eligible to participate if aged over 65 years (or over 45 years for Aboriginal and Torres Strait Islanders). Potentially eligible subjects were then excluded if they were likely to be admitted to hospital (as an inpatient), were suf-fering from a terminal illness, lived permanently in residen-tial care, had an inadequate understanding of written and spoken English and did not have an interpreter available, were sufficiently hearing-impaired to prevent them from communicating via telephone at follow up, did not have a home telephone, were reported as having dementia or were considered by hospital staff not to be lucid due to their ill-ness, were under observation for self-harm, under suspicion of contagious disease, or under detention. Participants were also excluded at first telephone follow up, if they reported an inpatient admission after the index ED presentation, despite initially being eligible for inclusion. This could happen if ED staff indicated initially that the individual was likely to be discharged directly home, however following recruitment, consenting, and baseline data collection, the decision to dis-charge the individual directly home was later reversed by ED staff, but was not communicated to the researchers.
Outcome measures
Researchers administered a purpose-built, validated screen-ing questionnaire after recruitment and consentscreen-ing in ED. This questionnaire comprised 37 questions on demographics, falls history (Falls Risk for Older People in the Community [FROP-Com] Screen,32 function (Lawton’s Instrumental Activities of Daily Living),22 and cognitive ability (abbrevi-ated Mini Mental State Examination [MMSE]).33 FROP-Com Screen, IADL, and MMSE are reported as reliable and valid in similar aged individuals.22,23,32–35
Researchers then telephoned subjects at 1 and 3 months post-ED discharge, verified subjects’ ongoing eligibility, and administered a modified version of the initial screening questionnaire, in which the MMSE33 was substituted with the Medical Outcomes Trust Short Form 12-Item (SF-12v2TM)
Tab
le 1
(
Continued
)
Instrument
Items
Measure of functional decline
Psychometric properties
Simplified PROFUNCTION
29
Seven items
$
85 years, neurological condition,
osteoarticular disease, III–IV functional class of dyspnea, four polypathology categories, basal index
,
60, and social
problems
Functional decline was defined as loss of
.
20 points on Barthel’s
index
23 over 12 months
Validity: Developmental cohort: AUC 0.59 (range: 0.526–0.635) Validation cohort: AUC 0.56 (range: 0.51–0.641) Reliability: good obtained calibration in derivation cohort (
P
=
0.13) in the
Hosmer–Lemeshow goodness-of-fit test. Global functional decline rate in the validation cohort was 42% Population: aged
$
60 from 36 Spanish hospitals
Abbreviations:
AUC, area under the curve; ED, emergency department; IADL, instrumental activities of daily living; ROC, receiver operating characteristic.
Dovepress Grimmer et al
Patient Related Outcome Measures downloaded from https://www.dovepress.com/ by 118.70.13.36 on 26-Aug-2020
Health Survey (RAND Health Communications, Santa Monica, CA, USA).36 The reliability and validity of the SF-12 for this age group has previously been reported.36,37
Data collection
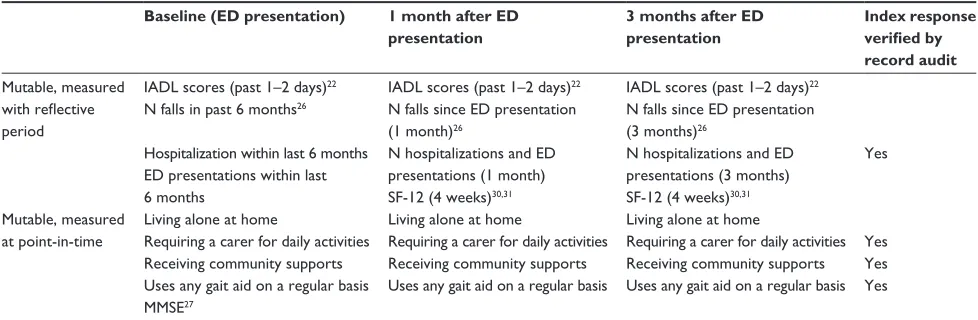
A purpose-built MS® Excel (Microsoft Corporation, Redmond, WA, USA) file was used to record data at each contact point. Data were divided into immutable inde-pendent variables (age, sex, postcode, schooling, marital status, etc), and two sets of mutable outcome measures (see Table 2):
• those measured at point-in-time (with no reflective period), and
• those with a reflective period (for instance, past days or weeks).
Mutable outcome measures with a reflective period are the focus of this paper (see the first four measures in Table 2), as change in these measures over a 3-month period offered opportunities to measure FD in different ways.
Continuing sample classification
From a well-powered sample of 600 eligible, consenting subjects recruited in ED,30 597 subjects provided baseline data and were eligible to continue in the study, as at final contact with researchers in ED, it was believed they would be discharged directly home. Four samples were catego-rized from the follow up telephone calls: Sample 1, eligible subjects who provided baseline and 1-month data only (two time points) (ie, did not provide data at 3 months); Sample 2: eligible subjects who provided baseline and 3-month data only (two time points) (ie, did not provide data at 1 month); Sample 3: eligible subjects who provided baseline, 1 month and 3-month data (three time points), and Sample 4: subjects who subsequently became ineligible, were uncontactable or refused further participation.
Analysis
Analysis was undertaken using SAS Version 9.3 (SAS Institute Inc, Cary, NC, USA). For each mutable outcome measure, change was calculated to a standard, time- reference point to support comparison over repeated points in time. Numbers of falls and hospitalization presentations (includ-ing ED) were standardized to 1 month, IADLs were used in their raw form (reflecting the past 1–2 days), and quality of life (QoL) (SF-12) scores were transformed as per scoring instructions37 to a scale of 100, with reflections over the previ-ous month; (see Table 2). The reflective measures of outcome and their time periods are illustrated in Figure 1.
Descriptive statistics of the four outcome measures were reported.
• For the QoL component scores, the means and 95% con-fidence interval for the physical and mental component scores at 1 and 3 months were generated, for comparison with population means,38 for sex and age groups. • Total IADL scores and individual domains were
consid-ered at each time point.
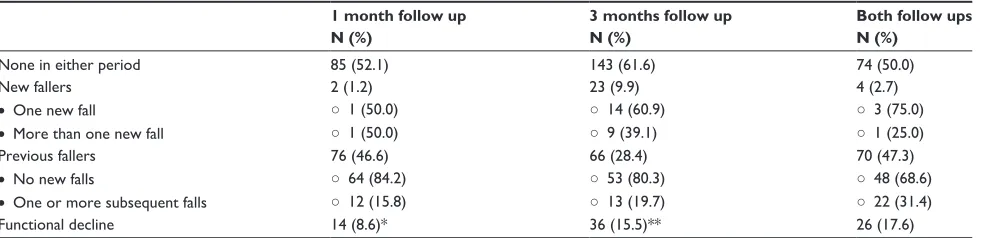
• Subjects were categorized as no falls being recorded at either baseline or follow up periods, a new faller at follow up (and how many falls were experienced), previous faller at baseline who had had no subsequent falls, or a repeat faller who had experienced further falls since baseline (and how many). The potential for FD was determined as all new and previous fallers who had suffered one or more subsequent falls since baseline. A similar approach was taken for hospitalizations.
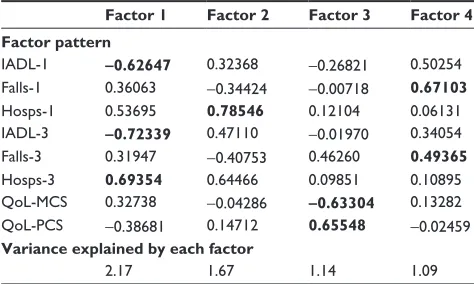
Subjects who demonstrated negative change in any outcome measure over time (deterioration) were reported at each time period. Logistic regression analysis models were constructed to examine the association between outcome measures at baseline, 1, and 3 months (as appropriate). Median or logical values were applied as cut-points. These models were adjusted by age and sex. Factor analysis, using principal component analysis and varimax rotation, was employed to examine the loading of change over time in outcome measures (baseline to 1 month, baseline to 3 months, and in the case of QoL, change between 1–3 months). Data from Samples 1 and 2 (which included Sample 3) were used for factor analysis.
Results
Sample description
Of the 597 subjects eligible for the study when the researcher left them in ED (all of whom provided baseline measures): • Sample 1: 163 subjects provided measures of IADLs,
QoL, falls and hospitalizations at 1-month follow up; 15 of these subjects did not provide 3-month follow up data.
• Sample 2: 248 subjects provided measures of IADLs, QoL, falls, and hospitalizations at 3-month follow up. Within this sample was Sample 3, comprising 148 (163–15) subjects who provided 1- and 3-month data. • Sample 4: 335 subjects did not provide any follow up
data. At 1-month follow up, five subjects had died in the interim, and 95 refused to participate further. At this contact, 122 subjects were ruled ineligible: 96 had not been discharged directly to home as planned, and had
Dovepress Detecting the onset of functional decline
Patient Related Outcome Measures downloaded from https://www.dovepress.com/ by 118.70.13.36 on 26-Aug-2020
Table 2 Mutable outcome measures
Baseline (ED presentation) 1 month after ED
presentation
3 months after ED presentation
Index response
verified by
record audit
Mutable, measured with reflective period
IADL scores (past 1–2 days)22 IADL scores (past 1–2 days)22 IADL scores (past 1–2 days)22
N falls in past 6 months26 N falls since ED presentation
(1 month)26
N falls since ED presentation (3 months)26
Hospitalization within last 6 months ED presentations within last 6 months
N hospitalizations and ED presentations (1 month)
N hospitalizations and ED presentations (3 months)
Yes
SF-12 (4 weeks)30,31 SF-12 (4 weeks)30,31
Mutable, measured at point-in-time
Living alone at home Living alone at home Living alone at home
Requiring a carer for daily activities Requiring a carer for daily activities Requiring a carer for daily activities Yes Receiving community supports Receiving community supports Receiving community supports Yes Uses any gait aid on a regular basis Uses any gait aid on a regular basis Uses any gait aid on a regular basis Yes MMSE27
Abbreviations: ED, emergency department; IADL, instrumental activities of daily living; MMSE, Mini Mental State Examination; SF-12, SF-12v2TM, Medical Outcomes Trust Short Form 12-Item Health Survey (RAND Health Communications, Santa Monica, CA) Health Survey; N, number.
been admitted to a hospital bed as a result of the index ED presentation, 12 had been discharged from ED to another hospital, five had entered a residential care facility in the intervening month, nine were found to be ineligible for inclusion and should not have been included at baseline (eg, living in a residential aged care facility, too confused to answer the questions, or we were informed by a care-giver that they had dementia, ,65 years and reported they were not Aboriginal or Torres Strait Islander, or were being treated for a terminal disease). A further 113 subjects were unable to be contacted despite three attempts at different times of the day, and five indicated that they would have participated but were too unwell to do so and did not make another appointment.
QoL and IADLs
Table 3 reports the median values (min, max, 25th percen-tile, 75th percentile) for change in IADL scores between baseline and 1 month, and baseline and 3 months, as well as change in QoL scores between 1 and 3 months. This table also reports on the percentage of subjects who suffered any deterioration in these measures over these periods (where scores on the next administration of the test were lower than the preceding scores).
Continual IADL decline over the 3-months follow up was reported from the subset of 148 subjects who provided baseline, 1, and 3-month data. Continual decline was identi-fied when the 1-month IADL score was less than the baseline score, and the 3-month score was less than, or equal to, the 1-month score; 24.3% subjects showed continual decline in the overall IADL score, and the individual domains of get-ting places, home activities, shopping and laundry showed
the highest rates of continual decline (respectively 10.1%, 9.5%, 8.1%, and 6.8%). The remaining domains shown, had less than 5% decline.
The men and women in our sample exhibited similar SF-12 physical and mental component scores to the sex–age popu-lation norms at both follow up times (see Table 4), although the range of scores in our sample was broader in all instances than the population norms. Within the study sample, there was a significant difference between the sex–age groups for the physical component score (PCS) 3-month score, with the over 75-year-old women demonstrating significantly lower scores than the other groups. There was also a significant sex–age difference in change in PCS between 1 and 3 months (P = 0.01), with negative change noted in older women and men, and positive change noted for the younger women and men. There was minimal change for the oldest women. There were no significant sex –age differences at P , 0.05 for the mental component score (MCS), but there was a trend toward lower scores (P = 0.07) for the younger women. Overall, the mental and physical component scores in the SF-12 instrument appeared to be independent of each other, with correlation (r2) of 3% derived from linear regression modelling. Moreover, of the 148 subjects providing 1 and 3-month QoL scores, 56.1% showed negative change in the mental component score while showing positive change in the physical component score.
Falls and hospitalizations
Of the post-ED sample, 354 subjects had not suffered a fall in the previous 6 months (59.2%). Over the 3-month follow up, approximately 18% of individuals were clas-sified as declining in function (see Table 5). The average rate of subjects’ decline (versus no decline) in falls at
Dovepress Grimmer et al
Patient Related Outcome Measures downloaded from https://www.dovepress.com/ by 118.70.13.36 on 26-Aug-2020
1 month post-ED presentation was 8.8%, which increased at 3 months to 10.3% for subjects who had not declined after 1 month, and 33.3% for subjects who had declined after 1 month.
Regarding hospitalizations, 412 (69.0%) of the 597 subjects recruited at baseline had not been admitted to hospital (ED or ward) in the 6 months before the index ED presentation. Of Sample 1 (where 152 had audit notes per-taining to previous hospitalizations), there were 106 subjects without a previous hospitalization 6 months prior to the
index admission (69.7% audit-relative follow up sample). Considering Sample 3, the 32 individuals who were hos-pitalized between the index admission and the first month interview, were also hospitalized during the next 2 months. Furthermore, in the month before 3-month follow up, they all reported numbers of hospitalizations at least as many as in the month prior to the 1-month follow up. For this subgroup, the total number of subsequent hospitalizations (between 1 and 3 months’ interviews) was 105 (ranging from 1–20). Data are reported in Table 6. One admission in each follow up period
Index ED presentation 6 months prior to ED presentation
N falls
N hospitalizations
N ED presentations
1 month after ED presentation
IADL
(1–2 days) (1–2 days)IADL
3 months after ED presentation
IADL (1–2 days)
N falls
N hospitalizations
N ED presentations
N falls
N hospitalizations
N ED presentations
SF-12
(30 days) (30 days)SF-12
Figure 1 Measurement points of reflective mutable outcomes.
Abbreviations: ED, emergency department; IADL, instrumental activities of daily living; N, number; SF-12, Medical Outcomes Trust Short Form 12-items.
Table 3 Descriptive statistics for change in IADLs and quality of life over time points
N Median Min Max 25th% 75th% % who deteriorated in scores
1-month change in IADL† 163 0 -12 7 -1 0 26.4
• Telephone 0 -2 0 0 0 2.5
• Medication 0 -1 1 0 0 4.3
• Money 0 -2 2 0 0 4.3
• Getting places 0 -2 1 0 0 15.3
• Preparing meals 0 -2 1 0 0 9.8
• Shopping 0 -2 2 0 0 13.5
• Home activities 0 -2 2 0 0 16.6
• Laundry 0 -2 2 0 0 11.0
3-month change in IADL† 248 0 -13 16 -1 0 36.7
• Telephone 0 -2 2 0 0 4.0
• Medication 0 -2 2 0 0 5.2
• Money 0 -2 2 0 0 7.2
• Getting places 0 -2 2 0 0 19.8
• Preparing meals 0 -2 2 0 0 14.1
• Shopping 0 -2 2 0 0 21.0
• Home activities 0 -2 2 0 0 22.2
• Laundry 0 -2 2 0 0 16.5
QoL (mental component)& 148 0.8 -21 28 -4 5.2 41.2
QoL (physical component)& 148 -0.4 -28 23 -6 3.3 50.0
Note:†Change measured from baseline and &change measured from 1–3 months. Abbreviations: IADL, instrumental activities of daily living; QoL, quality of life.
Dovepress Detecting the onset of functional decline
Patient Related Outcome Measures downloaded from https://www.dovepress.com/ by 118.70.13.36 on 26-Aug-2020
Table 4 Population norms, and sample descriptive statistics for quality of life component scores
F M Sample
differences
65–74 75+ 65–74 75+
N = 32 N = 47 N = 35 N = 33
Mean (95% CI)
Population data 43.4 (40.9–45.8) 38.5 (36–40.9) 45.5 (42.9–47.9) 40.9 (38.3–43.4)
PCS 1 month 41.5 (26–62) 41 (26–56) 48 (28–62) 48 (28–62) P = 0.08
PCS 3 month 43.5 (25–61) 38 (25–56) 50 (21–62) 43 (29–60) P = 0.01
Population data 53.7 (51.9–55.4) 53.6 (51.8–55.4) 54 (52.5–55.6) 53.4 (51.5–55.4)
MCS1 month 52 (36–67) 56 (35–62) 53 (34–65) 55 (35–63) P = 0.94
MCS3 month 50.5 (30–62) 56 (37–63) 56 (42–63) 56 (43–63) P = 0.07
Mean difference (SD)
PCS 1–3 month 0.9 (5.7) –2.9 (10.4) 2.1 (7.6) -3.0 (7.2) P = 0.01
MCS 1–3 month –1.8 (7.8) 0.5 (7.6) 2.2 (7.8) 2.3 (8.1) P = 0.16
Abbreviations: CI, confidence interval; F, female; M, male; MCS, mental component score; PCS, physical component score; SD, standard deviation.
was considered to be a reasonable service use for individu-als in this age group. Potential FD was thus determined as individuals who were hospitalized more than once in each fol-low up period, subsequent to their index admission (N = 16). These individuals reflected approximately 11% of subjects who provided baseline, 1 month and 3 months’ data.
Associations between mutable outcome measures Using data from Sample 3, odds ratios adjusted for age and sex were calculated for pairs of outcome measures at different time points. Findings are reported in Table 7. Key findings were that:
• Previous hospitalizations before recruitment were related to low quality of life MCS at 1-month follow up, and low PCS at both 1 and 3 months follow up. This measure was also related to increased falls at 1 and 3 months follow up. • Low ADL scores at baseline were associated with low
ADL scores and low PCS scores at both follow up periods.
• Low MCS scores at 1 month follow up were associated with low PCS scores, and increased falls at the same time period.
• Increased falls at 1 month follow up were associated with increased falls at 3 months, which were associated with increased hospitalizations at 3 months
Factor analysis
Factor analysis supported the patchy associations between the outcome measures (see Table 8). Using data from Sample 3, four clear factors were identified. These latent variables were mapped most strongly onto outcome measures of similar type, with QoL domains being mapped with opposite directionality primarily by Factor 3, Factor 4 mainly reflect-ing number of falls, and also relatreflect-ing to IADL changes at 1-month follow up. Factor 1 had a strong relationship with IADL changes at both 1 and 3 months as well as hospitaliza-tions at 3 months, and Factor 2 was the main influence on 1 month hospitalizations and also had a strong influence on 3 month hospitalizations.
Discussion
This paper, as far as we are aware, is one of the first to present multiple health outcome measures, and multiple time-point
Table 5 Percentage of subjects showing decline as assessed by falls
1 month follow up N (%)
3 months follow up N (%)
Both follow ups N (%)
None in either period 85 (52.1) 143 (61.6) 74 (50.0)
New fallers 2 (1.2) 23 (9.9) 4 (2.7)
• One new fall ○ 1 (50.0) ○ 14 (60.9) ○ 3 (75.0)
• More than one new fall ○ 1 (50.0) ○ 9 (39.1) ○ 1 (25.0)
Previous fallers 76 (46.6) 66 (28.4) 70 (47.3)
• No new falls ○ 64 (84.2) ○ 53 (80.3) ○ 48 (68.6)
• One or more subsequent falls ○ 12 (15.8) ○ 13 (19.7) ○ 22 (31.4)
Functional decline 14 (8.6)* 36 (15.5)** 26 (17.6)
Notes: *One month follow up figures calculated only at first month after ED presentation; **3-month follow up figures calculated only at third month after emergency department presentation; NB, total numbers reported for falls may differ from total number in each cohort due to missing information.
Dovepress Grimmer et al
Patient Related Outcome Measures downloaded from https://www.dovepress.com/ by 118.70.13.36 on 26-Aug-2020
follow up data, on a consecutively-sampled cohort of older people who were discharged from ED in a large tertiary hospital in one capital city in Australia (without an inpatient admission). This study assessed the potential for downstream FD over 3 months using outcome measures which could change over time (IADLs, QoL, falls and hospitalizations.) This paper highlights that any of these measures are poten-tial proxies for FD, and that changes in one measure are not necessarily correlated with changes in another. More importantly, this research showed that in general, individu-als who demonstrated decline in one measure at 1 month post-ED discharge generally continued to decline over the next 2 months. This finding suggests that early action could be taken to identify potentially at-risk individuals, using screening at 1 month, and change in one or more outcome measures over the next 2 months, after an older person has come to the attention of health care providers for a minor health crisis.
Between 1 and 3 months following an index ED admis-sion, QoL declined for 40%–50% of individuals across both physical and mental domains. No measures of QoL were taken at recruitment (baseline), which is a limitation of the study design. We hypothesized that individuals’ QoL may have been compromised at 1 month post-recruitment because of the recency of their health crisis, but under usual circum-stances QoL might have improved over the next few months, as their health improved. For many subjects this improvement occurred, given equivalence with the distribution of age-sex population norms. However the fact that approximately half the sample deteriorated over 3 months post-index ED pre-sentation suggests that a “driver” for FD could be declining physical capacity, or loss of confidence.
Between discharge from ED and 1 month follow up, 26.4% of subjects declined in total IADL scores, and
between discharge from ED and follow up 3 months later, 36.7% subjects declined in total IADL scores. Considering the individuals who provided three time points of data col-lection, approximately 10.8% declined in IADL scores over both time periods, and of the subjects who showed decline at 1 month, 87.5% of them indicated decline relative to baseline at 3 months. While shopping, home activities, and getting places were the domains showing the greatest dete-rioration over 3 months, there was considerable variation in performance within the individual domains. This finding suggests that while the total IADL score is potentially a useful measure of FD, individual activities could also be sensitive indicators of decline. Flagging individual aspects of ADL early could provide an opportunity to intervene with specific timely supports.
Increases over time in falls (17.6%) and hospitalizations (11%) also provide early opportunities to flag individuals with the potential to be in FD. There was a dramatic increase in falls and hospitalizations for a subset of the sample, from a baseline of few previous problems, to up to 10 falls and 20 hospitalizations within the next 3 months. These measures would seem to provide readily identifiable markers of func-tion that could be tracked early.
There were inconsistent associations between time-series outcome measures (Table 7), although there were clear indi-cations that previous hospitalizations at recruitment, and low MCS and PCS scores at 1 month follow up, were strongly associated with downstream change in other measures. The factor analysis, however, indicated a lack of correlation between change over time in the outcome measures, with the four latent variables predominantly mapping separately onto the outcome measures.
The loss of 56.6% of our baseline sample within 1 month highlights the downstream health issues of older Table 6 Percentage of subjects showing functional decline as assessed by hospitalizations
One-month follow up N (%)a
t = [total hospitalizations]b (range)
Three months follow up N (%)
t = [total hospitalizations] (range)
No hospitalizations at either index or follow up 87 (52.1) 99 (43.4) No index, but with follow up hospitalizations 19 (12.5)
tfollow up= 38 (1–10)
64 (28.1)
tfollow up= 144 (1–20)
With index and follow up hospitalizations 14 (9.2)
tindex= 27 (1–5) tfollow up= 22 (1–4)
38 (16.7)
tindex= 72 (1–5) tfollow up= 102 (1–12) With index, but without follow up hospitalizations 32 (21.1)
tindex= 54 (1–5)
27 (11.8) tindex= 44 (1–5) Functional decline in follow up
(.1 follow up hospitalization)
16 (10.5)† 60 (26.3)‡
Notes: †One-month follow up figures calculated only from the first month after emergency department presentation; ‡3-month follow up figures calculated only from the
third month after emergency department presentation; atotal numbers reported on for hospitalizations may differ from total number in each cohort due to information not being provided by some participants; btotal hospitalizations in index are for 6-month period, total hospitalizations in follow up are for 1-month period.
Dovepress Detecting the onset of functional decline
Patient Related Outcome Measures downloaded from https://www.dovepress.com/ by 118.70.13.36 on 26-Aug-2020
community-dwelling subjects, and the difficulties of captur-ing repeated information on them. Of the individuals lost to the study, death and illness accounted for 2.9%. Ineligibility to continue in the study because of a self- reported inpatient admission related to the index ED presentation accounted for 36.4%, and 33.7% were uncontactable despite multiple attempts. There were 28.3% direct refusals to continue in the study. The subjects whom we were unable to contact, might have been in hospital at the time of the follow up call, or staying with relatives because of ongoing ill health or anxieties. Coupling uncontactable subjects with those subjects who became ineligible for the study because they had a hospital admission related to the ED presentation, or had entered permanent residential care within that month, underscores the importance of determining early measures for sensitive detection of the likelihood of FD in this cohort of community-dwelling individuals, who may not have been on the health radar at the time of recruitment in ED.
Conclusion
This research demonstrates that risk of FD can be measured within 1 month of an ED presentation for a minor health event, as decreased scores for IADLs, decreased mental and physical quality of life scores, increased falls or hospital-izations, in community-dwelling older people. Changes in one measure were not necessarily correlated with changes in another and therefore these four measures could be used independently in early screening, to identify individuals who may not be coping safely or independently in the com-munity, but who are yet to come to the attention of health care providers. This research showed that individuals who demonstrated decline at 1 month after discharge from ED
Tab
le 7
Adjusted associations (AOR [95% CI]) between mu
tab
le reflective outcome measures
MCS1 MCS3 PCS1 PCS3 IADL0 IADL1 IADL3 Falls0 Falls1 Falls3 Hosp0 Hosp1 MCS3
3.6 (1.8, 7.2)
PCS1
2.2 (1.1, 4.4)
2.7 (1.3, 5.3)
PCS3
1.9 (0.8, 3.9)
2.3 (1.5, 5.0)
Not calculable
IADL0
1.4 (0.7, 2.8)
1.2 (0.6, 2.5)
5.9 (2.6, 13.10)
7.8 (3.5, 17.8)
IADL1
2.1 (1.1, 4.3)
1.7 (0.8, 3.3)
7.7 (3.6, 16.4)
13.2 (5.6, 30.9)
13.1 (5.9, 31.4)
IADL3
1.8 (0.9, 3.6)
1.9 (0.9, 3.9)
3.9 (1.8, 9.1)
3.8 (1.8, 7.9)
12.2 (5.4, 27.5)
10.5 (4.7, 23.8)
Falls0
1.1 (0.4, 3.2)
1.3 (0.5, 3.8)
1.6 (0.5, 4.6)
1.2 (0.3, 3.5)
1.4 (0.5, 4.2)
0.8 (0.3, 2.3)
0.9 (0.3, 2.6)
Falls1
3.5 (0.9, 13.8)
2.5 (0.7, 9.1)
2.2 (0.6, 8.1)
2.1 (0.6, 7.1)
2.3 (0.7, 8.1)
1.2 (0.6, 2.3)
5.6 (1.4, 22.3)
1.7 (0.8, 8.7)
Falls3
1.8 (0.6, 4.9)
4.0 (1.3, 12.4)
1.2 (0.4, 3.2)
1.7 (0.6, 4.6)
0.7 (0.3, 2.2)
0.7 (0.3, 2.1)
1.9 (0.7, 5.2)
0.9 (0.2, 4.80)
4.5 (1.2, 17.4)
Hosp0
2.6 (1.3, 5.1)
2.7 (1.3, 5.30)
1.9 (0.9, 3.7)
2.3 (1.2, 2.6)
0.9 (0.4, 1.8)
1.1 (0.5, 2.10)
1.9 (0.8, 5.4)
0.4 (0.1, 1.3)
4.5 (1.1, 17.50)
6.5 (1.5, 21.30)
Hosp1
1.8 (0.8, 3.9)
1.1 (0.5, 2.4)
2.1 (0.9, 4.6)
2.5 (1.1, 5.40)
4.4 (1.9, 10.4)
1.8 (0.9, 3.60)
2.1 (0.9, 4.6)
1.6 (0.5, 4.9)
1.7 (0.5, 5.70)
0.8 (0.3, 2.7)
0.8 (0.4, 1.70)
Hosp3
1.6 (0.8, 3.1)
1.9 (1.0, 3.9)
1.4 (0.7, 2.8)
2.2 (1.1, 2.3)
2.4 (1.2, 4.9)
2.0 (0.9, 4.0)
2.6 (1.2, 5.2)
2.0 (0.7, 5.8)
1.6 (0.5, 5.40)
3.3 (1.2, 9.6)
1.5 (0.8, 2.9)
Not calc Notes: IADL0 (cutpoint , 15), IADL1 (cutpoint , 15), and IADL3 (cutpoint , 14) are the IADL scores at ED presentation, 1 and 3 months after ED presentation. Falls0, Falls1, and Falls3 are falls at ED presentation, 1 and 3 months after ED presentation (cutpoint . 0 for all). Hosp0, Hosp1, and Hosp3 are hospitalization presentations (ED and inpatient) at baseline, 1, and 3 months after ED presentation (cutpoint . 0 for all). MCS1 (cutpoint , 54) and MCS3 (cutpoint , 55) are the mental health domain s of the SF-12 at 1 and 3 months after ED presentation. PCS1 (cutpoint , 44), and PCS3 (cutpoint , 42) are the physical health domains of the SF-12 at 1 and 3 months after ED presentation.
Adjusted OR (95% CI) (sex and age) are reported in this
tab
le. Where adjusting was significant, this is marked by bolding. Significant associations are highlighted by italics.
Abbreviations:
Hosp, hospital; IADL, independent activities of daily living; MCS, mental component scores; PCS, physical component scores.
Table 8 Principal component analysis using change at 1 and 3 months from baseline (best weighting of items in each factor in bold)
Factor 1 Factor 2 Factor 3 Factor 4
Factor pattern
IADL-1 -0.62647 0.32368 -0.26821 0.50254 Falls-1 0.36063 -0.34424 -0.00718 0.67103
Hosps-1 0.53695 0.78546 0.12104 0.06131 IADL-3 -0.72339 0.47110 -0.01970 0.34054 Falls-3 0.31947 -0.40753 0.46260 0.49365
Hosps-3 0.69354 0.64466 0.09851 0.10895 QoL-MCS 0.32738 -0.04286 -0.63304 0.13282 QoL-PCS -0.38681 0.14712 0.65548 -0.02459
Variance explained by each factor
2.17 1.67 1.14 1.09
Notes: [variable]-1 = baseline to 1 month change; [variable]-3 = baseline to 3 months change; QoL-MCS and -PCS report change between 1 and 3 months in the mental component and physical component scores.
Abbreviations: IADL, instrumental activities of daily living; MCS, mental component scores; PCS, physical component scores; QoL, quality of life.
Dovepress Grimmer et al
Patient Related Outcome Measures downloaded from https://www.dovepress.com/ by 118.70.13.36 on 26-Aug-2020
generally continued to decline in the next 2 months, across IADLs, QoL, falls, and hospitalizations. Mental and physical decline in quality of life between 1 and 3 months after an index ED presentation was the best indicator of declining function in other measures. This paper provides informa-tion which could assist more proactive screening for older people living independently in the community, and could theoretically be applied within the first month of an indi-vidual coming to the attention of health care providers via a health crisis.
Disclosure
The authors report no conflicts of interest in this work.
References
1. Hébert R. Functional decline in old age. CMAJ. 1997;157(8): 1037–1045.
2. Rockwood K, Howlett SE, MacKnight C, et al. Prevalence, attributes, and outcomes of fitness and frailty in community-dwelling older adults: report from the Canadian Study of Health and Aging. J Gerontol A Biol Sci Med Sci. 2004;59A(12):1310–1317.
3. Fried LP, Tangen CM, Walston J, et al. Frailty in Older Adults: Evi-dence for a Phenotype. J Gerontol A Biol Sci Med Sci. 2001;56(3): M146–M146.
4. Bortz WM II. Conceptual framework for frailty: a review. J Gerontol A Biol Sci Med Sci. 2002;57A(5):M283–M288.
5. Covinsky KE, Pierluissi E, Johnston CB. Hospitalization-associated disability: “She was probably able to ambulate, but I’m not sure”.
JAMA. 2011;306(16):1782–1793.
6. Sager MA, Rudberg MA, Jalaluddin M, et al. Hospital Admission Risk Profile (HARP): identifying older patients at risk for functional decline following acute medical illness and hospitalization. J Am Geriatr Soc. 1996;44(3):251–257.
7. García-González JJ, García-Peña C, Franco-Marina F, Gutiérrez-Robledo LM. A frailty index to predict the mortality risk in a population of senior Mexican adults. BMC Geriatrics. 2009;9:47.
8. Hustey FM, Mion LC, Connor JT, Emerman CL, Campbell J, Palmer RM. A brief risk stratification tool to predict functional decline in older adults discharged from emergency departments. J Am Geriatr Soc. 2007;55(8):1269–1274.
9. Mehta KM, Yaffe K, Covinsky KE. Cognitive impairment, depressive symptoms, and functional decline in older people. J Am Geriatr Soc. 2002;50(6):1045–1050.
10. Rockwood K, Song X, MacKnight C, et al. A global clinical measure of fitness and frailty in elderly people. CMAJ. 2005;173(5):489–495. 11. Rockwood K, Mitnitski A. Limits to deficit accumulation in elderly
people. Mech Ageing Dev. 2006;127(5):494–496.
12. Edwards P, Kalache A, Hoskins I, Keller I. Health and Ageing:
A Discussion Paper. Geneva: World Health Organization; 2002. 13. Gordon C, Leigh J, Kay D, et al. Evaluation of the Consumer-Directed
Care Initiative: Final report. Canberra: Department of Health and Ageing; 2012.
14. Sands LP, Xu H, Craig BA, Eng C, Covinsky KE. Predicting change in functional status over quarterly intervals for older adults enrolled in the PACE community-based long-term care program. Aging Clin Exp Res. 2008;20(5):419–427.
15. Infante F, Proudfoot J, Powell D, et al. How people with chronic ill-nesses view their care in general practice: a qualitative study. MJA. 2004;181:70–73.
16. Wagner E. Preventing decline in function. Evidence from randomized trials around the world. West J Med. 1997;167(4):295–298.
17. Ferrucci L, Guralnik JM, Studenski S, Fried LP, Cutler GB Jr, Walston JD. Designing randomized, controlled trials aimed at prevent-ing or delayprevent-ing functional decline and disability in frail, older persons: a consensus report. J Am Geriatr Soc. 2004;52(4):625–634.
18. Ellis G, Langhorne P. Comprehensive geriatric assessment for older hospital patients. Bri Med Bull. 2004;71(1):45–59.
19. Inouye SK, Bogardus STJ, Baker DI, Leo-Summers L, Cooney LMJ. The Hospital Elder Life Program: a model of care to prevent cognitive and functional decline in older hospitalised patients. Hospital Elder Life Program. J Am Geriatr Soc. 2000;48(12):1697–1706.
20. Searle S, Mitnitski A, Gahbauer E, Gill T, Rockwood K. A stan-dard procedure for creating a frailty index. BMC Geriatrics. 2008; 8(1):24.
21. Beaton K, Grimmer K. Tools that assess functional decline: systematic literature review update. Clin Interv Aging. 2013;8:485-494.
22. Lawton MP, Brody EM. Assessment of older people: Self-maintaining and instrumental activities of daily living. Gerontologist. 1969;9(3 Pt 1): 179–186.
23. Katz S, Ford AB, Moskowitz RW, Jackson BA, Jaffe MW. Studies of illness in the aged, the index of ADL: a standardized measure of biological and psychosocial function. JAMA. 1961;185(12): 914–919.
24. Inouye S, Wagner D, Acampora D, Horwitz R, Cooney L, Hurst L, Tinetti M. A predictive index for functional decline in hospitalized elderly medical patients. J Gen Intern Med. 1993;8(12):645–652. 25. McCusker J, Bellavance F, Cardin S, Trépanier S, Verdon J, Ardman O.
Detection of older people at increased risk of adverse health outcomes after an emergency visit: the ISAR screening tool. J Am Geriatr Soc. 1999;47(10):1229–1237.
26. Cornette P, Swine C, Malhomme B, Gillet J-B, Meert P, D’Hoore W. Early evaluation of the risk of functional decline following hospitaliza-tion of older patients: development of a predictive tool. Eur J Public Health. 2006;16(2):203–208.
27. Boyd M, Koziol-McLain J, Yates K, et al. Emergency department case-finding for high-risk older adults: The Brief Risk Identification for Geriatric Health Tool (BRIGHT). Acad Emerg Med. 2008;15(7): 598–606.
28. Hirdes JP, Ljunggren G, Morris JN, et al. Reliability of the interRAI suite of assessment instruments: a 12-country study of an integrated health information system. BMC Health Serv Res. 2008;8(1):277–277. 29. Bernabeu-Wittel M, Ollero-Baturone M, Ruiz-Cantero A, et al.
Functional decline over 1-year follow up in a multicenter cohort of polypathological patients: A new approach to functional prognostication.
International Journal of Gerontology. 2012;6(2):68–74.
30. Grimmer-Somers K, Beaton K, Young L, et al. Estimating risk of func-tional decline occurring after discharge in elderly people presenting to one large Australian public tertiary hospital Emergency Department.
Australian Health Review. 2013; 37(3):341–347.
31. von Elm E, Altman DG, Egger M, Pocock SJ, Gøtzsche PC, Vandenbroucke JP; STROBE Initiative. The Strengthening the Report-ing of Observational Studies in Epidemiology (STROBE) statement: guidelines for reporting observational studies. J Clin Epidemiol. 2008;61(4):344–349.
32. Russell MA, Hill KD, Day LM, Blackberry I, Gurrin LC, Dharmage SC. Development of the Falls Risk for Older People in the Community (FROP-Com) screening tool. Age Ageing. 2009;38(1): 40–46.
33. Folstein MF, Flostein SE, McHugh PR. Mini-mental state: A practical method for grading the cognitive state of patients for the clinician.
J Psychiatr Res. 1975;12(3):189–198.
34. Russell MA, Hill KD, Blackberry I, Day LM, Dharmage SC. The reli-ability and predictive accuracy of the falls risk for older people in the community assessment (FROP-Com) tool. Age Ageing. 2008;37(6): 634–639.
35. LaPlante MP. The classic measure of disability in activities of daily living is biased by age but an expanded IADL/ADL measure is not.
J Gerontol B Psychol Sci Soc Sci. 2010;65(6):720–720.
Dovepress Detecting the onset of functional decline
Patient Related Outcome Measures downloaded from https://www.dovepress.com/ by 118.70.13.36 on 26-Aug-2020
Patient Related Outcome Measures
Publish your work in this journal
Submit your manuscript here: http://www.dovepress.com/patient-related-outcome-measures-journal Patient Related Outcome Measures is an international, peer-reviewed, open access journal focusing on treatment outcomes specifically relevant to patients. All aspects of patient care are addressed within the journal and practitioners from all disciplines are invited to submit their work as well as healthcare researchers and patient support groups.
The manuscript management system is completely online and includes a very quick and fair peer-review system. Visit http://www.dovepress. com/testimonials.php to read real quotes from published authors. 36. Ware JE, Kosinski M, Keller S. A 12-Item Short-Form Health Survey:
construction of scales and preliminary tests of reliability and validity.
Med Care. 1996;34:220–233.
37. Gandek B, Ware JE, Aaronson NK, et al. Cross-validation of item selection and scoring for the SF-12 health survey in nine countries: results from the IQOLA Project. J Clin Epidemiol. 1998;51(11): 1171–1178.
38. Avery J, Dal Grande E, Taylor A. Quality of life in South Australian as Measured by the SF-12 Health Status Questionnaire: Population Norms for 2003, Trends from 1997–2003. Department of Human Services. South Australia, Population Research and Outcomes Studies, Strategic Planning and Research Branch; 2004:1–112.
Dovepress
Dovepress
Grimmer et al
Patient Related Outcome Measures downloaded from https://www.dovepress.com/ by 118.70.13.36 on 26-Aug-2020