IJEDR1804054
International Journal of Engineering Development and Research (www.ijedr.org)
284
Data Visualization and Improving Accuracy of
Attrition Using Stacked Classifier
1
Deep Sanghavi,
2Jay Parekh,
3Shaunak Sompura,
4Pratik Kanani
1-3Students, 4Assistant Professor1Information Technology Engineering,
1Dwarkadas J. Sanghvi College of Engineering, Mumbai, India
_____________________________________________________________________________________________________ Abstract—In any organization, managing Human Resources is an important task. Loss of employees lowers the overall
productivity of the team and is also financially costly. Attrition of employees leaves behind a void that is costly to fill [2]. Machine Learning can be utilized for predicting an employee’s attrition. This paper evaluates the algorithms which can be used to predict the employee attrition on the IBM HR Analytics Employee Attrition & Performance dataset [1] taken from Kaggle with 35 attributes like Job Satisfaction, Percentage Salary Hike, Work Life Balance, etc. taking into consideration all aspects right from distance from home to the number of working hours. In order to predict Attrition, which is the dependent variable, classification algorithms under supervised learning are used. This paper provides the most optimal solution with the Stacked Classifier, an ensemble model which in this case averages Adaptive Boosting, Decision Tree Classifier and Support Vector Machine algorithms ultimately giving a high accuracy of 90.65.
IndexTerms—Employee Attrition Prediction, Classification Algorithms, Model Stacking.
_____________________________________________________________________________________________________
I.INTRODUCTION
When there is a loss of employees in any organization, there are a lot of problems which are caused, starting from an empty position in the organization. Filling these positions is a lengthy process of interviewing candidates, training them and and integrating them into teams [3]. This makes retention of valuable talent essential to the smooth functioning of the organization. HR is constantly looking out for ways to predict which employee is unhappy with the current job in order to try and convince the employee to stay or to cushion the blow of loss of talent by looking for replacements. Accurate employee attrition prediction has tremendous monetary and productivity benefits for the organization and so machine learning is used to train classifier models using the dataset.
The dataset is called IBM HR Analytics Employee Attrition & Performance, taken from Kaggle. The dataset consists of 35 variables such as Age, Daily Rate, Hourly Rate, Job Satisfaction, Overtime and Monthly Income being some of the important factors that contribute to attrition. The target variable is Attrition which has two values - Yes and No. Supervised learning [4] is a process of training the model to map the function between labelled input variables and target output variable. The target in this dataset is a binary variable and so classification is used to solve this problem. Classification [5] is a supervised learning technique which uses a model to predict categorical values from the input data. Stacked Classifier [6] combines multiple classifying algorithms which are trained on the training set and is used with a meta classifier which predicts the output class using the output values from the Stack Classifier. The data is used to train an ensemble [7] Stacked Classifier consisting of three classifying algorithms: Support Vector Machine, Decision Tree Classifier and Adaptive Boosting with the meta classifier algorithm used being Logistic Regression for obtaining better accuracy.
In this paper, the dataset goes through cleaning, preprocessing, feature engineering, training and modelling to obtain an accuracy of 90.65% using Stacked Classifier.
II.METHODOLOGY
2.1 Pre-Processing
© IJEDR 2018 | Volume 6, Issue 4 | ISSN: 2321-9939
IJEDR1804054
International Journal of Engineering Development and Research (www.ijedr.org)
285
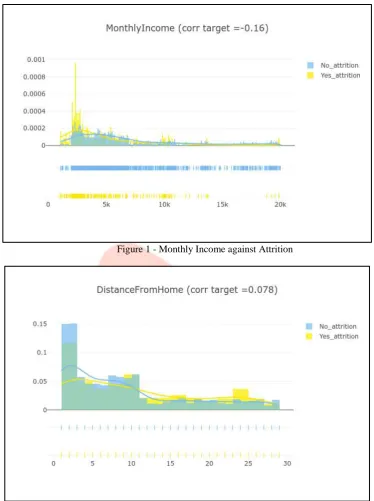
2.1.1 VisualizationFigure 1 - Monthly Income against Attrition
IJEDR1804054
International Journal of Engineering Development and Research (www.ijedr.org)
286
Figure 3 - Hourly Rate against Attrition© IJEDR 2018 | Volume 6, Issue 4 | ISSN: 2321-9939
IJEDR1804054
International Journal of Engineering Development and Research (www.ijedr.org)
287
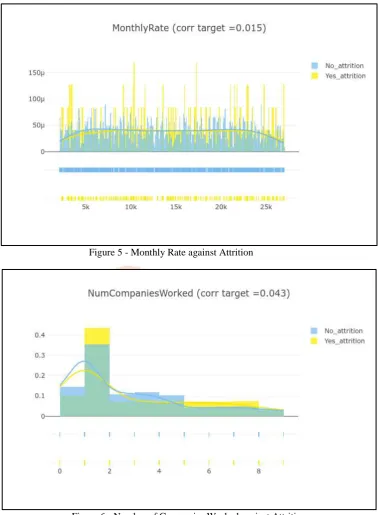
Figure 5 - Monthly Rate against AttritionIJEDR1804054
International Journal of Engineering Development and Research (www.ijedr.org)
288
Figure 7 -Percent Salary Hike against Attrition© IJEDR 2018 | Volume 6, Issue 4 | ISSN: 2321-9939
IJEDR1804054
International Journal of Engineering Development and Research (www.ijedr.org)
289
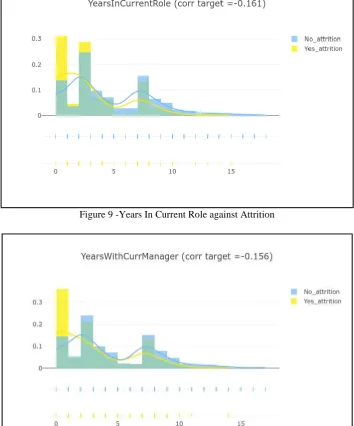
Figure 9 -Years In Current Role against AttritionFigure 10 - Years with Current Manager against Attrition
2.1.2 Feature Engineering
After analyzing the data by making a scatter plot graph of all the variables against each other, a lot of observations can be made. Firstly, there are no missing values in the dataset, hence no empty values have to be filled.
Secondly, the attributes - “Over18”, “EmployeeNumber” and “StandardHours” are dropped from the dataset as “Over18” has all values set to “Y” and the other two attributes do not affect attrition as observed in the scatter plot.
Next, there a few attributes such as “BusinessTravel”, “Department”, “JobRole”, etc. which have categorical and string values. Binary numeric data of the same is required, in order to achieve this, one-hot encoding is implemented. In one-hot encoding, values are assigned 1 to that column if that value is present else value 0. The final dataset consists of 52 variables.
2.2 Algorithms Used
2.2.1 Adaptive Boosting
The Adaptive Boosting (AdaBoost) algorithm works on the core principle of fitting a sequence of weak learners [8]. This algorithm uses a particular boost classifier as shown in Eq. 1.
𝐹𝑇(𝑥) = ∑𝑇𝑡 = 1𝑓𝑡(𝑥) Eq. (1)
ftrepresents a weak learner which takes an object x input and accordingly returns a value which indicates the class of that object.
IJEDR1804054
International Journal of Engineering Development and Research (www.ijedr.org)
290
The sum training error Et is given as Eq. 2 and it is minimized as each weak learner produces ℎ(𝑥𝑖)the outputhypothesis. For each iteration t, the 𝛼coefficient is assigned. 𝐹𝑡−1is the boosted classifier. Eq. 1 and 2 are used for training. The
weights 𝑤1, 𝑤2, . . . 𝑤𝑁are applied to each of the training samples, this is known as boosting iteration. Initially all the weights
are assigned by Eq. 3.
𝑤𝑖=1 / 𝑁 Eq. (3)
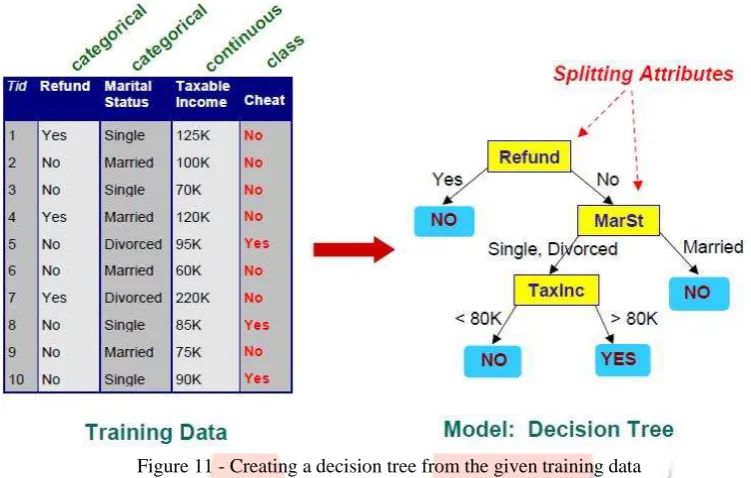
2.2.2 Decision Tree Classifier
Decision Tree is one of the simplest algorithms out there. Here multiple inputs (in this case data features) are asked multiple questions and accordingly achieve a certain output. Based on the output, the inputs are classified by using the Decision Tree Classifier algorithm. These simple decision rules aid in predicting the target value [9].
Figure 11 - Creating a decision tree from the given training data
In Fig. 11 it can be observed that the training data is used to generate the decision tree. The decision tree then asks multiple questions to the data and achieves the output “Yes” or “No”.
2.2.3 Support Vector Machine
© IJEDR 2018 | Volume 6, Issue 4 | ISSN: 2321-9939
IJEDR1804054
International Journal of Engineering Development and Research (www.ijedr.org)
291
Figure 12 - Support Vectors with a Hyper PlaneIn Fig. 12 the plotted points are the data and are segregated into green points and red points by using the hyperplane. The line that has the shortest distance to the points closest to it is picked. The closest points that identify this line are known as support vectors. And the region they define around the line is known as the margin. This algorithm is effective in high dimensional spaces and provides versatility.
2.2.4 Stacked Classifier
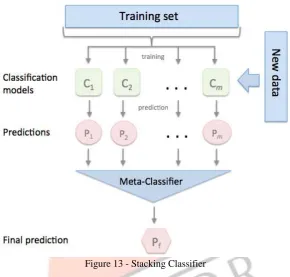
With the help of a meta-classifier, the stacking classifier combines multiple classification models [6]. The meta-classifier is fitted based on the meta-features (output) of the individual classification models that are being input to the stacking classifier as observed in Fig. 13.
Figure 13 - Stacking Classifier
The three algorithms that are stacked into the stacking classifier are Adaptive Boosting (Adaboost), Decision Tree Classifier (DTC) and Support Vector Machine (SVM). The stacking classifier is used as it allows us to combine various algorithms and provide more versatility. Each algorithm used in the stacking classifier improves the overall accuracy in a way as each algorithm provides different data training sets.
III.EXPERIMENT
The dataset obtained consists of 35 attributes. 32 of those attributes contribute to deciding employee attrition. The target is to predict attrition of employees which can have any one of the outcomes, either Yes or No. Classification algorithms are applied to predict the outcome of this problem. The dataset is divided into two parts for training and testing purposes. 80% of the data points are used for training the model, that is the model learns the outcome with respect to changes in the independent variables. The remaining 20% forms the test data. The test dataset is used to evaluate the accuracy of the model. The target value in the test set is compared with the predicted value to determine classification performance.
IV.IMPLEMENTATION
IJEDR1804054
International Journal of Engineering Development and Research (www.ijedr.org)
292
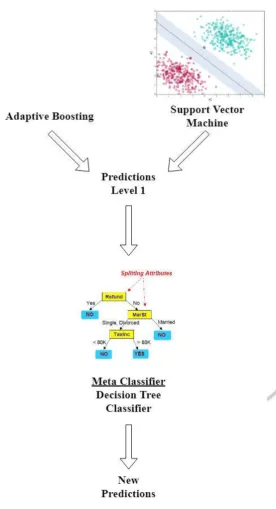
Figure 14 - Stacked Classifier Model DesignV.RESULTS
The predictions consider the three algorithms to find out the model with the best accuracy. Table 1: Results of trained models on testing data
Algorithm Score Accuracy
Adaptive Boosting 88.93
Decision Tree Classifier 82.78
Support Vector Machine 84.01
© IJEDR 2018 | Volume 6, Issue 4 | ISSN: 2321-9939
IJEDR1804054
International Journal of Engineering Development and Research (www.ijedr.org)
293
VI.CONCLUSION
After performing various empirical tests on the IBM HR Analytics Employee Attrition & Performance [1] dataset from Kaggle with 35 features for employee attrition prediction in an organization, the results from the table in the above section depict that the Stacked Classifier provides the most optimal solution with a score accuracy of 90.65. Hence, it can be stated that multiple trained models learned on different classification algorithms can be cross validated, averaged and passed into a meta classifier to improve the accuracies of the individual classification models. An employee’s attrition value prediction could benefit the organization by knowing where they are going wrong and with which employees. The organization could accordingly start looking for people to fill the positions which are predicted to be empty by using this stacked classifier model.
VII.FUTURE SCOPE
Currently, the dataset size is 1470 rows. If this size is increased, the accuracy can be further improved by the stacked classifier. The logic here is that if there is more data, it will enable training more exhaustively and one could also implement deep learning algorithms. Furthermore, feature engineering will not be required as principal component analysis could work on the 35 features of the dataset and use the important ones which contribute to the attrition value.
REFERENCES
[1] IBM HR Analytics Employee Attrition & Performance (2018, 28, August) Kaggle Inc. [Online] Available: https://www.kaggle.com/pavansubhasht/ibm-hr-analytics-attrition-dataset/
[2] Watson Analytics Use Case For HR: Retaining valuable employees (2018, 28, August) IBM. [Online] Available: https://www.ibm.com/communities/analytics/watson-analytics-blog/watson-analytics-use-case-for-hr-retaining-valuable-employees/
[3] Importance of Employee Retention (2018, 3, September) Officevibe. [Online] Available: https://www.officevibe.com/blog/importance-employee-retention
[4] Supervised and Unsupervised Machine Learning Algorithms (2018, 4, September) Machine Learning Mastery. [Online] Available:
https://machinelearningmastery.com/supervised-and-unsupervised-machine-learning-algorithms/
[5] 7 Types of Classification Algorithms (2018, 6, September) Analytics India Magazine [Online] Available: https://www.analyticsindiamag.com/7-types-classification-algorithms/
[6] Stacking Classifier (2018, 10, September) Github [Online] Available: https://rasbt.github.io/mlxtend/user_guide/classifier/StackingClassifier/
[7] Ensemble Learning to Improve Machine Learning Results (2018, 12, September) Stats and Bots [Online] Available: https://blog.statsbot.co/ensemble-learning-d1dcd548e936
[8] Ensemble methods - Adaptive Boosting (2018, 14, September) Scikit Learn [Online] Available: http://scikit-learn.org/stable/modules/ensemble.html#adaboost
[9] Decision Trees (2018, 15, September) Scikit Learn [Online] Available: http://scikit-learn.org/stable/modules/tree.html#tree
[10]Understanding Support Vector Machines (2018, 16, September) Analytics Vidhya [Online] Available: https://www.analyticsvidhya.com/blog/2017/09/understanding-support-vector-machine-example-code/
[11]Dhvani Kansara, Rashika Singh, Deep Sanghavi, Pratik Kanani, "Improving Accuracy Of Real Estate Valuation Using Stacked Regression", International Journal of Engineering Development and Research (IJEDR), ISSN:2321-9939, Volume.6, Issue 3, pp.571-577, September 2018, Available at:
http://www.ijedr.org/papers/IJEDR1803097.pdf
[12]Zhang Y. (2012) Support Vector Machine Classification Algorithm and Its Application. In: Liu C., Wang L., Yang A. (eds) Information Computing and Applications. ICICA 2012. Communications in Computer and Information Science, vol 308. Springer, Berlin, Heidelberg