Jianyong Cai1,2,3, Lili Luo1, Rongtai Cai1,3, Lijin Lin1, Juan Cai1
1College of Photonic and Electronic Engineering, Fujian Normal University, Fuzhou, China; 2Key Laboratory of Optoelectronic
Science and Technology for Medicine Ministry of Education, Fujian Normal University, Fuzhou, China; 3Intelligent Optoelectronic Systems Research Centre, Fujian Normal University, Fuzhou, China.
Email: [email protected]
Received September 11th, 2013; revised October 8th, 2013; accepted October 15th, 2013
Copyright © 2013 Jianyong Cai etal. This is an open access article distributed under the Creative Commons Attribution License,
which permits unrestricted use, distribution, and reproduction in any medium, provided the original work is properly cited.
ABSTRACT
This paper proposed a new algorithm to separate leukocytes from cytological image by setting parameters of lightness transformation based on the RGB color space, which can make the targets’ color in different areas. In our procedure, an operator is employed in using color features. According to their histogram distribution of hue component in HSL color space after enhancing the contrast of image in RGB color space, the threshold of segmentation between leukocyte and erythrocyte could be achieved well. Especially, this algorithm is more efficient than monochrome for leukocyte seg- mentation, and the results of experiments show that it provides a good tool for cytological image, which can increase accuracy of segmentation of leukocyte.
Keywords: Parameters; Lightness Transformation; Color Features; HSL; Threshold; Leukocyte Segmentation
1. Introduction
The detection of leukocytes is an important part of the test about blood, which has a great value to the diagnosis of various blood diseases. The traditional detection method about leukocytes, which usually requires human partici- pation, will definitely cause personal error, so the auto- matical identification research of cytological image is of great significance.
There have been considerable related researches in this area of image segmentation with many algorithms pre- sented [1-5], such as the gray threshold method, the ac- tive contour models and some algorithms. The gray thresh- old method only considers the gray information and ig- nores the spatial information of image. The active con- tour model represents an object boundary or some other salient images feature as a parametric curve [6]. Some algorithms apply watershed algorithms to the segmenta- tion [7] and other algorithms use morphology and texture toward leukocyte recognition [8,9]. As the research fur- ther develops, color image segmentation attracts more
and more attention. Some color and mathematical mor- phology methods are applied in segmentation of cyto- logical images [10,11]. Some algorithms are based on the saturation and green components’ distribution [12]. Ber- gen posts a simultaneous and cooperative way combining pixel-wise classification with template matching to locate leukocyte [13].
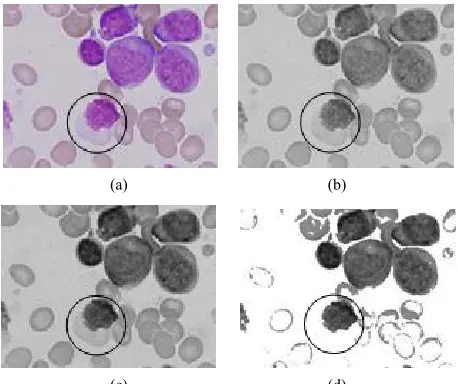
In those segmentation works, the authors have em- ployed preprocessing methods to the image before using the algorithms mentioned above. In a typical preprocess- ing method, some gray values as a threshold are selected to separate leukocytes from background of a cytological image. The gray threshold preprocessing method can achieve indeed a good result in a single leukocyte. How- ever, as an example shown in Figure 1, it indicates that gray threshold method is not good for an image with multiple leukocytes. Some methods used green channel image instead of gray image. The results can be improv- ed, but it is still difficult to separate leukocytes in some images. For instance, a leukocyte cell marked by a circle in Figures 1(a)-(c) is composed of nucleus and cytoplasm. After separating leukocytes from the background by set- ting the gray threshold value of 145, the cytoplasm in- formation is lost as shown in Figure 1(d).
*This work was fully supported by the Major Projects of Science and
(a) (b)
[image:2.595.58.287.83.275.2]
(c) (d)
Figure 1. Loss of cytoplasm image by gray threshold: (a) True color image; (b) Gray image; (c) G channel image; (d) Gray level filter image.
Obviously, it is simple to use the gray image to iden- tify leukocyte, however, its accuracy is low because the information that gray image stores is less than that of a true color image.
So far, for many segmentation methods proposed, we also need to use the characteristics of image itself to find out suitable segmentation algorithm. An algorithm for leukocyte segmentation is put forward in this paper, which can put the hue between erythrocyte and leukocyte into different areas after lightness transformation of the com- ponents of RGB, and the hue threshold of separating leu- kocyte can be easily obtained.
2. Principle and Methods
[image:2.595.325.518.84.466.2]Generally, the cytological images are usually made of erythrocyte, leukocyte and background stored in RGB format, what is widely used in color image processing, but it is not quite suited to describe perceptual colors. And the best description with color of cytological images is hue in HSL color space. It is more accurate than RGB color space to describe the perceptual color relationships [14,15].
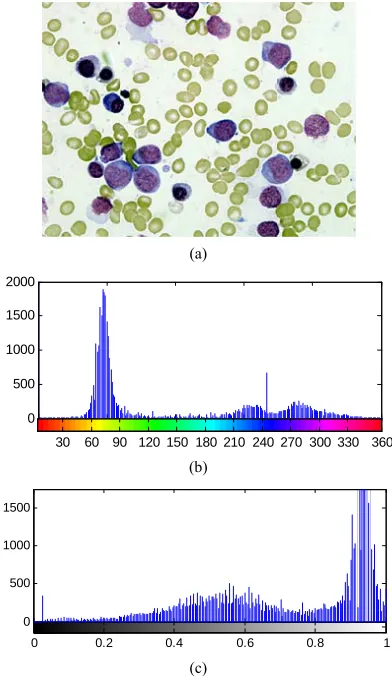
HSL color space presents a set of helpful features ap- parently, but when the cytological image is transferred from RGB to HSL directly, it is still very hard to separate leukocytes from an image with erythrocytes and back- ground. As shown in the Figure 2, the distribution of histogram of hue component does not show a clear clue how to identify leukocyte, erythrocyte and the back- ground, which has a lot of overlap between erythrocyte and leukocyte.
Therefore, a novel preprocessing method for the seg- mentation of leukocyte image is presented by utilizing
(a)
0 500 1000 1500 2000 2500
30 60 90 120 150 180 210 240 270 300 330 360
(b)
0 0.2 0.4 0.6 0.8 1
0 500 1000 1500 2000
(c)
Figure 2. H, L histogram of a primal image: (a) Primal im-age; (b) Hue component; (c) Lightness component.
lightness transformation of the RGB components. As- suming that the gray value range of a primary image
,f x y is [s1, s2] and the gray value range of a proc-
essed image f
x y, is [t1, t2]. The function between f(x, y) and f
x y, shown in Figure 3 can be expressed by (1).
1 2
1 1 2
, t t , 1
f x y f x y s t
s s
(1)
Firstly, we normalize RGB color space to interval [0,1], the procedure of normalization can be formulated by V L0 , where 0 is the original gray value of RGB
color space and L is total classes of gray value. Then we adjust intensity of R, G and B channel respectively to increase the contrast of color feature of hue component by (1). This procedure of preprocessing is named as CCIN (Color Channel Intensity Normalization) method. An operator T was employed in our procedure of in- creasing contrast in RGB vector color space:
t
1s
1s
2 [image:3.595.78.272.84.209.2]0 f (x, y)
Figure 3. The relationship between original and processed images in the linear transformation.
3
1
, ,
rgb i i i
i
f f x y f f x y r
,
, 3,
0rgb
f x y ,1 ,
1
2 1
1
, ,
i i i
i i i
f f x y f x y s
s s
(2)
Where i
1, 2,3
. Let frgb
x y,
be a vector func-tion in RGB color vector space, it shows the values of red, green and blue at the corresponding point
x y, of the image, and f1
x y, , f2
x y, , f3
x y,
are thevalues of red, green, blue channel respectively. The vec- tors r1, r2, r3 are unit vectors of components of RGB.
Then assuming that the gray value range of a primary cytological image is [n, m], the pixels’ grey values of components of RGB are arranged respectively from small to large to get 1 × P vector Vi. The parameters i, i
can be defined by
1,
,
1, Pi Vi Num i Vi Num
(3)
where P is the number of the total pixels of image, and Num is the number of 1% of P. As above shown, the op- erator T maps RGB color vector space into itself:
,
,
, 3rgb rgb rgb
f x y T f x y ,f x y (4)
Secondly we transfer the vector function frgb
x y, to HSL color space, which is from Equation (4).As shown in the Figure 4, observing the H and L his- tograms of frgb
x y,
in HSL color space, it’s so easy to figure out the areas of erythrocyte and leukocyte that can be wonderfully segmented by threshold value of the H component. And by comparing the histograms of hue with lightness, we could confirm that those discretely distributing bars are the points whose lightness value L ≥0.9. Apparently, the points show the characterization of the background pixels.
Figure 4(b) shows two areas: erythrocyte area with H between 0 and 150, and leukocyte area with H between 180 and 360. Indeed we can set a hue threshold (from 150 to 180) to separate leukocyte and erythrocyte in an
(a)
0 500 1000 1500 2000
30 60 90 120 150 180 210 240 270 300 330 360
(b)
0 0.2 0.4 0.6 0.8 1
0 500 1000 1500
[image:3.595.324.520.85.423.2](c)
Figure 4. H, L histogram of a normalized image: (a) Nor- malized image; (b) Hue component after discarding the background pixels; (c) Lightness component.
image processed by CCIN method, choosing the binary leukocyte image as a mask, actually it could be called as Hue threshold. It means that we combine the true color image with the mask based on the OR operator. Finally, the leukocytes could totally be separated from the primal image.
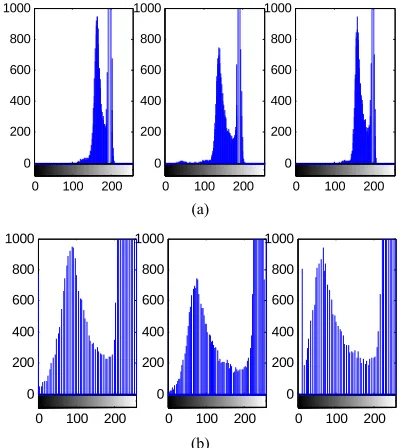
However the CCIN is not effective for all cytological images with different features. As shown in Figure 5(a), It is a cytological image that contains leukocytes with less pixels, and Figure 5(b) is shown a linear map of grey value of R, G and B each channels between the original image and the normalized image, which the slopes of components of RGB are decided by parameters i,
i
. Through the linear transformation of R, G and B each components, the grey value of primal image can be mapped to the normalized image. Then there is a nor- malized image after the linear transformation in Figure 5(c).
(a)
(b)
[image:4.595.74.274.84.498.2](c)
Figure 5. Contrast between a primal image and the image by CCIN: (a) A primal image; (b) A linear map; (c) The image by CCIN.
0 500 1000
[image:4.595.323.523.453.677.2]30 60 90 120 150 180 210 240 270 300 330 360
Figure 6. Hue histogram without points whose L ≥ 0.9.
badly. So no matter how to choose threshold, the leuko- cytes of blood cytological image can be not better seg- mented.
Why can not this kind of cytological images obtain a good result of hue after using the CCIN directly? By ob-
serving the histograms of components of RGB of primal image are shown in Figure 7(a), it shows two peaks in the histograms of components of R and B, the histogram of G channel presents three peaks; And Figure 7(b) is shown the histograms of components of RGB of normal- ized image, the histograms of components of R and B still have two peaks, but the histogram of G channel ap- pears two peaks, which is not same the primal image’s. Because of the parameters i, i gained by CCIN, the
grey value of 1% from low to high of the total pixels of G channel will be used as the minimum of tensile range. However the number of leucocytes’ pixels of this kind of cytological image is often less than 1% of the total pixels, it will be inevitably generated that the grey values of leucocytes’ area of G channel set to 0. Then the hues of leucocytes’ and erythrocytes’ from a normalized image have more overlap certainly, and the span of erythro- cytes’ hue is very large, it is adverse to segmentation of leucocyte of blood cytological image.
Under the circumstances, which the number of leuco- cytes’ pixels of cytological image is far less than the number of erythrocytes’, the parameters 2, 2 of G
channel should be adjusted by
2 min I2 x, y 0.1
(5)
2 max I2 x, y 0.15
(6)
where 0.1 and 0.15 are corrected value of many expe- riments, which is in order to ensure that most of leuco- cytes’ area of G channel of image by CCIN can be re-
0 100 200 0
200 400 600 800 1000
0 100 200 0
200 400 600 800 1000
0 100 200 0
200 400 600 800 1000
(a)
0 100 200 0
200 400 600 800 1000
0 100 200 0
200 400 600 800 1000
0 100 200 0
200 400 600 800 1000
(b)
[image:4.595.72.271.552.648.2]and erythrocytes’ can be separated easily at this time, then by taking threshold value 180 of segmentation be- tween leucocytes and erythrocyte, and we can achieve a better image of leucocytes from cytological image.
3. Result and Analysis
The images used in our experiment were acquired from blood smears stained with Wright's stain. And in order to meet the computing power of MATLAB program, the resolution ratio of images is adjusted to 241 × 320 pixels in the first step of the preprocessing, which still hold im- ages in true color format.
Figure 9 shows the leukocytes of blood cytological image from Figure 4(a), which is acquired by CCIN directly and the effect is okay.
Similarly, Figure 10 is the leukocytes of blood cyto- logical image from Figure 5(a), gained by CCIN directly, and the effect of its segmentation is so bad.
However, in that case, using the adjusted CCIN, which is proposed by this paper, we can get a good result of leukocytes’ segmentation, as shown in the Figure 11.
A series of experiments are performed to test the effi- ciency of our method, against a lot of cytological image by Wright Stain. Separating leukocytes were performed
(a)
0 100 200 300 400 500
30 60 90 120 150 180 210 240 270 300 330 360
(b)
Figure 8. Images about processing of primal image: (a) Im-age by the adjusted CCIN; (b) Hue histogram without points whose L ≥ 0.9.
(a) (b)
Figure 9. The image of leukocytes’ segmentation: (a) The mask image; (b) Leukocyte image by hue threshold.
(a) (b)
Figure 10. The image of leukocytes’ segmentation: (a) The mask image; (b) Leukocyte image by hue threshold.
(a) (b)
Figure 11. The image of leukocytes’ segmentation: (a) The binary image; (b) Leukocyte image by hue threshold.
using different threshold and the results are shown in
Figure 12. Figure 12(a) is the primal cytological image,
Figure 12(b) represents the image processed by CCIN method, and Figure 12(c) is the result processed with the mask, Figure 12(d) shows the result obtained by thresh- old method with Green channel.
Comparing Figure 12(c) with Figure 12(d), we find that the leukocytes are successfully separated using our method, while retaining the essential information of nu- cleus and cytoplasm retained much more. The cytoplasm marked by circle, which was missed in the process of gray threshold, is retained completely. It is also easy to find that the remnants of erythrocytes are still visible in
Figure 12(d), but the leukocytes are clearly separated from the primal image without any visible remnants of erythrocytes in Figure 12(c).
(a) (b)
[image:6.595.57.286.83.272.2]
(c) (d)
Figure 12. The method of separating leukocyte with mask almost perfectly stayed all the leukocyte images: (a) Primal color image; (b) Image processed by CCIN; (c) Separated by hue threshold; (d) Separated by gray threshold.
[image:6.595.311.535.84.266.2]includes many leukocytes and erythrocytes or fewer leu- kocytes and more erythrocytes, cytoplasm cannot be separated because the gray values of nucleus, cytoplasm and erythrocyte overlap seriously in histogram.
Figure 13 shows the result of Leukocytes Segmenta- tion from an image of many leukocytes and erythrocytes by random sampling in the experiment of cytological image using CCIN, which is non-good blood smear. And the effect of segmentation is vivid.
And as shown in the Figure 14, the effect of Leuko- cytes Segmentation from a cytological image of fewer leukocytes is remarkable by using the adjusted CCIN.
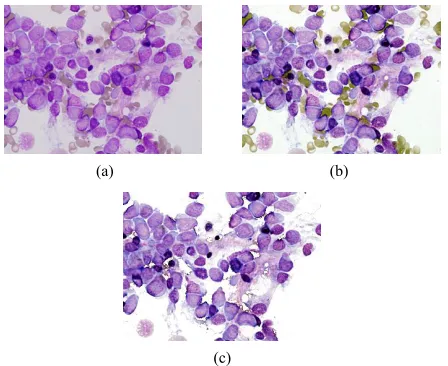
In fact, more complicated situations should be re- solved in cytological image, such as non-good blood smear, and defective blood smear. In our work, we also tried to deal with these complicated situations. Utilizing our method into these situations, we obtained quite good results as shown in Figure 15.
4. Conclusion
The leukocytes segmentation of cytological images is a very important and difficult link in the automatic analysis of computer. Generally, traditional segmentation method of cytological image could lose a lot of important infor- mation, which is based on monochrome image. In this paper, we proposed an image preprocessing method com- bining RGB and HSL color spaces to separate leukocyte from cytological images. After using CCIN or the ad- justed CCIN method to process the primal images, the characteristics of histogram of leukocyte and erythrocyte are presented on hue component in HSL color space obvi- ously, which can be used to segmentation of cytological image. The results of many experiments show that our
(a) (b)
(c)
Figure 13. Image of many leukocytes and erythrocytes: (a) Primal image of non-good blood smear; (b) Image by CCIN; (c) Leukocyte image by hue threshold.
(a) (b)
[image:6.595.312.535.312.479.2](c)
Figure 14. Image of fewer leukocytes: (a) Primal image; (b) Image by the adjusted CCIN; (c) Leukocyte image by hue threshold.
(a) (b)
(c)
[image:6.595.312.536.527.710.2]REFERENCES
[1] B. C. Ko, J.-W. Gim and J.-Y. Nam, “Automatic White Blood Cell Segmentation Using Stepwise Merging Rules and Gradient Vector Flow Snake,” Micron, Vol. 42, No. 7, 2011, pp. 695-705.
http://dx.doi.org/10.1016/j.micron.2011.03.009
[2] D.-C. Huang and K.-D. Hung, “A Computer Assisted Method for Leukocyte Nucleus Segmentation and Recog- nition in Blood Smear Images,” Journal ofSystemsand Software, Vol. 85, No. 9, 2012, pp. 2104-2118.
http://dx.doi.org/10.1016/j.jss.2012.04.012
[3] C. Reta, etal., “Leukocytes Segmentation Using Markov
Random Fields,” SoftwareToolsandAlgorithmsforBio- logicalSystems, Springer, New York, 2011, pp. 345-353.
[4] M. Kass, A. Witkin and D. Terzopoulos, “Snakes: Active Contour Models,” International Journal of Computer Vi- sion, Vol. 1, No. 4, 1988, pp. 321-331.
http://dx.doi.org/10.1007/BF00133570
[5] N. Malpica, Ortiz de Solorzano, etal., “Applying Water-
shed Algorithms to the Segmentation of Clustered Nu- clei,”Cytometry, Vol. 28, No. 4, 1997, pp. 289-297.
[6] P. Chen, et al., “Leukocyte Image Segmentation Using
Simulated Visual Attention,” Expert Systems with Appli- cations, Vol. 39, No. 8, 2012, pp. 7479-7494.
http://dx.doi.org/10.1016/j.eswa.2012.01.114
[7] N. Theera-Umpon, E. R. Dougherty and P. D. Gader, “Non-Homothetic Granulometric Mixing Theory with
April 2004, pp. 121-124.
[9] D. M. U. Sabino, etal., “A Texture Approach to Leuko-
cyte Recognition,” Real-Time Imaging, Vol. 10, No. 4,
2004, pp. 205-216.
http://dx.doi.org/10.1016/j.rti.2004.02.007
[10] L. Olivier, et al., “Segmentation of Cytological Images
Using Color and Mathematical Morphology,” Acta Ste- reologica, Vol. 18, 1999, pp. 1-14.
[11] H. Ramoser, etal., “Leukocyte Segmentation and Classi-
fication in Blood-Smear Images,” 27thAnnual Interna- tionalConferenceofthe EngineeringinMedicineandBi- ologySociety, IEEE-EMBS, Shanghai, 17-18 January 2006,
pp. 3371-3374.
[12] G. U. Guanghua and C. U. I. Dong, “Automatic Segmen- tation Algorithm for Leukocyte Images,” ChineseJournal ofScienceInstrument, Vol. 9, 2009, pp. 1874-1879.
[13] T. Bergen, etal., “Segmentation of Leukocytes and Ery-
throcytes in Blood Smear Images,” 30thAnnualInterna- tionalConference ofthe IEEE EngineeringinMedicine andBiologySociety, Vancouver, 20-25 August 2008, pp.
3075-3078.
[14] G. Ercan and P. Whyte, “Digital Image Processing,” U.S. Patent No. 6240217, 2001.
[15] M. Saraswat, K. V. Arya and H. Sharma, “Leukocyte Segmentation in Tissue Images Using Differential Evolu- tion Algorithm,” Swarm andEvolutionary Computation,