884 | 2018 | ISSUE 4 | VOLUME 13 © 2018 University of Alicante
Coupling angle variability of upper extremity
during 5 weeks overarm throwing self-practice
GIZEM OZKAYA1, JUNGHO LEE2, SEJIN KONG3, KI-KWANG LEE1
1Department of Physical Education, Kookmin University, Seoul, Republic of Korea 2K2 Korea Group, Seoul, Republic of Korea
3LS Networks Co. Ltd., Seoul, Republic of Korea
ABSTRACT
The role of variability is still unknown for biomechanists whether it's useful or not for the performance or skill learning. The aim of this study was to investigate coupling angle variability (CAV) at the early phase of skill acquisition of overarm throwing without any feedback about the result or performance. 7 healthy female without any throwing experience participated in this study. Each participant participated a total of 15 sessions in the laboratory (3 days in a week x 5 weeks). Coupling angle variability of angle-angle diagrams (AAD) calculated for combinations of trunk flexion (TF) –lateral flexion(TL), humeral elevation (HE)- humeral plane of elevation (HP), elbow flexion-extension(EF). There were no significant changes for CAV, however individual AADs showed different patterns for each individual. For understanding the role of the variability in skill learning or performance, individual variability analysis may give information better than the group means.
Keywords: Coordination; Variability; Overarm throwing.
1Corresponding author. Kookmin University, 7th building, Room 419, 77 Jeongneung-ro, Seongbuk-gu, Seoul, 02707, Republic
of Korea.
E-mail: [email protected]
Submitted for publication February 2018 Accepted for publication May 2018 Published in press July 2018
JOURNAL OF HUMAN SPORT & EXERCISE ISSN 1988-5202 © Faculty of Education. University of Alicante
doi:10.14198/jhse.2018.134.15
Cite this article as:
VOLUME 13 | ISSUE 4 | 2018 | 885 INTRODUCTION
“Redundancy” and “abundance” terms have been used in various fields in similar but different content. Abundance represents the large quantity of something with a positive nuisance about plentifulness while the redundancy represents the things that are not needed normally but only under in special circumstances (Latash & Zatsiorsky, 2016). The human body needs to solve the degrees of freedom problem for each movement. Therefore, variability exists due to the infinite number of solutions for each movement execution. Variability has been neglected and described as noise because the assumption of motor performance characterized by invariance of the system and movements are highly consisted (Davids, Bennett, & Newell, 2006). But Dynamical System Theory (DST) tools have been used to previous researchers and showed that variability is not a reflection of random noise and may be functionally beneficial (Davids et al., 2006). However, the role of variability in biomechanics is still unknown whether it is useful or not for skill learning and performance (Bartlett, Wheat, & Robins, 2007).
There are detailed overarm throwing studies in the literature especially for baseball pitching (Chu, Fleisig, Simpson, & Andrews, 2009; Escamilla, Fleisig, Barrentine, Zheng, & Andrews, 1998; Werner, Suri, Guido, Meister, & Jones, 2008; Wilk, Meister, Fleisig, & Andrews, 2000). Also, movement variability has been investigated for several throwing activity such as pitching, basketball, handball (Button, MacLeod, Sanders, & Coleman, 2003; Fleisig, Chu, Weber, & Andrews, 2009; Urbin, Stodden, & Fleisig, 2013; Wagner, Pfusterschmied, Klous, von Duvillard, & Müller, 2012). It is hard to compare biomechanical studies especially because of the differences between methodologies to calculate upper extremity kinematics. Therefore, it makes it hard to provide evidence about the role of movement and coordination variability.
Motor learning stages have been defined by several researchers. Vereijken et al. (1992) described three stages as ‘freezing the limbs’, ‘releasing the limbs’ and ‘exploiting the environment’. At the first stages of the skill learning, the variability has been acknowledged high because the system does not have enough information to solve the DOF problem (Vereijken, Emmerik, Whiting, & Newell, 1992; Vereijken, Whiting, & Beek, 1992). Then the variability will decrease with increased information, and at the last stage, variability will increase because of the ability to adapt different external conditions. Therefore, it is expected to see changes of coordination variability through every learning stages.
Coupling angle variability (CAV) is a DST method to explain coordination variability of the movements for cyclical and discrete movements (Heiderscheit, Hamill, & Van Emmerik, 2002; Wilson, Simpson, van Emmerik, & Hamill, 2008). Wilson et al. (2008) investigate the intra-limb coordination variability using the angle-angle plots and coupling angle variability for the ankle, knee, and hip joint during triple jump. It was reported that novices and experts have higher variability than the intermediate level jumpers (Wilson et al., 2008). Wilson et al. (2008) suggest that the according to the DST, intermediate level jumpers are in the second stage that they restrict their movements, therefore, has the lowest variability. Another study suggested using task constraints (such as a heavier ball) during basketball free throw to achieve the right amount of variability because the experts increased their trajectory variability but decreased their space-joint variability (Button et al., 2003). These studies showed that variability calculated with DST methods can be used to differentiate between skill levels and can be useful for skill learning and performance.
886 | 2018 | ISSUE 4 | VOLUME 13 © 2018 University of Alicante
practical role in the motor learning field. The aim of this study was to investigate the changes in coupling angle variability throughout repeated self-practice for 5 weeks without the knowledge of results or performance during an overarm throwing task.
MATERIAL AND METHODS
Participants
Eight female participants were recruited for this study. One participant was excluded because she injured herself in another activity. A total of 7 participants (Age: 25.1 ± 2.4 yrs; Height: 160.8 ± 3.5 cm; Weight: 56.5 ± 7.8 kg) were included for further analysis. All participants were injury free for both lower and upper extremity in recent six months and had no lower or upper extremity surgery in the last 2 years. Participants have no prior throwing experience or training officially. Participants were told to refrain to gain any information visually or verbally about throwing techniques to throw faster.
Procedures
The experiment procedure was approved by Institutional Review Board. Procedures were verbally and writtenly explained to participants. Participants gave their consent to participate in this study. Each participant came to the laboratory for 3 days in a week for 5 weeks. Each session consisted of 15 dominant and non-dominant hand overarm throwing with a baseball. Participants asked to “throw as fast as possible”. Ball speed measured with a speed gun but the participants were not informed about the ball speed. Participants throw the ball to a foam with a size of 3 m x 3 m without any target sign. Each session started with the dominant hand and non-dominant hand, respectively. 225 throws have been recorded for each participant. Therefore, a total 1575 trials have been recorded and processed for all sample group. First three trials of each session and trials with missing markers and gimbal lock occurrences were discarded from data analysis.
Analysis
A 3-dimensional motion analysis system with ten cameras was used in this study (T-10, T40, Oxford Metrics Ltd, UK). The kinematic data were recorded at 200 Hz sampling rate. A previously described marker set and upper extremity model were used in this study to calculate the kinematics of upper extremity (Gates, Walters, Cowley, Wilken, & Resnik, 2016). Anthropometric measurements needed for the biomechanical methods were made at first session. Angles were filtered by a low-pass fourth-order Butterworth filter with a 13.4 Hz as suggested before by other researchers for baseball pitching (Chu et al., 2009; Escamillia et al., 2007; Fleisig, Barrentine, Zheng, Escamilla, & Andrews, 1999). A globe coordinate system to determine the shoulder angles (Doorenbosch, Harlaar, & Veeger, 2003) Shoulder angles were described in order as the plane of elevation (Y’), elevation (X) and axial rotation (Y’’). Elbow angles were described as flexion-extension
(Z), carrying angle (X) and pronation-supination (Y). Wrist angles were described as flexion-extension (Z)
ulnar-radial deviation (X), pronation – supination (Y). Thorax angle relative to the globe coordinate system was described as lateral flexion, axial rotation, and flexion-extension.
Angle-angle diagrams (AAD), coupling angle variability (CAV) were calculated with a custom written script via Matlab R2014a (Mathworks, Inc., MA). Angle values have been time normalized from the start of the movement until the end of the movement includes the follow through after ball release.
Point by point ensemble averaged angle values used for AADs calculated as shown in equation 1 (James, 2004).
𝑀𝑖 = ∑𝑛𝑗=1𝑥𝑖𝑗
VOLUME 13 | ISSUE 4 | 2018 | 887
where is the mean for the ith sample, is the data value for the ith sample and jth trial, n is the number of trials. The proximal segment represents the abscissa and the distal segments represent the ordinate for each AADs (Heiderscheit et al., 2002).
CA and CAV were calculated for each trial and combination using a revised vector coding technique for non-sinusoidal data. CA calculated in Matlab as shown in Equation 2:
𝛾𝑖 = mod(atan2 (𝜃𝐷𝑖+1 − 𝜃𝐷𝑖 , 𝜃𝑃𝑖+1− 𝜃𝑃𝑖), 2𝜋 ∗180
𝜋 ) Eq.2
where is the CA, is the angle of the distal segment, is the angle if the proximal segment (Cunningham, 2012; Heiderscheit et al., 2002; Sparrow, Donovan, van Emmerik, & Barry, 1987).
Then standard deviation of CA calculated using circular statistics in Matlab as shown in Equation 3 and 4, respectively:
𝑎𝑖 = √𝐷𝑖 + 𝑃𝑖 Eq.3
𝐶𝐴𝑉𝑖 = √2(1 − 𝑎𝑖) ∗ 180
𝜋 Eq.4
where is the vector length, is the distal segment angle, is the proximal segment angle (Cunningham, 2012; Sparto & Schor, 2004).
CAV calculated for combinations of elbow extension/humeral elevation (EFHE), Elbow flexion-extension/humeral plane of elevation (EFHP), humeral elevation/ trunk flexion-extension (HETF), humeral elevation/trunk lateral flexion (HETL), humeral plane of elevation/trunk flexion-extension (HPTF), humeral plane of elevation/ trunk lateral flexion (HPTL), Wrist flexion-extension/elbow flexion-extension (WFEF).
Two-way repeated measures ANOVA were used to see the differences of ball speed and CAV values according to weeks and hand side using SPSS Statistics Software (v23, SPSS Inc, Chicago, IL). Paired samples t-test used for post-hoc comparisons between weeks for ball velocity. Significance value was set to .05.
RESULTS
Mean ball speed for dominant and non-dominant hand reported at Table 1. Two-way repeated measures ANOVA with a Greenhouse-Geisser correction determined that ball speed differed significantly between weeks (F(1.584,145.970) = 5.176, p < .05) and throwing side (F(1.000, 863.531) = 17.173, p < .05). Paired sample t-tests were to make post hoc comparisons. There was a significant difference between the dominant and non-dominant side at the first (t(6) = 5.05, p = .002), second (t(6) = 4.11, p = .006), third (t(6) = 3.89, p = .008), fourth (t(6) = 2.90, p = .027) and fifth week (t(6) = 3.52, p = .012). There was a significant difference on ball velocity at the fourth (t(6) = -2.69, p = .036) and fifth week (t(6) = -2.70, p = .036) compared to second week for dominant side. Also, there was a significant difference on ball velocity at the second (t(6) = -3.37, p
888 | 2018 | ISSUE 4 | VOLUME 13 © 2018 University of Alicante
Table 1. Mean ball velocity according to weeks
TS 1st week (km/h) 2nd week (km/h) 3rd week (km/h) 4th week (km/h) 5th week (km/h)
D 45.1 ± 2.6 43.5 ± 4.5 46.4 ± 4.7 48.9 ± 6.7 50.0 ± 8.3
ND 38.7 ± 2.3 38.2 ± 4.6 39.7 ± 5.7 41.2 ± 5.4 51.3 ± 7.2
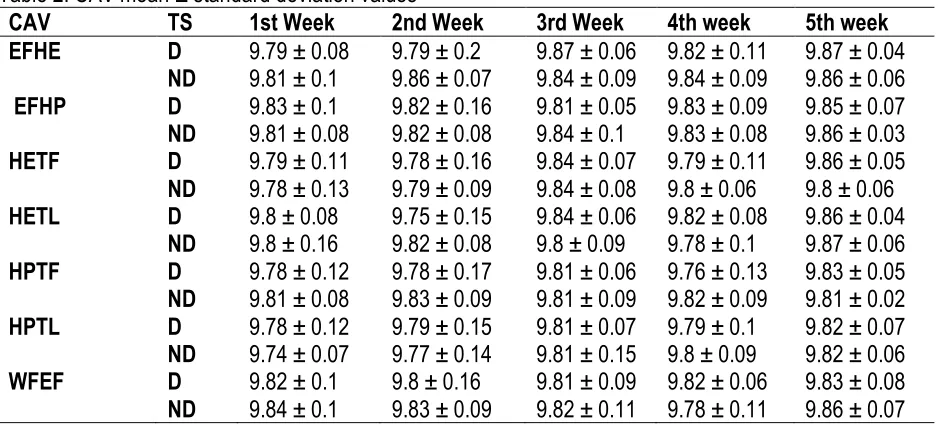
CAV mean values according to weeks and throwing sides were reported in Table 2. There was no statistically significance between weeks or throwing sides.
Table 2. CAV mean ± standard deviation values
CAV TS 1st Week 2nd Week 3rd Week 4th week 5th week
EFHE D 9.79 ± 0.08 9.79 ± 0.2 9.87 ± 0.06 9.82 ± 0.11 9.87 ± 0.04
ND 9.81 ± 0.1 9.86 ± 0.07 9.84 ± 0.09 9.84 ± 0.09 9.86 ± 0.06
EFHP D 9.83 ± 0.1 9.82 ± 0.16 9.81 ± 0.05 9.83 ± 0.09 9.85 ± 0.07
ND 9.81 ± 0.08 9.82 ± 0.08 9.84 ± 0.1 9.83 ± 0.08 9.86 ± 0.03
HETF D 9.79 ± 0.11 9.78 ± 0.16 9.84 ± 0.07 9.79 ± 0.11 9.86 ± 0.05
ND 9.78 ± 0.13 9.79 ± 0.09 9.84 ± 0.08 9.8 ± 0.06 9.8 ± 0.06
HETL D 9.8 ± 0.08 9.75 ± 0.15 9.84 ± 0.06 9.82 ± 0.08 9.86 ± 0.04
ND 9.8 ± 0.16 9.82 ± 0.08 9.8 ± 0.09 9.78 ± 0.1 9.87 ± 0.06
HPTF D 9.78 ± 0.12 9.78 ± 0.17 9.81 ± 0.06 9.76 ± 0.13 9.83 ± 0.05
ND 9.81 ± 0.08 9.83 ± 0.09 9.81 ± 0.09 9.82 ± 0.09 9.81 ± 0.02
HPTL D 9.78 ± 0.12 9.79 ± 0.15 9.81 ± 0.07 9.79 ± 0.1 9.82 ± 0.07
ND 9.74 ± 0.07 9.77 ± 0.14 9.81 ± 0.15 9.8 ± 0.09 9.82 ± 0.06
WFEF D 9.82 ± 0.1 9.8 ± 0.16 9.81 ± 0.09 9.82 ± 0.06 9.83 ± 0.08
ND 9.84 ± 0.1 9.83 ± 0.09 9.82 ± 0.11 9.78 ± 0.11 9.86 ± 0.07
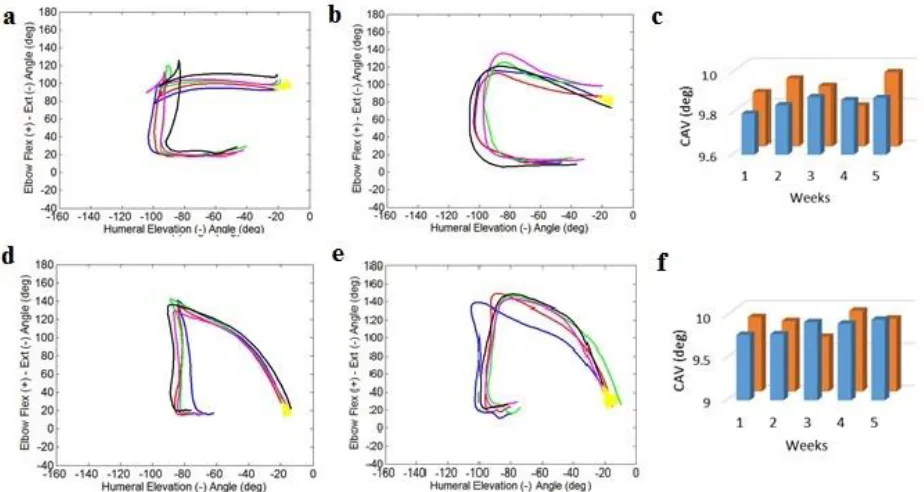
Due to the high number of AAD graphs, only an example for EFHE AADs for the fastest (Participant 1) person shown in Figure 1a and 1b for dominant and non-dominant hand, respectively. AADs for the slowest person (Participant 3) of the group were shown in Figure 1d and 1e for dominant and non-dominant hand, respectively. Also, CAV graphs for Participant 1 and 3 were shown in Figure 1c and 1d, respectively.
DISCUSSION
There are limited studies which investigated open skills and upper extremity variability compared to lower extremities (Ball & Best, 2012; Button et al., 2003; Horan, Evans, & Kavanagh, 2011; Urbin et al., 2013; Wagner et al., 2012; Whiteside, Elliott, Lay, & Reid, 2015; Wilson et al., 2008). Throwing biomechanics has been investigated extensively (Chu et al., 2009; Fleisig et al., 1999; Fleisig & Escamilla, 1996), but the coordination and variability studies are limited for upper extremity (Button et al., 2003; Fleisig et al., 2009; Whiteside et al., 2015). Other studies showed that there is sequential movement from trunk to upper extremity joints during pitching (Oyama et al., 2014; Seroyer et al., 2010). This sequential movement is important to transfer the torque produced by the trunk segment to the end segment of the upper extremity. Therefore emphasize the role of coordination in throwing activities.
VOLUME 13 | ISSUE 4 | 2018 | 889
Figure 1. Example of EFHE AADs and CAV values
Our study used coupling angle variability to quantify coordination variability which is based on DST showed no statistically significant differences. CAV were calculated for several combinations and showed similar measures for each combination. However, it was evident that each individual showed different patterns for AADs such as showed in Figure 1. Even though the sample group is relatively small, high trial numbers were enough to create stable profiles. It was expected that CAV decreases in time because of the repeated exercises for both dominant and non-dominant side. Lack of changes in CAV measures can be caused by several factors. One of the reasons can be 5 weeks were not enough to cause changes in coordination variability. A longer follow-nup study is needed when the coordination variability change over time and whether it is related to performance. The amount of variability has seen in this study can be the baseline variability according to the DST because all of the systems already have an amount of variability (Bartlett et al., 2007; Glazier & Wheat, 2014; Van Emmerik, Miller, & Hamill, 2014).
There are studies that show a relationship between the performance and variability according to the skill level (Bradshaw et al., 2009; Wilson et al., 2008). Even though there is a slight increase of ball speed, the role of coordination variability was not certain during the practice period. It may be related that participants skill level was not changed enough to increase or decrease the baseline variability. But like the AADs, CAV measurements showed individual trends such as increasing or decreasing in time. These trends differed according to individuals, throwing side and AAD combinations (Figure 1c and Figure 1f). Therefore, researchers or coaches should be careful which coupling they are investigating for practical uses in case of using this method in the individual level.
890 | 2018 | ISSUE 4 | VOLUME 13 © 2018 University of Alicante
feedback has influenced the error correction, performance, and variability, it is unknown that the how the coordination variability resulted without feedback. In our study, we want to emphasize whether the learning to improve performance is possible with the sensory system feedback of body. Even though there was not a control group, dominant hand comparing to the non-dominant hand also showed no differences. Dominant hand throws were faster than the non-dominant hand, therefore, can be suggested dominant hand’s skill was better than the non-dominant. The similar CAV measurements showed that dominant and non-dominant hand coordination variability cannot be distinguished even though they have different skill levels.
Each participant showed unique patterns for AADs but similar patterns between weeks (Figure 1). Therefore variability studies should prioritize the intra-individual studies more than the inter-individuals (Carson, Collins, & Richards, 2013) because of the similarities of the uniqueness of patterns. These unique patterns may result because of the system properties for each participant. It was expected that participants use their strongest points to throw as fast as possible because of the absence of any kind of feedback. Therefore variability measures can be affected by the personal preferences of the participants to throw the ball faster.
It has been proved that variability can be used practically to identify different populations such as the gender, injury, illness, transition stages of skill learning and skill level especially for the lower extremities (Bradshaw et al., 2009; Galna, Lord, & Rochester, 2013; Gribbin et al., 2016; Horan et al., 2011; Wilson et al., 2008). Even though upper extremity has limitations to define its kinematics, more discriminative studies needed to understand and simplify the use of variability in the field for upper extremity involved activities. The lack of trend in the CAV values shows the need for the comparison of the different variability quantifications. It has been reported that different variability quantifications have their limitations and benefits (Van Emmerik et al., 2014; Wheat & Glazier, 2006). Therefore a comparison of these methods for upper extremity needs to be made for more objective results in the future.
These inter-individual differences also indicated the importance of non-linear methods to investigate the coordination and its variability. Non-linear methods should be used to understand the coordination and its variability rather than simplifying the results with peak or mean measures at specific movement events (van Emmerik, Ducharme, Amado, & Hamill, 2016; Wheat & Glazier, 2006).
This research has limitations such as length of the study, its small sample group, and absence of a control group. The high number of trials has been enough to create stable means of individuals for overarm throwing kinematics (Taylor, Lee, Landeo, O’Meara, & Millett, 2015) but it was insufficient to generalize this study’s results for a larger population. Longer studies may be able to show differences in skill learning even though there were no differences across the weeks in our study. Also, researchers should be mindful of the rate of improvement in future studies whether it has an effect on variability or not.
CONCLUSIONS
VOLUME 13 | ISSUE 4 | 2018 | 891 ACKNOWLEDGEMENTS
This study was financially supported by the Ministry of Education through the support of National Research Foundation of Korea’s Basic Humanities and Social Research Support-General Joint Research Support Project (Project number: NRF-2013S1A5A2A03045819). First author was supported by Global Scholarship Program for Foreign Graduate Students at Kookmin University in Korea.
REFERENCES
Ball, K., & Best, R. (2012). Centre of pressure patterns in the golf swing: individual-based analysis. Sport Biomech, 11(2), 175–189. http://doi.org/10.1080/14763141.2012.673007
Bartlett, R., Wheat, J., & Robins, M. (2007). Is movement variability important for sports biomechanists? Sport Biomech, 6(2), 224–243. http://doi.org/10.1080/14763140701322994
Bradshaw, E. J., Keogh, J., Hume, P., Maulder, P., Nortje, J., & Marnewick, M. (2009). The effect of biological movement variability on the performance of the golf swing in high- and low- handicapped players. Res Q Exercise Sport, 80(2), 185–196. http://doi.org/10.1080/02701367.1997.10608013
Button, C., MacLeod, M., Sanders, R., & Coleman, S. (2003). Examining movement variability in the basketball free-throw action at different skill levels. Res Q Exercise Sport, 74(3), 257–269.
http://doi.org/10.1080/02701367.2003.10609090
Carson, H. J., Collins, D., & Richards, J. (2013). Intra-individual movement variability during skill
transitions: A useful marker? Eur J Sport Sci, 14(July), 37–41.
http://doi.org/10.1080/17461391.2013.814714
Chu, Y., Fleisig, G. S., Simpson, K. J., & Andrews, J. R. (2009). Biomechanical comparison between elite
female and male baseball pitchers. J Appl Biomech, 25(1), 22–31.
https://doi.org/10.1123/jab.25.1.22
Cortes, N., Onate, J., & Morrison, S. (2014). Differential effects of fatigue on movement variability. Gait Posture, 39(3), 888–93. http://doi.org/10.1016/j.gaitpost.2013.11.020
Cunningham, T. J. (2012). The Clinical Usefulness of Vector Coding Variability in Female Runners With and Without Patellofemoral Pain. University of Kentucky.
Davids, K., Bennett, S., & Newell, K. (Eds.). (2006). Movement System Variability. Champaign, IL: Human Kinetics.
Doorenbosch, C. A. M., Harlaar, J., & Veeger, D. H. E. J. (2003). The globe system: an unambiguous description of shoulder positions in daily life movements. J Rehabil Res Dev, 40(2), 147–155.
http://doi.org/10.1682/JRRD.2003.03.0149
Escamilla, R. F., Fleisig, G. S., Barrentine, S. W., Zheng, N., & Andrews, J. R. (1998). Kinematic comparisons of throwing different types of baseball pitches. J Appl Biomech, 14(1), 1–23.
http://doi.org/10.1123/jab.14.1.1
Escamillia, R., Barentinne, S., Fieisig, G., Naiquan, Z., Takada, Y., Kingsiey, D., & Andrews, J. (2007). Pitching biomechanics as a pitchers approaches muscular fatigue during a simulated baseball game. Am J Sport Med, 35(1), P. 22-33. http://doi.org/10.1177/0363546506293025
Fleisig, G. S., Barrentine, S. W., Zheng, N., Escamilla, R. F., & Andrews, J. R. (1999). Kinematic and kinetic comparison of baseball pitching among various levels of development. J Biomech, 32(12), 1371–1375. http://doi.org/10.1016/S0021-9290(99)00127-X
Fleisig, G. S., Chu, Y., Weber, A., & Andrews, J. (2009). Variability in baseball pitching biomechanics
among various levels of competition. Sport Biomech, 8(1), 10–21.
892 | 2018 | ISSUE 4 | VOLUME 13 © 2018 University of Alicante
Fleisig, G. S., & Escamilla, R. E. (1996). Biomechanics of the Elbow in the Throwing Athlete. Oper Techn Sport Med, 4(2), 62–68. http://doi.org/10.1016/S1060-1872(96)80050-5
Galna, B., Lord, S., & Rochester, L. (2013). Is gait variability reliable in older adults and Parkinson's
disease? Towards an optimal testing protocol. Gait Posture, 37(4), 580–585.
http://doi.org/10.1016/j.gaitpost.2012.09.025
Gates, D. H., Walters, L. S., Cowley, J., Wilken, J. M., & Resnik, L. (2016). Range of motion requirements for upper-limb activities of daily living. Am J Occup Ther, 70(1), 7001350010p1-7001350010p10.
http://doi.org/10.5014/ajot.2016.015487
Glazier, P. S., & Wheat, J. S. (2014). An integrated approach to the biomechanics and motor control of cricket fast bowling techniques. Sports Med, 44(1), 25–36. http://doi.org/10.1007/s40279-013-0098-x
Gribbin, T. C., Slater, L. V., Herb, C. C., Hart, J. M., Chapman, R. M., Hertel, J., & Kuenze, C. M. (2016). Differences in hip-knee joint coupling during gait after anterior cruciate ligament reconstruction. Clin Biomech, 32, 64–71. http://doi.org/10.1016/j.clinbiomech.2016.01.006
Heiderscheit, B. C., Hamill, J., & Van Emmerik, R. E. A. (2002). Variability of stride characteristics and joint coordination among individuals with unilateral patellofemoral pain. J Appl Biomech, 18(2), 110– 121. https://doi.org/10.1123/jab.18.2.110
Horan, S. A., Evans, K., & Kavanagh, J. J. (2011). Movement variability in the golf swing of male and
female skilled golfers. Med Sci Sport Exer, 43(8), 1474–1483.
http://doi.org/10.1249/MSS.0b013e318210fe03
James, C. R. (2004). Considerations of Movement Variability in Biomechanics Research. In P. Stergiou (Ed.), Innovative Analyses of Human Movement (pp. 29–62). Champaign, IL: Human Kinetics. Latash, M. L., & Zatsiorsky, V. M. (2016). Biomechanics and Motor Control: Defining Central Comcepts.
London: Academic Press.
Magill, R. A., & Anderson, D. (2014). Motor learning and control: Concepts and applications (10th editi). New York: McGraw-Hill.
Oyama, S., Yu, B., Blackburn, J. T., Padua, D. A., Li, L., & Myers, J. B. (2014). Improper trunk rotation sequence is associated with increased maximal shoulder external rotation angle and shoulder joint
force in high school baseball pitchers. Am J Sport Med, 42(9), 2089–94.
http://doi.org/10.1177/0363546514536871
Seroyer, S. T., Nho, S. J., Bach, B. R., Bush-Joseph, C. A., Nicholson, G. P., & Romeo, A. A. (2010). The kinetic chain in overhand pitching: its potential role for performance enhancement and injury prevention. Sports Health, 2(2), 135–46. http://doi.org/10.1177/1941738110362656
Sparrow, W. A., Donovan, E., van Emmerik, R., & Barry, E. B. (1987). Using relative motion plots to measure changes in intra-limb and inter-limb coordination. J Motor Behav, 19(1), 115–29.
http://doi.org/10.1080/00222895.1987.10735403
Sparto, P., & Schor, R. (2004). Directional Statistics. In P. Stergiou (Ed.), Innovative Analyses of Human Movement (pp. 121–161). Champaign, IL: Human Kinetics.
Taylor, P. G., Lee, K.-Y., Landeo, R., O'Meara, D. M., & Millett, E. (2015). Determining optimal trial size
using sequential analysis. J Sport Sci, 33(3), 300–308.
http://doi.org/10.1080/02640414.2014.942679
Urbin, M. A., Stodden, D., & Fleisig, G. (2013). Overarm Throwing Variability as a Function of Trunk Action. J Mot Learn Dev, 1, 89–95. https://doi.org/10.1123/jmld.1.4.89
van Emmerik, R. E. A., Ducharme, S. W., Amado, A. C., & Hamill, J. (2016). Comparing dynamical systems concepts and techniques for biomechanical analysis. J Sport Health Sci, 5(1), 3–13.
VOLUME 13 | ISSUE 4 | 2018 | 893
Van Emmerik, R. E. A., Miller, R. H., & Hamill, J. (2014). Dynamical systems analysis of coordination. In 2nd Edition (Ed.), Research Methods in Biomechanics (pp. 291–315). Champaign, IL: Human Kinetics.
Vereijken, B., Emmerik, R. E. A. van, Whiting, H. T. A., & Newell, K. M. (1992). Free(z)ing degrees of
freedom in skill acquisition. J Motor Behav, 24(1), 133–142.
http://doi.org/10.1080/00222895.1992.9941608
Vereijken, B., Whiting, H., & Beek, W. (1992). A Dynamical Systems Approach to Skill Acquisition. Q J Exp Psychol A, 45(2), 323–344. http://doi.org/10.1080/14640749208401329
Wagner, H., Pfusterschmied, J., Klous, M., von Duvillard, S. P., & Müller, E. (2012). Movement variability
and skill level of various throwing techniques. Hum Mov Sci, 31(1), 78–90.
http://doi.org/10.1016/j.humov.2011.05.005
Werner, S. L., Suri, M., Guido, J. A., Meister, K., & Jones, D. G. (2008). Relationships between ball velocity and throwing mechanics in collegiate baseball pitchers. J Shoulder Elbow Surg, 17(6), 905– 908. http://doi.org/10.1016/j.jse.2008.04.002
Wheat, J. S., & Glazier, P. S. (2006). Measuring Coordination and Variability in Coordination. In K. Davids, S. Bennet, & K. Newell (Eds.), Movement System Variability (pp. 167–181). Champaign, IL: Human Kinetics.
Whiteside, D., Elliott, B. C., Lay, B., & Reid, M. (2015). Coordination and variability in the elite female tennis serve. J Sports Sci, 33(7), 675–686. http://doi.org/10.1080/02640414.2014.962569
Wilk, K., Meister, K., Fleisig, G., & Andrews, J. R. (2000). Biomechanics of the overhead throwing motion. Sports Med Arthrosc Rev, 8(2), 124–134. http://doi.org/10.1097/00132585-200008020-00002
Wilson, C., Simpson, S. E., van Emmerik, R. E. A., & Hamill, J. (2008). Coordination variability and skill
development in expert triple jumpers. Sport Biomech, 7(1), 2–9.
http://doi.org/10.1080/14763140701682983