Original Research Article
Stages of recovery from depression in relation to clinical outcomes and
consumer recovery processes
Benjamin C. Y. Low
1, Kokkwang Lim
1, Meiyin Wong
2, Sayleong Ooi
2*,
Lindsay G. Oades
3, Chee Khong Yap
2INTRODUCTION
Policymakers across much of the English-speaking world have recognized that “recovery” from mental illness involves patient-defined dimensions like identity, renewed meaning in life, and self-management of the illness that go beyond mere symptom reduction.1-6 This is known as consumer recovery. However, the implementation of recovery-oriented services is impeded by a lack of quantitative studies detailing the recovery process over time.7 There is also a need for further
research on recovery measurement with the aim of including these measures in routine clinical assessment, service evaluation, and research.8
Against this background, the current decade may be witnessing the first signs of consensus on recovery processes and models. However, their validity and relationship with traditional clinical measures like functioning and symptoms has yet to be empirically ascertained. The present study examines the convergent validity of a model of the stages of recovery against
ABSTRACT
Background: Research on consumer-defined recovery from mental illness has been critiqued for a lack of quantitative evidence and conceptual clarity that has impeded further development of recovery-oriented services. This is especially true when it comes to models of the stages of recovery from mental illness. Qualitative studies have produced 20 distinct stage models with significant similarities but limited quantitative validation. The present study tests the convergent validity of one promising model in relation to psychosocial functioning, depression symptoms, and the processes that are thought to underpin consumer-defined recovery.
Methods: Eighty-eight patients with depressive symptoms were recruited. Patient-rated and clinician-rated measures were used to assess participants‟ current stage of recovery, depressive symptoms, psychosocial functioning, and their level of attainment on the processes of recovery.
Results: Higher stages of recovery were associated with better depression symptoms, participant and clinician rated functioning, and several recovery processes that were repeatedly identified by past research. The effect sizes were consistently large.
Conclusions: Evidence of convergent validity was found for the model under study. Together with previous research, results suggest that the model may be a promising description of the recovery process and could inform the development of recovery-oriented services.
Keywords: Consumer recovery, Recovery model, Recovery stages, Depression, Psychosocial functioning, CHIME
1
School of Psychology, James Cook University, Singapore, Singapore
2
Psychology Services, National Healthcare Group Polyclinics, Singapore
3
Centre for Positive Psychology, MGSE, University of Melbourne, Victoria, Australia
Received: 25 December 2018
Revised: 03 February 2019
Accepted: 04 February 2019
*Correspondence:
Mr. Sayleong Ooi,
E-mail: [email protected]
Copyright: © the author(s), publisher and licensee Medip Academy. This is an open-access article distributed under the terms of the Creative Commons Attribution Non-Commercial License, which permits unrestricted non-commercial use, distribution, and reproduction in any medium, provided the original work is properly cited.
consumer recovery processes and more traditional clinical indices of recovery. It is hoped that this study, and others like it, will pave the way for an empirically supported consensus on the nature of consumer recovery.
Stages of consumer recovery: The most cited definition of consumer recovery was succinctly paraphrased as “the establishment of a fulfilling, meaningful life and a positive sense of identity founded on hopefulness and self-determination” (p588).9-11 Researchers have proposed that patients progress through a series of sequential phases leading to recovery. Qualitative research with consumers has yielded twenty different stage models with significant conceptual similarities.12,13 While the 20 existing models differed on the number and type of stages, they agreed that recovery occurred progressively across several distinctive stages. One stage model that appears to have the largest corpus of quantitative validation is the model by Andresen et al.8,11,14 To avoid
confusing it with other stage models, it will be referred to as the “Andresen model” in the present study.
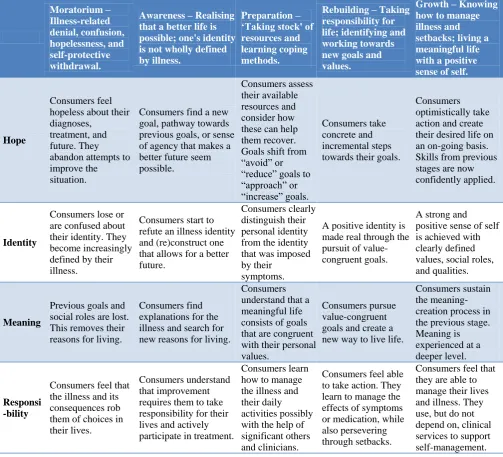
The Andresen models one of the few models with any quantitative validation. It is also unique because it was not created through yet another qualitative interview. Instead, the model was based on a review that synthesized common themes across consumer accounts of recovery.11 This can be seen as the first attempt to develop a consensus about the stages of recovery. The model and its theorized underlying processes are depicted in Table 1.
Higher stages of the Andresen model were associated with better scores on various measures of consumer-defined recovery and psychological symptoms.8 This provided initial support for the convergent validity of the Andresen model.
Table 1: Summary of key changes across the stages of recovery.15
Moratorium – Illness-related denial, confusion, hopelessness, and self-protective withdrawal.
Awareness – Realising that a better life is possible; one's identity is not wholly defined by illness.
Preparation – ‘Taking stock' of resources and learning coping methods.
Rebuilding – Taking responsibility for life; identifying and working towards new goals and values.
Growth – Knowing how to manage illness and setbacks; living a meaningful life with a positive sense of self.
Hope
Consumers feel hopeless about their diagnoses,
treatment, and future. They abandon attempts to improve the situation.
Consumers find a new goal, pathway towards previous goals, or sense of agency that makes a better future seem possible.
Consumers assess their available resources and consider how these can help them recover. Goals shift from “avoid” or “reduce” goals to “approach” or “increase” goals.
Consumers take concrete and incremental steps towards their goals.
Consumers optimistically take action and create their desired life on an on-going basis. Skills from previous stages are now confidently applied.
Identity
Consumers lose or are confused about their identity. They become increasingly defined by their illness.
Consumers start to refute an illness identity and (re)construct one that allows for a better future.
Consumers clearly distinguish their personal identity from the identity that was imposed by their
symptoms.
A positive identity is made real through the pursuit of value-congruent goals.
A strong and positive sense of self is achieved with clearly defined values, social roles, and qualities.
Meaning
Previous goals and social roles are lost. This removes their reasons for living.
Consumers find explanations for the illness and search for new reasons for living.
Consumers understand that a meaningful life consists of goals that are congruent with their personal values.
Consumers pursue value-congruent goals and create a new way to live life.
Consumers sustain the meaning-creation process in the previous stage. Meaning is experienced at a deeper level.
Responsi -bility
Consumers feel that the illness and its consequences rob them of choices in their lives.
Consumers understand that improvement requires them to take responsibility for their lives and actively participate in treatment.
Consumers learn how to manage the illness and their daily activities possibly with the help of significant others and clinicians.
Consumers feel able to take action. They learn to manage the effects of symptoms or medication, while also persevering through setbacks.
Processes of consumer recovery
Leamy, Bird, Le Boutillier, Williams, and Slade noted the lack of conceptual clarity about the processes that drive consumer-defined recovery.13 Their systematic review revealed that there are five broad, prominent processes (CHIME) that are thought to drive recovery: (1) social connectedness (e.g., support from friends and family), (2) hope about the future (e.g., of recovery and a better future), (3) developing a positive identity (e.g., overcoming stigma and regaining self-esteem), (4) renewed meaning in life (e.g., enhancing their quality of life and sense of purpose), and (5) empowerment (e.g., developing care plans and coping skills). It shares some similarities with the processes of hope, identity, meaning, and responsibility for recovery in the Andresen model.
The CHIME framework was validated with consumer focus groups where it was deemed to offer a defensible framework to guide clinical practice and research.16 Several other studies further supported the validity of the CHIME framework and its utility for understanding recovery, even as some of them suggested new additions to the framework.7,17-19 This may represent the first consensus on the presence of common, underlying processes of recovery across disparate accounts on the topic.
Areas of uncertainty
Despite the growth in research on consumer recovery, there are three ongoing areas of uncertainty that have received limited empirical attention. The first concerns the role of symptoms and functioning. Philosophically, consumer recovery occurs when the illness ceases to be the primary focus in life even if the illness or some disability remains.9, 20 At the same time, consumer and clinician rated symptoms improved across the stages of recovery even as the impact of symptoms diminished in the last stage of recovery.8,14 However, it also stands to reason that the aspirational quality of life in consumer recovery, and the functional ability that is required to achieve it, will be hampered to the extent that a person experiences debilitating symptoms. Thus, we would expect both symptoms and functioning to improve across successive stages of recovery.
Secondly, the Andresen model‟s relationship with the CHIME recovery processes has yet to be assessed. Several qualitative studies with consumers have supported the validity and utility of the CHIME framework.7, 13-16 If the Andresen model does represent the stages of recovery, it should be associated improvements in CHIME recovery processes. This has not been examined before.
Thirdly, and of importance for service delivery, research on recovery models and frameworks are primarily based on expert opinion and qualitative methods that are relatively low in the hierarchy of evidence-based
practice.7 Quantitative studies with standardised recovery instruments – such as the one that is used to determine a person‟s stage of recovery in the Andresen model–may help stakeholders develop, justify, and refine services or interventions that explicitly focus on consumer recovery.
Lastly, consumer recovery has largely focused on individuals with psychosis or who otherwise require tertiary-level care. This includes the two key studies that support the Andresen model.8,14 However, government white papers from multiple countries have advocated for recovery-oriented services for all individuals with mental illnesses regardless of type or severity.1-6 Of all the mental illnesses, primary care depression may be the bigger public health concern. It has the fourth greatest worldwide burden of disease and is projected to have the second greatest burden of disease by 2030.21 Furthermore, its identification and treatment is mainly achieved at the primary care level of formal healthcare.21 With this in mind, recovery-oriented services may receive greater impetus if recovery research focused on this population in addition to people with tertiary-level illnesses.
The present study
This study examined the convergent validity of the Andresen model for patients with depressive symptoms in primary care. The model‟s convergent validity would be supported if successive stages were associated with improved (1) psychosocial functioning, (2) depression symptoms, and (3) recovery processes. The recovery processes refer to those in CHIME as well as those that were defined and measured specifically for the Andresen model.8 This will determine if the Andresen model is valid in relation to both consumer and clinical indices of recovery. Exploratory inter-stage comparisons for all three variables of interest were also conducted to examine if the associations shared any common patterns.
METHODS Participants
Measures
A translator who was familiar with the nuances of local Mandarin produced a Mandarin version of the scales below. The translator worked closely with a co-investigator to disambiguate any psychological terms.
Recovery stage
Recovery stage allocation was based on the self-identified stages of recovery scale, part A (SISR-A).8 This scale asks which of five descriptions best applies to the participant now. Each description reflects a particular stage of the Andresen model (e.g., the Growth stage: “I feel I am in control of my health and my life now. I am doing very well and the future looks bright”). The validity of the scale has received some initial support: Its stage allocations are positively associated with various measures of recovery.8 There were five, 11, 39, 23, and 10 individuals across the five successive stages of recovery respectively.
Depression symptoms
The patient health questionnaire 9-item scale (PHQ-9) measures the frequency of nine depression symptoms over the past fortnight.22 Responses are made on a Likert scale (0=not at all, 3=nearly every day). There are five tiers of severity. In the current sample, 37 participants fell in the “minimal” category (score ≤4), 30 in the “mild” range (score 5-9), 16 in the “moderate” range (score 10-14), 4 in the “moderately severe” range (score 15-19), and one in the “severe” range (score ≥20).
The PHQ-9 has demonstrated convergent validity and internal reliability with an acceptable Cronbach‟s alpha of 0.87 in local primary care settings.23-25 This is a routine outcome measure for psychology services at NHGP.
Patient-rated psychosocial function
This was measured with item 10 of the PHQ-9 above. The item asked, “if you checked off any problems, how difficult have those problems made it for you to do your work, take care of things at home, or get along with other people?”. Responses range from 0=not difficult at all, to 3=extremely difficult. Lower scores reflect higher functioning.
Clinician-rated psychosocial function
This was measured with the global assessment of functioning (GAF) scale from the DSM-IV-TR.26 Scores range from 1-100 with higher values reflecting better social, occupational, and psychological functioning. A score of 0 can be given if there is inadequate information to make a judgment. In the present study, 0 was treated as missing data. The GAF is a routine outcome measure at NHGP.
Andresen model-specific recovery processes
The self-Identified stages of recovery scale, part B (SISR-B), consists off our items with a six-point Likert scale (1=disagree strongly, 6=agree strongly).8 The items represent the four processes that are thought to drive stage transitions in the Andresen model. The SISR-B has demonstrated convergent validity with other measures of consumer-defined recovery.8 Unlike CHIME, the SISR-B does not include “social connectedness” as a recovery process.
Connectedness
The 12-item multidimensional scale of perceived social support measured “Connectedness” in CHIME.27The scale assesses the perceived adequacy of social support from friends, family, and significant others on a seven-point Likert scale (1=very strongly disagree, 7=very strongly agree). The scale‟s convergent validity and test-retest reliability has been established, and its factor structure had also been validated in Singapore.28, 29
Hope: This was measured with the state hope scale.30 This refers to cognitions about one‟s ability to (1) start and sustain goal-directed actions (i.e., agency) and (2) create routes to achieve those goals (i.e., pathways). The scale consists of six items on an eight-point Likert scale (1=definitely false, 8=definitely true). It has good overall internal reliability, factor structure, and convergent validity.30
Identity: The Modified Engulfment Scale was used to measure “identity” in CHIME. It consists of 24 items on a five-point Likert scale (1=completely false, 5=completely true) that assesses how much patients “see themselves totally and merely in terms of their illness” (p41).31 The scale has demonstrated internal reliability and convergent validity.31
Meaning: The Life Engagement Test was used to measure “meaning” in the CHIME taxonomy.32
Meaning in life is conceptualized as the extent that individuals engage in personally valued activities. The scale has six items with a five-point Likert scale (1=strongly disagree, 5=strongly agree). It has demonstrated convergent validity and test-retest reliability.32
Empowerment: The mental health self-efficacy scale assesses patients‟ confidence in managing their stress, anxiety, or depression.33 The scale has six items and responses are made on a ten-point Likert scale (1=not at all confident, 10=totally confident). It has an acceptable factor structure, internal validity, and convergent validity.33
Procedure
National Healthcare Group Domain Specific Review Board, Singapore. Each participant had also provided their informed consent for their data to be used in this research.
The study was conducted from February 2017 to October 2017. Clinical psychologists screened each potential participant with the PHQ-9 and GAF on the day of their participation. After providing their informed consent, the participants verbally responded to scales as the co-investigator read them out in English or Mandarin to circumvent potential problems with reading proficiency. The participants‟ PHQ-9 and GAF scores were subsequently retrieved from medical records.
Statistical analysis
ANOVAs were used to test for associations between the stages of recovery and the other variables of interest. Bonferroni adjustments were used to correct for the multiple testing of main effects. Twelve ANOVAs were conducted with a Bonferroni-adjusted alpha of .0041. Effect sizes were determined by Cohen‟s f, where the thresholds for small, medium, and large effects were f
=0.10, 0.25, and 0.40 respectively.34
Significant linear trends were followed up with exploratory post-hoc, between-stage comparisons to
determine where one stage substantially differed from the others on a given variable. These were adjusted for multiple testing using Tukey‟s tests or Bonferroni adjustments where appropriate. For the latter, the adjusted alpha value for the 10 post hoc contrasts on each variable was 0.005.
RESULTS
Recovery stage and functioning
Higher stages of recovery were associated with better patient-rated functioning, F (4, 83)=11.18, p<0.001, eta2=0.35, with a large effect size off 0.73. Better clinician-rated functioning was also observed across the stages of recovery, F (4, 83)=6.81, p<0.001, eta2=0.24, with a large effect size off 0.57. These results are displayed in Figure 1.
Exploratory post-hoc analyses were conducted to locate significant differences in functioning between the stages of recovery. Tukey‟s test was used to adjust for multiple testing for patient-rated functioning while Bonferroni adjustments were used for clinician-rated functioning as the assumption of homogenous between-group variance was violated for the latter. Significant inter-stage comparisons are displayed in Table 2.All other comparisons were non-significant, p≥0.05.
Table 2: Significant inter-stage differences in psychosocial functioning.
Comparisons
Mean of lower stage
Mean of higher stage
P value
Patient-rated functioning*
Stage 1 vs. Stage 3 2.40 1.66 0.005 Stage 1 vs. Stage 4 2.40 1.26 <0.001 Stage 1 vs. Stage 5 2.40 1.40 0.001 Stage 2 vs. Stage 3 2.36 1.66 <0.001 Stage 2 vs. Stage 4 2.36 1.26 <0.001 Stage 2 vs. Stage 5 2.36 1.40 <0.001 Stage 3 vs. Stage 4 1.66 1.26 0.005
Clinician-rated functioning
Stage 1 vs. Stage 3 57.20 64.10 <0.001 Stage 1 vs. Stage 4 57.20 67.43 <0.001 Stage 1 vs. Stage 5 57.20 66.20 0.002 Stage 2 vs. Stage 3 57.72 64.10 0.026 Stage 2 vs. Stage 4 57.72 67.43 <0.001 Stage 2 vs. Stage 5 57.72 66.20 0.003
*Lower scores reflect higher functioning.
Recovery stage and depression symptoms
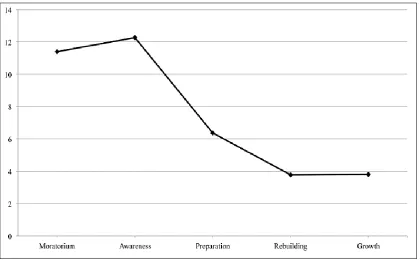
Depression symptoms were inversely associated with recovery stage, F (4, 83)=13.09, p<0.001, eta2=0.38, with a large effect size of f=0.79. The trend line is displayed in Figure 2.
Table 3: Significant inter-stage differences in depression symptoms.
Comparisons
Mean of lower stage
Mean of higher stage
P value
Patient-rated functioning (on PHQ-F)*
Stage 1 vs. Stage 4 11.40 3.78 0.001 Stage 1 vs. Stage 5 11.40 3.80 0.004 Stage 2 vs. Stage 3 12.27 6.36 <0.001 Stage 2 vs. Stage 4 12.27 3.78 <0.001 Stage 2 vs. Stage 5 12.27 3.80 <0.001
*Lower scores reflect higher functioning.
Post-hoc tests could not use Tukey‟s test due to heterogeneity of variance and Bonferroni adjustments were used instead. Table 3 displays the significant between-stage comparisons.
Figure 2: PHQ-9 depression symptom trajectory across the stages of recovery. Recovery stage and recovery processes
None of the Andresen model‟s recovery processes (measured with the SISR-B) were significantly associated with recovery stage at the Bonferroni-adjusted alpha of 0.0041. In contrast, four of the five CHIME recovery processes exhibited medium to large associations (Table
4) in the expected directions (Figure 3) across the stages of recovery.
Figure 3: Trajectory of CHIME recovery drivers across the Andresen model’s stages of recovery. *A decrease in engulfment is expected: the extent that an individual’sidentity as defined by depression is expected to fall as that
person recovers.
Table 4: Associations between CHIME recovery processes and the stages of recovery in the Andresen model.
CHIME recovery process (operationalisation) F eta2 Cohen’s f Effect size
Connectedness (social support) 3.62 0.14 0.35 Medium Hope (state hope) 7.52* 0.26 0.57 Large Identity (engulfment) 14.57* 0.41 0.81 Large Meaning (life Engagement) 5.04* 0.19 0.43 Large Empowerment (mental health self-efficacy) 7.81* 0.27 0.59 Large
*Statistically significant associations.
Table 5: Significant inter-stage differences in CHIME recovery processes.
Comparisons Mean of lower stage Mean of higher stage P value
Engulfment*
Stage 1 vs. Stage 3 87.40 62.12 <0.001 Stage 1 vs. Stage 4 87.40 51.39 <0.001 Stage 1 vs. Stage 5 87.40 46.00 <0.001
Stage 2 vs. Stage 4 70.09 51.39 0.001
Stage 2 vs. Stage 5 70.09 46.00 <0.001
Stage 3 vs. Stage 4 62.12 51.39 0.011
Stage 3 vs. Stage 5 62.12 46.00 0.003
Life engagement
Stage 1 vs. Stage 5 18.60 24.30 0.046
Stage 2 vs. Stage 4 19.36 23.65 0.018
Stage 2 vs. Stage 5 19.26 24.30 0.024
Mental health self-efficacy
Stage 1 vs. Stage 3 23.00 37.97 0.035
Stage 1 vs. Stage 4 23.00 44.39 0.001
Stage 1 vs. Stage 5 23.00 50.70 <0.001
Stage 2 vs. Stage 5 33.54 50.70 0.004
Stage 3 vs. Stage 5 37.97 50.70 0.011
DISCUSSION
This study sought to examine the convergent validity of the Andresen model for depression in a primary care setting. The model was validated against psychosocial functioning, depression symptoms, and psychosocial functioning.
Recovery stages, psychosocial functioning, and depression symptoms
If the Andresen model were valid, the higher stages of the model should be associated with better psychosocial functioning and depression symptoms. While consumer-defined recovery can occur even if the underlying illness and disability is not completely removed, some improvement in psychosocial functioning and symptoms is arguably needed for consumers to effectively live the hopeful and self-determined life described by Andresen et al.11,20
Previous research found that the stages of recovery were associated with improved symptoms but unrelated to functioning.8 However, the present study found that symptoms as well as consumer- and clinician-rated functioning improved across the stages of recovery. These results provide evidence of the Andresen model‟s validity in relation to clinical indices of recovery.
In addition, the results suggest that symptoms and functioning may improve the most between the stages where consumers are thinking about recovery (i.e., stages 1 and 2) and doing something about it (i.e., stages 3 to 5). A significant change from stage 1 only occurs around stage 3 or 4. Between stages 3 to 5, consumers‟ functioning appeared to climb at a rate that was not statistically significant. It is possible that stage 3 is the first stage where consumers make more substantial plans toward recovery. A significant improvement in psychosocial functioning might facilitate consumers‟ planning about recovery and any actual shifts in their recovery stages. Beyond stage 3, other factors besides psychosocial functioning may also be needed for consumers to achieve further stage progression.
Recovery processes and stages
If the stages of recovery were valid, they should be associated with higher levels of the processes that are thought to underpin recovery. Unlike past research, this study found that none of the Andresen model‟s recovery processes were related to its own stages of recovery.8 In contrast, all CHIME processes except “connectedness” improved across the stages of recovery. While this appears to be an ambivalent result, the CHIME processes have received more extensive validation than the processes that are specific to the Andresen model.7,16-19 As such, the association between CHIME and the stages of recovery still provides partial evidence of convergent validity.
The absence of a relationship between “connectedness” and the stages of recovery was unexpected. This is not consistent with the research on CHIME. It may be explained by the Andresen model‟s understanding of social support. According to the model, social support may function as a catalyst for the other drivers of recovery rather than acting as an independent recovery process.15 For instance, social support might help consumers feel more hopeful about their future and realize that life need not be dominated by cycles of illness and treatment. This newfound hope would then bring them from stage 1 to stage 2. As such, “connectedness” may foster the development of the other CHIME recovery processes without independently contributing to stage progression.
Moreover, the results suggest that “recovery-specific” measures might not be necessary for operationalizing constructs that are thought to underpin recovery. While advocates of the recovery movement might be skeptical of questionnaires created from an academic or clinical perspective, the application of psychometrically validated questionnaires does not intrinsically contradict the consumer-focused spirit. Instead, it may help to capture consumers‟ views about their own recovery in richer and more articulate ways.
The inter-stage differences in CHIME processes suggest that significant increments occur between stages where participants were „thinking‟ of recovery and „doing‟ something about it. While there was a gradual linear increase across the five stages as a whole, significant changes from stage 1 only occurred by stage 3 or 4. This mirrors the pattern of change for depression symptoms and psychosocial functioning. Thus, improvements in CHIME processes could be needed before consumers are ready to confront and address the impact of depression, thereby moving them up the stages and closer to recovery.
Limitations
This study was confined by its inclusion criteria. Participation was limited to individuals who were already seeking treatment but those at risk of suicide were excluded. Thus, the direst of patients were unlikely to be captured in this study. This may account for the lower number of participants in stage 1 (moratorium) compared to other stages. It also suggests that our representation of stage 1 on various measures may paint an overly optimistic picture of the nature of that stage. If so, the true extent of differences between stage 1 and the other stages may exceed what was found in this study.
severity of depressive symptoms may have served as a useful estimation of the participants‟ overall distress regardless of the presence of potential comorbidities.
A third limitation concerned the heterogeneity of the CHIME constructs. Each CHIME category contains a range of disparate construct beyond those measured here.13 This study focused on constructs that could produce quantitative results in the service of clinical utility. For instance, “meaning” was operationalized as the extent to which the participants engaged in personally valued activities. This can be promoted through evidence-based psychotherapies like Behavioral activation or acceptance and commitment therapy where systematic engagement in constructive activities is emphasized.35,36 Thus, the operationalized measures of the CHIME processes were intended to be theoretically coherent and clinically actionable.
Some may believe that the professional perspective of this article and others like it run contrary to the spirit of the recovery movement and the centrality of the consumer‟s perspective. This is a false dichotomy and a professional perspective can improve the conceptual precision and empirical validity of consumer recovery, thereby fostering the evidence base for recovery-oriented mental health services. This combination of expertise supports, rather than contradicts, the aspirations of the recovery movement.
Finally, this study‟s cross-sectional design limits its ability to clarify the direction of effect in a stage model that implies longitudinal change. Nevertheless, the findings provide quantitative evidence that can justify further research into causal relationships between the Andresen model and various indices of recovery.
CONCLUSION
In sum, this study found evidence of convergent validity for the Andresen model in relation to the CHIME recovery processes, psychosocial functioning, and depression symptoms. Changes in these variables tend to first occur between the stages where consumers are thinking about recovery and acting to achieve it. With further supporting research, the Andresen model may inform the development of recovery-oriented services.
Funding: No funding sources Conflict of interest: None declared
Ethical approval: The study was approved by the Institutional Ethics Committee
REFERENCES
1. Australian Health Ministers‟ Advisory Council. A National Framework for Recovery-Oriented Mental Health Services. Australia: Commonwealth of Australia, 2013. Available at: https://www.health.gov.au/internet/main/publishing.
nsf/Content/67D17065514CF8E8CA257C1D00017 A90/$File/recovgde.pdf. Accessed on 4 September 2017.
2. Mental Health Commission. A Vision for a Recovery Model in Irish Mental Health Services. Dublin: Mental Health Commission, 2005. Available at: http://www.mhcirl.ie/file/ discpapvforarecmod.pdf. Accessed 4 September 2017.
3. Mental Health Commission. Blueprint for Mental Health Services in New Zealand: How things need to be. Wellington: Mental Health Commission, 1998. Available at: http://www.moh.govt.nz/ notebook/nbbooks.nsf/0/0E6493ACAC236A394C2 5678D000BEC3C/%24file/Blueprint_for_mental_h ealth_services.pdf. Accessed 4 September 2017. 4. National Institute for Mental Health in England.
NIMHE Guiding Statement on Recovery. United Kingdom: Department of Health. Available at: http://www.workingtogetherforrecovery.co.uk/Docu ments/NIHMEReoveryStatement.pdf. Accessed on 4 September 2017.
5. Standing Committee on Social Affairs, Science, and Technology. Out of the Shadows at Last: Transforming mental health, mental illness, and addiction services in Canada. Canada: The Senate, 2006. Available at: http://publications.gc.ca/ collections/collection_2011/sen/yc17-0/YC17-0-391-2- 1-eng.pdf. Accessed on 4 September 2017 6. The Carter Center. The President‟s New Freedom
Commission on Mental Health: Transforming the Vision. Georgia: The Carter Center, 2003. Available at: https://www.cartercenter.org/documents/ 1701.pdf. Accessed 4 September 2017.
7. Slade M, Leamy M, Bacon F, Janosik M, Le Boutillier C, Williams C, et al. International differences in understanding recovery: Systematic review. Epidemiol Psychiatr Sc. 2012;21:353-64. 8. Andresen R, Caputi P, Oades LG. Do clinical
outcome measures assess consumer-defined recovery? Psychiatry Res. 2010;177:309-17. 9. Anthony B. Recovery from mental illness: The
guiding vision of the mental health service system in the 1990s. Psycho Rehab J. 1993;16(4):11-23. 10. Donelly M, Scott D, McGilloway S, O‟Neill T,
Williams J, Slade M. Patient outcomes: What are the best methods for measuring recovery from mental illness and capturing feedback from patients in order to inform service improvement?. United Kingdom: Bamford Implementation Rapid Review Scheme, 2011. Available at: http://www. publichealth.hscni.net/sites/default/files/Patient%20 Outcomes.pdf. Accessed 8 September 2017.
11. Andresen R, Oades L, Caputi P. The experience of recovery from schizophrenia: Towards an empirically validated stage model. Aust N Z J Psychiatry. 2003;37:586-94.
Isr J of Psychiatry and Relat Sci. 2010;47(3):213-21.
13. Leamy M, Bird V, Boutillier CL, Williams J, Slade M. Conceptual framework for personal recovery in mental health: Systematic review and narrative synthesis. Br J Psychiatry. 2011;199:445-54. 14. Copic V, Deane FP, Crowe TP, Oades LG. Hope,
meaning and responsibility across stages of recovery for individuals living with an enduring mental illness. Australian J Rehab Counselling. 2015;17(2):61-73.
15. Andresen R, Oades LG, Caputi P. Psychological Recovery: Beyond mental illness. West Sussex: John Wiley & Sons; 2011: 190.
16. Bird V, Leamy M, Tew J, Le Boutillier C, Williams J, Slade M. Fit for purpose? Validation of a conceptual framework for personal recovery with current mental health consumers. Aust N Z J Psychiatry. 2014;48(7):644-53.
17. Brijnath B. Applying the CHIME recovery framework in two culturally diverse Australian communities: Qualitative results. Int J Soc Psychiatry. 2015;61(7):660-7.
18. Petros R, Solomon P, Linz S, DeCesaris M, Hanrahan NP. Autovideography: The lived experience of recovery for adults with serious mental illness. Psychiatr Q. 2016;87:417-26. 19. Stuart SR, Tansey L, Quayle E. What we talk about
when we talk about recovery: A systematic review and best-fit framework synthesis of qualitative literature. J Ment Health. 2017;26 (3):291-304. 20. Roberts G, Wolfson P. The rediscovery of recovery:
open to all. B J Psych Adv. 2004;10:37-49.
21. World Health Organization & World Organization of Family Doctors. Integrating mental health into primary care: A global perspective, 2012. Available at: https://www.who.int/mental_health/resources/ mentalhealth_PHC_2008.pdf. Accessed on 16 July 2018.
22. Kroenke K, Spitzer R, Williams W. The PHQ-9: Validity of a brief depression severity measure. J Gen Intern Med. 2001;16:606-16.
23. Cameron IM, Crawford JR, Lawton K, Reid IC. Psychometric comparison of PHQ-9 and HADS for measuring depression in primary care. Br J Gen Pract. 2008;58:32-6.
24. Lowe B, Unutzer J, Callahan CM, Perkins AJ, Kroenke K. Monitoring depression treatment outcomes with the Patient Health Questionnaire-9. Med Care. 2004;42(12):1194-201.
25. Sung SC, Low CCH, Fung DSS, Chan YH. Screening for major and minor depression in a multiethnic sample of Asian primary care patients: A comparison of the nine-item Patient Health Questionnaire (PHQ-9) and the 16-item Quick Inventory of Depressive Symptomatology –
Self-Report (QIDS-SR16). Asia Pac Psychiatry. 2013;5:249-58.
26. American Psychiatric Association. Diagnostic and statistical manual of mental disorders. 4th ed, text revised. Washington, DC: American Psychiatric Association; 2000: 943.
27. Zimet GD, Dahlem NW, Zimet SG, Farley GK. The multidimensional scale of perceived social support. J Pers Assessment. 1998;52:30-41.
28. Hardan-Khalil K, Mayo AM. Psychometric properties of the multidimensional scale of perceived social support. Clin Nurse Spec. 2015;29(5):258-61.
29. Vaingankar JA, Abdin E, Chong SA. Exploratory and confirmatory factor analyses of the Multidimensional Scale of Perceived Social Support in patients with schizophrenia. Compr Psychiatry. 2012;53:286-91.
30. Snyder CR, Sympson SC, Ybasco FC, Borders TF, Babyak MA, Higgins RL. Development and validation of the state hope scale. J Pers Soc Psychol. 1996;70(2):321-35.
31. McKay EA, Seeman MV. A scale to measure the impact of a schizophrenic illness on an individual‟s self-concept. Arch Psychiatr Nurs. 1998;12(1):41-9. 32. Scheier MF, Wrosch C, Baum A, Cohen S, Martire
LM, Matthews KA, et al. The Life Engagement Test: Assessing purpose in life. J Behav Med. 2006;29(3):291-8.
33. Clarke J, Proudfoot J, Birch M, Whitton AE, Parker G, Manicavasgar V, et al. Effects of mental health self-efficacy on outcomes of a mobile phone and web intervention for mild-to-moderate depression, anxiety, and stress: Secondary analysis of a randomised controlled trial. BMC Psychiatry. 2014;14:272-82.
34. Cohen J. Statistical Power Analysis for the Behavioural Sciences. 2nd ed. New York: Routledge; 1988: 567.
35. Cassar J, Ross J, DahneJ, Ewer P, Teesson M, Hopko D, et al. Therapist tips for the brief behavioural activation therapy for depression – revised (BATD-R) treatment manual practical wisdom and clinical nuance. Clinical Psychologist. 2016;20:46-53.
36. Luoma JB, Hayes SC, Walser RD. Learning ACT: An acceptance and commitment therapy skills training manual for therapists. Oakland, CA: New Harbinger Publications; 2007: 304.