ISSN (e): 2250-3021, ISSN (p): 2278-8719
Vol. 08, Issue 6 (June. 2018), ||V (III) || PP 76-86
Experimental Observations of Ideal Binary Mask for CASA
based Systems
V.A.Mane
1, Dr. S. B. Patil
2 1Research Scholar, Department of Electronics and Telecommunication Engineering, Shivaji University,Kolhapur India
2Professor J.J.Magdum College of Engineering, Department of Electronics and Telecommunication Engineering, Shivaji University,Kolhapur India
Corresponding Author:V.A.Mane
Abstract:
Sound is a primary form of communication between human beings. By various ways the information is received from the outside world or to communicate with each other. Three most important sources of information are speech, images and written text. Speech not only conveys linguistic contents, but also communicates other useful information like the mood of the speaker, emotions attached with persons etc. the question is how to train the machines to understand the speaker, identifying the emotions attached with the persons etc. Human hearing system posses this property of suppressing the unwanted signal like voice or speech and concentrate on the wanted speech. To train the machines to understand the spoken speech it is necessary to train the machines to recognise the various sound sources and from them extracting sound of interest. In speech communication systems the quality and intelligibility of speech is most important for easy and accurate exchange of information. In realistic listening situations, speech is often contaminated by various types of background noise. The presence of background noise degrades the quality as well as intelligibility of speech. This degradation of speech by noise creates problems not only for just interpersonal communication but more serious problems in applications in which decision or control is made on the basis of speech signal. So, there is need to develop a new method for speech enhancement which will improve quality as well as intelligibility of the speech. This paper presents method of speech enhancement by using Ideal Binary Mask. This is a simple method for enhancing the speech with the objective to eliminate the additive noise present in speech signal and restore the speech signal to its original form with improved quality as well as intelligibility of speech. This paper will focus on Computational Auditory sense analysis to extract voice or speech of interest from interferenceKeywords
—
Ideal Binary Mask (IBM), Signal to Noise Ratio (SNR), Fast Fourier Transform (FFT), Inverse Fast Fourier Transform (IFFT). Computational Auditory Sense Analysis (CASA)--- --- Date of Submission: 01-06-2018 Date of acceptance: 16-06-2018 --- ---
I.
INTRODUCTION
Human can express their ideas, emotions, thoughts and knowledge with speech as a medium. It is two way communications to understand emotion and thoughts of the others. Speech communication plays important role in human life. The quality and intelligibility is needed for speech signal for easy and accurate exchange of Information. Intelligibility refers to the „understandability‟ of speech, which is helpful to understand the intention of the speaker and the response of the listener and also to communicate effectively in everyday situations. Speeches are corrupted by various noises. It is ability of human to suppress it. But for understanding to the machines it is necessary to filter the speech. Most of the time, speech is corrupted by different noises. Insertion of noises reduces the quality of speech due to these machines unable to identify it. Noises reduce the quality and intelligibility of speech signal. By properly Digital filtering or by using enhancement algorithms it is possible to increase the quality of speech, but unable to increase the speech intelligibility. In fact, in some cases improvement in quality might be lead to decrease in intelligibility [11]. A simple and effective method for speech enhancement is Ideal Binary Mask (IBM) method which has the potential for restoring quality and intelligibility of speech corrupted by different noises [1].
noise-dominated (ND) units [1]. A high increase in intelligibility can be obtained by applying the target binary mask to noisy speech.
This method of speech enhancement cancels the interference of noise and other speech from targeted speech using binary Ideal Mask technique and improves SNR of speech. This method helps to increase the intelligibility of the speech and to make the corrupted speech more pleasant to the listener. It is also useful to increase the efficiency of speech communication and to reduce listener fatigue. It helps to achieve hearing protection or increase listening comfort [6]. This proposed system can be useful for understanding human Auditory system and allows the machines extract speech or voice of interest as in CASA based systems.
II.
SPEECH ENHANCEMENT TECHNIQUE
The quality and intelligibility are the most important things of speech signal for easy and accurate exchange of information. The proposed method of speech enhancement by using Ideal Binary Mask helps to increase the quality as well as intelligibility of corrupted speech by noise. Most of the time speech is corrupted by noise. Noise is the unwanted part of the signal. Unwanted frequency signal is present in various degrees around whole environments.
The noisy speech signal is a combination of clean speech S (t) and background noise N (t) [1]as shown in fig.1.The noisy speech signal X(t) is described as,
X (t) = S (t) + N (t) Clean Noisy Speech speech X(t)Enhanced S(t)
Clean Speech Background
Noise N (t)
Fig1.Generation of noisy speech
A.
Sources of Noise–The background noise is added to the desired speech signal which is transmitted to the listener. Noise
can be characterized as any disturbance that tends to obscure a desired signal. It is usually caused by different sources. Based on the nature and properties of the noise sources, noise can be classified as Babble noise, Car Ignition Noise, Helicopter noise, Natural Noise, Kids Cheering Voice, Transportation Noise, Random noise, Tractor Noise.
1) Babble noise: Babble means to talk without a particular goal. When everyone is babbling without
paying attention to their neighbors, like the kid then the created voice is called as babble noise. Persons talking face to face are always surrounded by too many other people. Always background noise is present by talking of them continuously. It is considered as a multi-talker babble noise. Babble noise will be overlapping on the speech conversation. It is actually very challenging to recognize speech signals in presence of background babble noise for the normal listeners and hearing impaired persons. Clean speech signals are corrupted by background noise of multi-talker babble is shown in fig 4 and 5. Interfering of babble noise decreases speech intelligibility and quality.
2) Car Ignition Noise: At the time of some of the conversation it is possible that person may be out of his
home. The road traffic vehicles always generate different noises. Generally all the vehicles are travelled by specific types of engine. The car ignition voice, engine voice may also interrupt the speech. These engines generate noise in form spark plug, motors and burn fuel exhaust systems of large heavy vehicles. Here, the car ignition voice has taken as a noise in speech. Nature of car ignition noise added with clean speech is shown in fig.8 and 9. This noise degrades the speech quality and intelligibility.
3) Helicopter noise: In most of the big cities because of air ways also very huge amount of traffic is
generated. Engine noise of low flying air crafts, charted plain, helicopters, air force plain have added very cumbersome noise in speech signal. Helicopters generate substantial noise levels, especially at low frequency. However, the low frequency content masks the speech, the speech recognition and intelligibility reduces. Fig.6 and 7 shows the noisy speech which are affected by Helicopter noise.
4) Natural Noise: Natural noise is a noise produced by natural sources. This includes the sounds of any
living organism, from insect larvae to the largest living mammal on the planet, whales, and non-biological sources. Non-biological sound includes the effects of water by a stream or waves at the ocean, the effects of wind in the trees or grasses, and sound generated by the earth. Here, birds chirp with water flowing voice has
Speech Enhancement
taken as a natural noise which causes to degradation of speech quality and intelligibility. Fig 10 and 11 show the waveforms for noisy signal with natural noise.
5) Kids Cheering Voice: When some kids plays on the playground then other kids cheer for encouraging
those kids who playing on playground. This cheering voice creates large sound and act as a noise. The noise of this cheering has taken as a kids cheering voice for the experiment. This voice reduces quality and intelligibility of speech. Fig.12 and 13 represents the noisy signal with a kids cheering voice.
6) Transportation Noise: Fig 14 and 15 show the basic nature waveforms of noisy speech in
Transportation Noise. Generally road traffic vehicles are most important type of noise in the social life. Transportation noise relates to noise generated by road vehicles, aircrafts, trains, vessels. This transportation noise affects the communication signals. Transportation noise leads to degradation of the quality and intelligibility of speech signal.
7) Random noise: Random noise is usually electric or acoustic signal that consists of equal amounts of
all frequencies. Noise consist a large number of transient disturbances with a statistically random time distribution. This noise affects the speech signal when add in it as shown in fig 16 and 17. It reduces quality and intelligibility of speech signal and become hard to understand the particular speech signal.
8) Tractor Noise: Tractor is a vehicle having a powerful gasoline or diesel motor and usually large,
heavily treaded rear tires, used especially for pulling farm implements or machinery. The tractor creates a high level noise when it mixes with a speech as shown in fig 18 and 19. It reduces quality as well as intelligibility of speech.
This noisy environment reduces the speaker and listeners ability to communicate. There is need to remove all unwanted background noise and to improve the speech. Hence, speech enhancement described in a proposed work is necessary to avoid the degradation of speech quality and intelligibility. Speech enhancement is performed to reduce noise without distorting speech. To reduce the effect of different noises, speech enhancement using Ideal Binary Mask tries to remove as much noise as possible from the mixture of the target speech and the interfering sound, with the objective of increasing speech intelligibility and improving the speech quality of the processed signal.
III. SPEECH ENHANCEMENT BY USING IDEAL BINARY MASK
Fig2. Block Diagram Speech Enhancement Method by using Ideal Binary Mask.
A block diagram of the proposed work is shown in Fig.2. For processing a speech signal sampling rate of 8 kHz is considered. Variety of background noise has taken for creating the different input noisy speech for analysis. Hanning window is used for processing the frame of data. Total samples of noisy speech are divided into frame size of 32ms (8000*32*0.001= 256 samples) each by using Hanning windowing technique.
within an FFT based short-time spectral analysis modification- synthesis framework. Fast Fourier Transform (FFT) algorithm computes the Fourier transform of a sequence. Fourier analysis converts a signal from its original domain (often time) to a representation in the frequency domain. Here zero padding is used, if there is need to increase the length of signal for exactly division of speech signal into frames. The proposed Experiment is performed on the basis of signal to noise ratio (SNR) of each frame of noisy speech. The SNR is calculated for each frame.
The ideal binary mask is applied based on the basis of signal-to-noise ratio. Ideal Binary Mask 1 is aaplied if the the SNR is above set threshold and 0 when the SNR is lower than this threshold value. Once the mask obtained then for getting the processed signal, the ideal binary mask is multiplied with noisy speech. After this all process, we get processed speech signal. Due to this binary masking when every frame is compared and estimated it gives sharper output and fine clean signal [10]. Inverse FFT of processed speech signal is taken to convert it into the time domain signal. At the output of inverse FFT, algorithm gives the processed signal in the form of frames with time domain. For getting continuous output signal, overlap and add method is used here. This method discards the zero padding which had previously added to signal to increase its length. After all this procedure the algorithm gives the continuous and enhanced speech signal.
IV. ALGORITHM FOR SPEECH ENHANCEMENT BY USING IDEAL BINARY MASK
Fig3. Flow Chart of Speech enhancement method using Ideal Binary Mask
1) Noisy Speech: In this step clean speech is added with background noise and applied as input. Noisy
speech is a combination of pure clean speech and background noise. The presence of background noise in speech significantly reduces the quality and intelligibility of speech. The background noise may be of multi-talker babble noise, speech in speech noise, car ignition noise, environmental noise, kids cheering voice, helicopter noise, traffic jam noise, random noise, tractor noise, and factory noise. Noisy speech samples at different background noises for testing of speech enhancement method by using Ideal Binary Mask are considered.
2) Making a Frame: Noisy speech is sampled with 8KHz frequency. Speech or audio signal contains
corresponds to the time of each sample. The input signal is a very long data sequence. The noisy speech signal is segmented into small fixed size data frames before further process. Vector to frame conversion splits signal into overlapped frames using indexing and it creates a matrix of input vector. The noisy speech signal is divided into frames of 32ms with frame shift of 4ms. The created matrix consist rows of segments of length 256, taken at every 32 samples along the input vector and windowed using the Hanning window.
Speech processing to convert vector into frames is done by taking short windows and processing them. The short window of signal like this is called frame. Here the Hanning window is an optional analysis window function to be applied to each frame. Hanning window coefficients,
W (n) =0.5[1-cos (2π n/N)] , 0 ≤ n ≤ N Where, the window length is L = N+1.
A long signal of speech is multiplied with a Hanning window function of finite length and gives finite length version of the original signal. For making the exact division of signal samples into frames, the conversion performs zero padding. Zero padding is a method of adding the zeroes in the signal to increase its length; it will not give any additional information about the signal.
3) Fast Fourier Transform: Fast Fourier Transform is a highly efficient algorithm for transformation of
signal from time domain into frequency domain. The speech is first windowed for FFT analysis. FFT process the frames one after another and processed frames are placed systematically to form output signal.
A fast Fourier transform (FFT) algorithm computes the Fourier transform of a noisy speech signal. FFT converts a signal from its original domain (often time or space) to a frequency domain (spectrum). The functions Y = fft(x) implements the transform function for vector X of length N by
𝑋 𝑘 = 𝛴𝑗 =1𝑁 𝑥 𝑗 𝑊𝑁
𝑗 −1 𝑘−1
where, 𝑊𝑁= 𝑒 −2𝜋𝑖 𝑁.
4) Ideal Binary Mask: Ideal binary mask (IBM) identifies speech dominated and noise dominated units,
a binary mask is computed and applied to the noisy input spectrum to get the noise-suppressed spectrum. The ideal binary mask is returned in MASK, while the true instantaneous spectral signal-to-noise ratio is returned in SNR. The ideal binary mask is computed from an oracle (true) signal-to-noise ratio (SNR) by thresholding with local SNR criterion specified in LC. The units with local SNR higher than the threshold are defined as target-dominated units, while others as masker-target-dominated unit. Speech target-dominated unit labeled as 1 and noise dominated unit labeled as 0. The noisy speech signal and estimated binary mask is combined to produce the enhanced speech signal.
This binary mask method simply keeps the speech dominated (SD) units while zeroing out the noise-dominated (ND) units of noisy speech. The synthesized enhanced speech is returned in Y.A high increase in intelligibility can be obtained by applying the Ideal binary mask to noisy speech. Accurate estimation of the ideal binary mask is important for the algorithms aimed at improving speech intelligibility.
5) Inverse Fast Fourier Transform: An inverse Fourier transform converts the frequency domain
components back into the original time domain signal. After this conversion the algorithm provides enhanced output speech signal in time domain.
The function y = ifft(X) implement inverse transform given for vectors of length N by,
𝑥 𝑗 = 1 𝑁 𝛴𝑗 =1
𝑁 𝑋 𝑘 𝑊 𝑁
− 𝑗 −1 𝑘−1
where, 𝑊𝑁= 𝑒 −2𝜋𝑖 𝑁
y = ifft(X) returns the inverse discrete Fourier transform (DFT) of vector X, computed with a fast Fourier transform (FFT) algorithm.
6) Frame to Vector conversion: The frame to vector conversion is important to convert frames of signal
V.
RESULTS
A. Results for Babble noiseBabble noise creates serious problem to recognize a particular clean speech. Babble noise will be overlapping on the speech conversation and reduces intelligibility. Fig 4 and 5 shows the results for different clean speech which are affected by babble noise and their SNRs for different signals.
1. Results for speaking ‘one’ clean speech with babble noise
Fig4. Results for 1st clean speech with babble noise
2. Results for speaking ‘three’ clean speech with babble noise
Fig5. Results for 2nd clean speech with babble noise
B. Results for Helicopter noise
Fig 6 and 7 shows the results for different clean speech which are affected by helicopter noise and SNRs for different signals.
0 0.2 0.4 0.6 0.8
-0.4 -0.2 0 0.2 0.4
Waveform: clean SegSNR=35.00
Time (s) A m p lit u d e
Spectrogram: clean SegSNR=35.00
Time (s) F re q u e n c y ( k H z )
0 0.5 1 1.5
0 1 2 3 4
0 0.2 0.4 0.6 0.8
-0.4 -0.2 0 0.2 0.4
Waveform: noisy SegSNR=-4.53
Time (s) A m p lit u d e
Spectrogram: noisy SegSNR=-4.53
Time (s) F re q u e n c y ( k H z )
0 0.5 1 1.5
0 1 2 3 4
0 0.2 0.4 0.6 0.8
-1 0 1 2
Waveform: processed SegSNR=11.39
Time (s) A m p lit u d e
Spectrogram: processed SegSNR=11.39
Time (s) F re q u e n c y ( k H z )
0 0.5 1 1.5
0 1 2 3 4
0 0.2 0.4 0.6 0.8
-0.4 -0.2 0 0.2 0.4
Waveform: clean SegSNR=35.00
Time (s) A m p lit u d e
Spectrogram: clean SegSNR=35.00
Time (s) F re q u e n c y ( k H z )
0 0.5 1 1.5
0 1 2 3 4
0 0.2 0.4 0.6 0.8
-0.4 -0.2 0 0.2 0.4
Waveform: noisy SegSNR=-4.96
Time (s) A m p lit u d e
Spectrogram: noisy SegSNR=-4.96
Time (s) F re q u e n c y ( k H z )
0 0.5 1 1.5
0 1 2 3 4
0 0.2 0.4 0.6 0.8
-1 -0.5 0 0.5
Waveform: processed SegSNR=10.55
Time (s) A m p lit u d e
Spectrogram: processed SegSNR=10.55
Time (s) F re q u e n c y ( k H z )
0 0.5 1 1.5
1. Results for speaking ‘one’ clean speech with Helicopter noise
Fig6. Results for 1st clean speech with Helicopter Noise
2. Results for speaking ‘three’ clean speech with Helicopter noise
Fig7. Results for 2nd clean speech with Helicopter noise
C. Car ignition noise
This is also one of the types of noise which degrades the speech quality and intelligibility. Here, car ignition noise has taken for experiment test. Fig 8 and 9 shows the results for different clean speech which are affected by car ignition noise and SNRs for different signals.
1. Results for speaking ‘one’ clean speech with Car ignition noise –
Fig8. Results for 1stClean speech with Car ignition noise
0 0.2 0.4 0.6 0.8 -0.4
-0.2 0 0.2 0.4
Waveform: clean SegSNR=35.00
Time (s) A m p lit u d e
Spectrogram: clean SegSNR=35.00
Time (s) F re q u e n c y ( k H z )
0 0.5 1 1.5
0 1 2 3 4
0 0.2 0.4 0.6 0.8 -0.4
-0.2 0 0.2 0.4
Waveform: noisy SegSNR=-4.51
Time (s) A m p lit u d e
Spectrogram: noisy SegSNR=-4.51
Time (s) F re q u e n c y ( k H z )
0 0.5 1 1.5
0 1 2 3 4
0 0.2 0.4 0.6 0.8 -0.4
-0.2 0 0.2 0.4
Waveform: processed SegSNR=7.02
Time (s) A m p lit u d e
Spectrogram: processed SegSNR=7.02
Time (s) F re q u e n c y ( k H z )
0 0.5 1 1.5
0 1 2 3 4
0 0.2 0.4 0.6 0.8 -0.4
-0.2 0 0.2 0.4
Waveform: clean SegSNR=35.00
Time (s) A m p lit u d e
Spectrogram: clean SegSNR=35.00
Time (s) F re q u e n c y ( k H z )
0 0.5 1 1.5
0 1 2 3 4
0 0.2 0.4 0.6 0.8 -0.4
-0.2 0 0.2 0.4
Waveform: noisy SegSNR=-5.09
Time (s) A m p lit u d e
Spectrogram: noisy SegSNR=-5.09
Time (s) F re q u e n c y ( k H z )
0 0.5 1 1.5
0 1 2 3 4
0 0.2 0.4 0.6 0.8 -1
0 1 2
Waveform: processed SegSNR=6.85
Time (s) A m p lit u d e
Spectrogram: processed SegSNR=6.85
Time (s) F re q u e n c y ( k H z )
0 0.5 1 1.5
0 1 2 3 4
0 0.2 0.4 0.6 0.8 -0.4
-0.2 0 0.2 0.4
Waveform: clean SegSNR=35.00
Time (s) A m p lit u d e
Spectrogram: clean SegSNR=35.00
Time (s) F re q u e n c y ( k H z )
0 0.5 1 1.5
0 1 2 3 4
0 0.2 0.4 0.6 0.8 -0.4
-0.2 0 0.2 0.4
Waveform: noisy SegSNR=-4.13
Time (s) A m p lit u d e
Spectrogram: noisy SegSNR=-4.13
Time (s) F re q u e n c y ( k H z )
0 0.5 1 1.5
0 1 2 3 4
0 0.2 0.4 0.6 0.8 -0.4
-0.2 0 0.2 0.4
Waveform: processed SegSNR=6.63
Time (s) A m p lit u d e
Spectrogram: processed SegSNR=6.63
Time (s) F re q u e n c y ( k H z )
0 0.5 1 1.5
2. Results for speaking ‘three’ clean speech with Car ignition noise
Fig9.Results for 2nd clean speech with Car ignition noise
D. Natural noise
Fig 10 and 11 Show the results for different clean speech which are affected by Natural noise and SNRs for different signals.
1. Results for speaking ‘one’ clean speech with Natural noise
Fig10. Results for 1st clean speech with Natural noise
2. Results for speaking ‘three’ clean speech with Natural noise
Fig11.Results for 2nd clean speech with Natural noise
0 0.2 0.4 0.6 0.8 -0.4
-0.2 0 0.2 0.4
Waveform: clean SegSNR=35.00
Time (s) A m p lit u d e
Spectrogram: clean SegSNR=35.00
Time (s) F re q u e n c y ( k H z )
0 0.5 1 1.5
0 1 2 3 4
0 0.2 0.4 0.6 0.8 -0.4
-0.2 0 0.2 0.4
Waveform: noisy SegSNR=-5.55
Time (s) A m p lit u d e
Spectrogram: noisy SegSNR=-5.55
Time (s) F re q u e n c y ( k H z )
0 0.5 1 1.5
0 1 2 3 4
0 0.2 0.4 0.6 0.8 -0.4
-0.2 0 0.2 0.4
Waveform: processed SegSNR=4.51
Time (s) A m p lit u d e
Spectrogram: processed SegSNR=4.51
Time (s) F re q u e n c y ( k H z )
0 0.5 1 1.5
0 1 2 3 4
0 0.2 0.4 0.6 0.8 -0.4
-0.2 0 0.2 0.4
Waveform: clean SegSNR=35.00
Time (s) A m p lit u d e
Spectrogram: clean SegSNR=35.00
Time (s) F re q u e n c y ( k H z )
0 0.5 1 1.5
0 1 2 3 4
0 0.2 0.4 0.6 0.8 -0.5
0 0.5
Waveform: noisy SegSNR=-4.03
Time (s) A m p lit u d e
Spectrogram: noisy SegSNR=-4.03
Time (s) F re q u e n c y ( k H z )
0 0.5 1 1.5
0 1 2 3 4
0 0.2 0.4 0.6 0.8 -0.5
0 0.5 1
Waveform: processed SegSNR=12.23
Time (s) A m p lit u d e
Spectrogram: processed SegSNR=12.23
Time (s) F re q u e n c y ( k H z )
0 0.5 1 1.5
0 1 2 3 4
0 0.2 0.4 0.6 0.8 -0.4
-0.2 0 0.2 0.4
Waveform: clean SegSNR=35.00
Time (s) A m p lit u d e
Spectrogram: clean SegSNR=35.00
Time (s) F re q u e n c y ( k H z )
0 0.5 1 1.5
0 1 2 3 4
0 0.2 0.4 0.6 0.8 -0.4
-0.2 0 0.2 0.4
Waveform: noisy SegSNR=-4.44
Time (s) A m p lit u d e
Spectrogram: noisy SegSNR=-4.44
Time (s) F re q u e n c y ( k H z )
0 0.5 1 1.5
0 1 2 3 4
0 0.2 0.4 0.6 0.8 -0.4
-0.2 0 0.2 0.4
Waveform: processed SegSNR=8.41
Time (s) A m p lit u d e
Spectrogram: processed SegSNR=8.41
Time (s) F re q u e n c y ( k H z )
0 0.5 1 1.5
E. Kids cheering voice
Fig 12 and 13 show the results for different clean speech which are affected by kids cheering voice and SNRs for different signals.
1. Results for speaking ‘one’ clean speech with Kids cheering voice
Fig12. Results for 1st clean speech with Kids cheering voice
2. Results for speaking ‘three’ clean speech Kids cheering voice
Fig13. Results for 2nd clean speech with Kids cheering voice
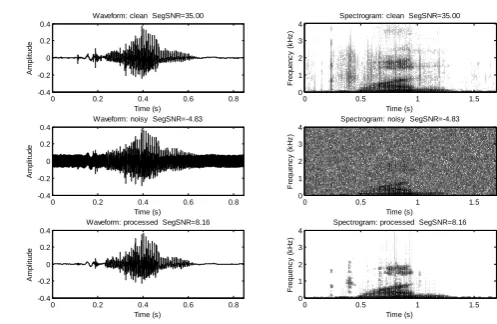
F. Random noise
This noise affects the speech signal when add in it. It reduces quality and intelligibility of speech signal and become hard to understand the particular speech signal. Fig 16 and 17Show the results for different clean speech which are affected by Random noise and SNRs for different signals.
1. Results for speaking ‘one’ clean speech with Random noise
Fig16. Results for 1st clean speech with Random noise
0 0.2 0.4 0.6 0.8 -0.4
-0.2 0 0.2 0.4
Waveform: clean SegSNR=35.00
Time (s) A m p lit u d e
Spectrogram: clean SegSNR=35.00
Time (s) F re q u e n c y ( k H z )
0 0.5 1 1.5
0 1 2 3 4
0 0.2 0.4 0.6 0.8 -0.4
-0.2 0 0.2 0.4
Waveform: noisy SegSNR=-4.81
Time (s) A m p lit u d e
Spectrogram: noisy SegSNR=-4.81
Time (s) F re q u e n c y ( k H z )
0 0.5 1 1.5
0 1 2 3 4
0 0.2 0.4 0.6 0.8 -1
-0.5 0 0.5
Waveform: processed SegSNR=9.86
Time (s) A m p lit u d e
Spectrogram: processed SegSNR=9.86
Time (s) F re q u e n c y ( k H z )
0 0.5 1 1.5
0 1 2 3 4
0 0.2 0.4 0.6 0.8 -0.4
-0.2 0 0.2 0.4
Waveform: clean SegSNR=35.00
Time (s) A m p lit u d e
Spectrogram: clean SegSNR=35.00
Time (s) F re q u e n c y ( k H z )
0 0.5 1 1.5
0 1 2 3 4
0 0.2 0.4 0.6 0.8 -0.4
-0.2 0 0.2 0.4
Waveform: noisy SegSNR=-5.18
Time (s) A m p lit u d e
Spectrogram: noisy SegSNR=-5.18
Time (s) F re q u e n c y ( k H z )
0 0.5 1 1.5
0 1 2 3 4
0 0.2 0.4 0.6 0.8 -0.4
-0.2 0 0.2 0.4
Waveform: processed SegSNR=6.97
Time (s) A m p lit u d e
Spectrogram: processed SegSNR=6.97
Time (s) F re q u e n c y ( k H z )
0 0.5 1 1.5
0 1 2 3 4
0 0.2 0.4 0.6 0.8 -0.4
-0.2 0 0.2 0.4
Waveform: clean SegSNR=35.00
Time (s) A m p lit u d e
Spectrogram: clean SegSNR=35.00
Time (s) F re q u e n c y ( k H z )
0 0.5 1 1.5
0 1 2 3 4
0 0.2 0.4 0.6 0.8 -0.4
-0.2 0 0.2 0.4
Waveform: noisy SegSNR=-4.83
Time (s) A m p lit u d e
Spectrogram: noisy SegSNR=-4.83
Time (s) F re q u e n c y ( k H z )
0 0.5 1 1.5
0 1 2 3 4
0 0.2 0.4 0.6 0.8 -0.4
-0.2 0 0.2 0.4
Waveform: processed SegSNR=8.16
Time (s) A m p lit u d e
Spectrogram: processed SegSNR=8.16
Time (s) F re q u e n c y ( k H z )
0 0.5 1 1.5
2. Results for speaking ‘three’ clean speech with Random noise
Fig17. Results for 2nd clean speech with Random noise
Table1.Shows the SNRs for different clean speech, noisy and processed speech which are used in analysis of algorithm. On the basis of these SNRs, we can compare the quality of clean speech and speech after processing.
Table1. SNRs for different signals
VI. CONCLUSION
Results presented in a table are actual results obtained through simulation of algorithm on various speech signals. This method improves the quality as well as intelligibility of speech. Performance is assessed on the basis of speech quality and intelligibility. SNR of clean, noisy and enhanced speech is measured to determine the quality of processed speech. Intelligibility is difficult to measure by any mathematical algorithm..
On the basis of this analysis of SNR and listening test:
The proposed method is able to eliminate the additive noise present in speech signal and restore the speech signal to its original form but with reduced SNR as compared with original signal
Speech enhancement method in proposed method attenuates the additive background noise without introducing speech distortion.
The proposed speech enhancement method is suitable to increase the recognition accuracy of speaker under real life noise conditions.
Proposed method can be used in CASA based systems which can do the mimicry of Human Auditory system.
REFERENCES
[1]. Raphael Koning, NileshMadhu, and Jan Wouters,” Ideal Time–Frequency Masking Algorithms Lead to
Different Speech Intelligibility and Quality in Normal-Hearing and Cochlear Implant
Listeners”,IEEEtransactionson biomedical engineering,vol. 62, no. 1, January 2015.
0 0.2 0.4 0.6 0.8 -0.4
-0.2 0 0.2 0.4
Waveform: clean SegSNR=35.00
Time (s)
A
m
p
lit
u
d
e
Spectrogram: clean SegSNR=35.00
Time (s)
F
re
q
u
e
n
c
y
(
k
H
z
)
0 0.5 1 1.5
0 1 2 3 4
0 0.2 0.4 0.6 0.8 -0.4
-0.2 0 0.2 0.4
Waveform: noisy SegSNR=-5.30
Time (s)
A
m
p
lit
u
d
e
Spectrogram: noisy SegSNR=-5.30
Time (s)
F
re
q
u
e
n
c
y
(
k
H
z
)
0 0.5 1 1.5
0 1 2 3 4
0 0.2 0.4 0.6 0.8 -0.4
-0.2 0 0.2 0.4
Waveform: processed SegSNR=6.26
Time (s)
A
m
p
lit
u
d
e
Spectrogram: processed SegSNR=6.26
Time (s)
F
re
q
u
e
n
c
y
(
k
H
z
)
0 0.5 1 1.5
0 1 2 3 4
Sr. No.
Type of clean speech
Type of noise SNR(dB)
Clean Speech
Noisy speech
Processed speech
1 1st Clean
Speech
Babble Noise 35 -4.53 11.39
Helicopter noise 35 -4.51 7.02
Car ignition noise 35 -4.13 6.63
Natural noise 36 -4.03 12.23
Kids cheering voice 35 -4.81 9.86
Random noise 35 -4.83 8.16
2. 2nd Clean
Speech
Babble Noise 35 -4.96 10.55
Helicopter noise 35 -5.09 6.85
Car ignition noise 35 -5.55 4.51
Natural noise 35 -4.44 8.41
Kids cheering voice 35 -5.18 6.97
[2]. NimaYousefian and Philipos C. Loizou, “A Dual-Microphone Speech Enhancement Algorithm Based on the Coherence Function”, IEEE transactions on audio, speech, and language processing, vol. 20, no. 2, February 2012.
[3]. DeLiang Land Guy J. Brown,”Separation of Speech from Interfering Sounds Based on Oscillatory
Correlation”, IEEE transactions on neural networks, vol. 10, no. 3, May 1999.
[4]. Dionysis E. Tsoukalas, John N. Mourjopoulosand George Kokkinakis,” Speech Enhancement Based on
Audible Noise Suppression”, IEEE transactions on speech and audio processing, vol. 5, no. 6, November 1997.
[5]. Steven F. Ball,”Suppression of Acoustic Noise in Speech Using Spectral Subtraction”,IEEE transactions
on acoustics, speech, and signal processing, vol. assp-27, no. 2, April 1979.
[6]. Philipos C. Loizou and Gibak Kim,” Reasons why Current Speech-Enhancement Algorithms do not
Improve Speech Intelligibility and Suggested Solutions”, IEEE transactions on audio, speech, and language processing, vol. 19, no. 1, January 2011.
[7]. Yariv Ephraim and David Malah,”Speech Enhancement Using a- Minimum Mean- Square Error
Short-Time Spectral Amplitude Estimator” IEEE transactions on acoustics, speech, and signal processing, vol. assp-32, no. 6, December 1984
[8]. Arun Narayananand DeLiang Wang,” A CASA-Based System for Long-Term SNR Estimation”, IEEE
transactions on audio, speech, and language processing, vol. 20, no. 9, November 2012.
[9]. Bastian Sauert and Peter Vary, “Near End Listening Enhancement: Speech Intelligibility Improvement in
Noisy Environments”, Proceeding of International Conference on Acoustics, Speech, and Signal Processing (ICASSP), pp. 493–496, May 2006.
[10]. Dr. Madhuri. A. Joshi and Priyanka S. Vispute, ” Factors Affecting on Improvement of
Intelligibility in Speech Enhancement”, 3rd International Conference on Electrical, Electronics, Engineering Trends, Communication, Optimization and Sciences (EEECOS)-2015.
[11]. Gibak Kim and Philipos C. Loizou,”Improving Speech Intelligibility in Noise Using
Environment-Optimized Algorithms”, IEEE transactions on audio, speech, and language processing, vol. 18, no. 8, November 2010.
[12]. D. L.Wang and G. J. Brown, Eds. Hoboken, NJ:Wiley,”Computational Auditory Scene Analysis:
Principles, Algorithms and Applications”, IEEE Press, 2006.