ARTICLE
Predicting Language at 2 Years of Age: A Prospective
Community Study
Sheena Reilly, PhDa,b,c, Melissa Wake, MDc,d,e, Edith L. Bavin, PhDf, Margot Prior, PhDg, Joanne Williams, PhDc,d, Lesley Bretherton, PhDh, Patricia Eadie, PhDa,c, Yin Barrett, BComm/BScc, Obioha C. Ukoumunne, PhDe,i
aSchools of Human Communication Sciences andfPsychological Science, La Trobe University, Melbourne, Victoria, Australia;bSpeech Pathology Department,dCentre for
Community Child Health, andhPsychology Department, Royal Children’s Hospital, Parkville, Victoria, Australia;iClinical Epidemiology and Biostatistics Unit, cMurdoch Childrens Research Institute, Parkville, Victoria, Australia;eDepartment of Paediatrics andgSchool of Behavioural Sciences, University of Melbourne,
Melbourne, Victoria, Australia
The authors have indicated they have no financial relationships relevant to this article to disclose.
ABSTRACT
OBJECTIVE.This article responds to evidence gaps regarding language impairment identified by the US Preventive Services Task Force in 2006. We examine the contributions of putative child, family, and environmental risk factors to language outcomes at 24 months of age.
METHODS.A community-ascertained sample of 1720 infants who were recruited at 8 months of age were followed at ages 12 and 24 months in a prospective, longitudinal study in metropolitan Melbourne, Australia. Outcomes at 24 months were parent-reported infant communication (Communication and Symbolic Behavior Scales and MacArthur-Bates Communicative Development Inventories vocabulary production score). Putative risk factors were gender, preterm birth, birth weight, multiple birth, birth order, socioeconomic status, maternal mental health, maternal vocabulary and education, maternal age at birth of child, non–English-speaking background, and family history of speech-language difficulties. Linear regression models were fitted to total standardized Communication and Symbolic Behavior Scales and Communicative Development Inventories vocabulary production scores; a logistic regression model was fitted to late-talking status at 24 months.
RESULTS.The regression models accounted for 4.3% and 7.0% of the variation in the 24-month Communication and Symbolic Behavior Scales and Communicative Development Inventories scores, respectively. Male gender and family history were strongly associated with poorer outcomes on both instruments. Lower Com-munication and Symbolic Behavior Scales scores were also associated with lower maternal vocabulary and older maternal age. Lower vocabulary production scores were associated with birth order and non–English-speaking background. When the 12-month Communication and Symbolic Behavior Scales Total score was added as a covariate in the linear regression of 24-month Communication and Symbolic Behavior Scales Total score, it was by far the strongest predictor.
CONCLUSIONS.These early risk factors explained no more than 7% of the variation in language at 24 months. They seem unlikely to be helpful in screening for early language delay.
www.pediatrics.org/cgi/doi/10.1542/ peds.2007-0045
doi:10.1542/peds.2007-0045
Drs Reilly, Bavin, and Prior initiated the project; Drs Reilly, Wake, and Eadie and Ms Barrett managed the project, including data collection and analysis; Dr. Ukoumunne provided statistical advice and conducted the analyses; Dr Reilly wrote the article, and all authors contributed to planning, reviewing, and editing the manuscript; and Dr Reilly had full access to all of the data in the study, takes responsibility for the integrity of the data and the accuracy of the data analysis, and is the guarantor.
Key Words
language development, communication development, longitudinal study, risk factors
Abbreviations
USPSTF—US Preventive Services Task Force
SES—socioeconomic status ELVS—Early Language in Victoria Study LGA—local government area SEIFA—Socio-Economic Indexes for Areas CSBS—Communication and Symbolic Behaviour Scales
CDI—MacArthur-Bates Communicative Development Inventories
CI— confidence interval Accepted for publication May 9, 2007
Address correspondence to Sheena Reilly, PhD, Speech Pathology Department, Royal Children’s Hospital, Flemington Road, Parkville, Victoria 3086, Australia. E-mail: [email protected]
P
RESCHOOL CHILDREN WITH expressive and/or recep-tive language impairment are at high risk for subse-quent difficulties with language and language-related tasks in their later school careers that, for many, persistinto adulthood.1,2 Much earlier identification would be
ideal to increase the likelihood of altering outcomes by the preschool years.
Unfortunately, the very limited understanding of the natural history of language delay from infancy makes early identification difficult. Wide ranges in the preva-lence of language delay are reported, with high rates of resolution during the early years. At 8 to 10 months of
age,⬃30% of infants have been reported to have early
delay in communication skills, which persists in 50% to
80% of these children at 2 years of age.3,4 Expressive
language delay, or “late talking,” reported to affect
⬃15% of 2-year-olds,5also resolves in 40% to 60% of
children by 3 years and 70% by 4 years of age.6It is not
possible to identify reliably which trajectory (recovery or persistence) individual or groups of infants and toddlers who are at risk for early delay might follow.
The design of effective preventive or treatment pro-grams that target the right children (ie, those who will go on to have lasting language impairment) must be based on an understanding of the natural history of language delay and of the early features that most accurately identify these children. Although the early markers of possible later language impairment seem to have
reason-able sensitivity, their specificity is uniformly low.4
In 2006, Nelson et al7published a systematic evidence
review for the US Preventive Services Task Force (USP-STF) on screening for speech and language delay in preschool children. The review sought to appraise the strengths and weaknesses of current evidence regarding the effectiveness of screening and interventions for speech and language delay. Four of the 8 key questions addressed in the review concerned screening for early
speech and language delay.7
No studies that directly addressed whether screening for speech and language delay results in improved speech, language, or other outcomes were identified; however, 2 sets of risk factors that might improve the accuracy of screening were identified. The first set (fac-tors consistently reported in the literature to identify children at risk) included family history of speech and language delay, male gender, parent educational levels, and perinatal factors. The second set (less consistently reported) included childhood illnesses, later birth order, family size, older parents or younger mother at birth, lower socioeconomic status (SES), and minority race. The task force concluded that the role of these risk factors in screening was unclear and that a list of risk factors had not been developed or tested for selective
screening for speech and language delay.7
Only 48–11of the 16 studies reviewed by the USPSTF7
considered risk factors in children who were ⱕ24
months of age. Of these 4, 1 focused solely on
stutter-ing,9 and the remaining 3 differed markedly in the
speech and language domains studied and in the deri-vation and composition of the samples. Surprisingly, none investigated the contribution of gender, SES, birth order, perinatal factors, or parental education. Family history was explored in 2 studies, with an association
with language delay found in 111 but not the other.8
There are inherent problems in interpreting published
data on risk factors.4,7These include the variety of study
designs, the heterogeneity of the populations studied, variable inclusion and exclusion criteria, and nonparable outcomes, which makes interpretation and com-parison extremely difficult. For example, studies vary in
whether they examine the risk for delay for vocabulary12
speech,13or language14–16or are still broader and include
stuttering9or delays in learning.12,14–16Not surprisingly, 1
of the main recommendations from the task force review was the need for prospective research to identify and quantify the predictive strength of risk factors in screen-ing for speech and language delay. The study reported here addresses this recommendation.
This article focuses on quantifying the contributions made to language outcomes at 24 months of age by the early risk factors identified by the task force as likely to influence language development. It builds on a previous
article17 from the same longitudinal study that found
that although a range of child, family, and
environmen-tal factors explained a small amount of variation (⬍6%)
in communication skills at 12 months, the strongest predictor (accounting for 37% of the variation) was communication development at 8 months of age. The authors discussed 2 possible explanations for the find-ings. First, early communication development may have a substantial biological component, given that so little of the variability was explained by the combination of
fac-tors explored.17In support of this, recent neuroimaging
studies18have found decreased white matter volumes in
the motor and language areas of children with develop-mental language disorder compared with typically de-veloping control subjects. Others have hypothesized that a common infrastructure that is available to children equips them to acquire language during early
child-hood.19Second, they speculated that as language
acqui-sition stabilized across the first few years of life, it might become possible to elucidate a combination of early communication skills and biological and environmental factors that more reliably predict later language difficul-ties.17
METHODS
Sampling and Participants
The longitudinal Early Language in Victoria Study (ELVS) was established in 2002. Sampling methods have
of infants who were aged 7.5 to 10.0 months were recruited from 6 of 31 local government areas (LGAs) in metropolitan Melbourne (population 3.8 million) in the state of Victoria, Australia. These LGAs were spread geo-graphically across the spectrum of disadvantage–advan-tage, having been sampled by stratifying the 31 LGAs into 3 tiers according to the Australian census-based Socio-Economic Indexes for Areas (SEIFA) Index for Relative Socio-Economic Disadvantage (representing at-tributes such as low income, low educational
attain-ment, and high unemployment),20and then selecting 2
noncontiguous LGAs from each tier.
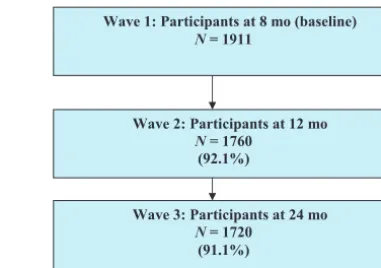
Between September 2003 and April 2004, potential study participants were recruited in 1 of 3 ways: via the Maternal and Child Health nurses; via universally avail-able hearing screening sessions, offered at ages 7 to 9 months; or as a result of publicity. Infants were excluded when they had developmental delay (eg, Down syn-drome), cerebral palsy, or other serious intellectual or physical disability or when their parents did not speak and understand English. Participation was maximized by ensuring that questionnaires were written at no more than a year 6 reading level. Data were collected on a broad range of child, family, and environmental factors at 8, 12, and 24 months of age (data collection from 3 through 7 years is ongoing from 2005 to 2010). This article draws on communication and language data col-lected at ages 12 and 24 months and demographic, fam-ily, and environmental information collected at ages 8 and 12 months. Figure 1 describes the flow of children from recruitment through 24 months of age, with those still participating at 24 months composing the sample on which these analyses were based.
The ELVS was approved by the ethics committees of the Royal Children’s Hospital (Melbourne) and La Trobe University, and all parents provided written, informed consent.
Outcome Measures
Parents completed the Communication and Symbolic
Behavior Scales (CSBS) Infant-Toddler Checklist21 at
both 12 and 24 months. Standardized total scores mative mean: 100; SD: 15) and 3 composite scores (nor-mative means: 10; SD: 3) for the domains of social, speech, and symbolic skills were calculated according to the manual. The composite domains broadly relate to infants’ prelinguistic, linguistic, and cognitive abilities, respectively, each of which has been demonstrated to
relate to later expressive language development.21
Par-ents also completed the Words and Sentences version of the MacArthur-Bates Communicative Development
In-ventory (CDI) for infants at 24 months.22To
accommo-date differences between American and Australian us-age, we received permission (from the authors) to substitute 24 vocabulary items on the Words and Sen-tences inventory (eg, “footpath” for “sidewalk”). Only
the expressive vocabulary production scores were used in our analyses. Raw (quantitative) scores were calcu-lated for the CDI. As is usual practice with the CDI,
children who were at⬍10th centile for vocabulary
pro-duction were identified as late talkers.22
Putative Risk Factors
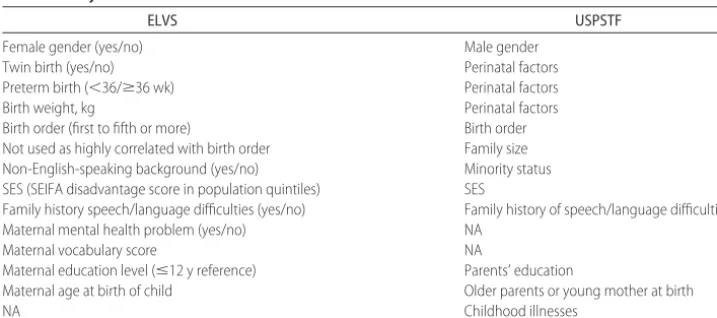
All putative risk factors identified by the USPSTF were considered, with the exception of child illnesses (not collected by the ELVS) and family size (given its high correlation with birth order during infancy), as shown in Table 1. Data for the 12 putative risk factors in the ELVS were drawn from both the 8- and 12-month question-naires. Our indicator of minority status was whether the main language spoken in the home to the child was English or not English, and the indicator of SES was the
continuous SEIFA Index of Relative Disadvantage20
cat-egorized for analysis using quintiles based on SEIFA values for the Victorian population in 1996 with lower scores representing greater disadvantage. In addition to those factors considered by the task force, we studied the
contributions of maternal mental health23(because
ma-ternal depression influences mother– child interaction) and maternal vocabulary (as a proxy for maternal cog-nition, given the strong heritability of intelligence). Ma-ternal mental health was measured with the Nonspecific
Psychological Distress Scale.24Scores were divided into
likely mental health problem (a score ofⱖ4 of a possible
24) versus no mental health problem (ⱕ3). Maternal
vocabulary was measured with the written 44-item mul-tiple-choice modified version of the Mill Hill Vocabulary
Scale25with each correct answer tallied to provide a raw
quantitative score out of the possible 44.
Analysis
Scores on the outcome variables of interest for children
who were born preterm (defined as⬍36 weeks’
gesta-tion) were age-corrected before analysis.
Random-ef-fects linear regression models26 were fitted to the total
CSBS score, each of the 3 composite CSBS scales, and the CDI vocabulary score at 24 months, using the 12
Wave 1: Participants at 8 mo (baseline)
N= 1911
Wave 2: Participants at 12 mo
N= 1760 (92.1%)
Wave 3: Participants at 24 mo
N= 1720 (91.1%)
FIGURE 1
putative risk factors simultaneously as covariates. The method allows for potential correlation between the re-sponses of twins. Additional models were then fitted for each of the CSBS outcomes, identical to the initial mod-els except that the corresponding 12-month CSBS score was included as an additional covariate to quantify the extent to which its predictive strength is dominant over the risk factors. An extended model that included the 12-month CSBS as a predictor was also fitted to the CDI vocabulary score. A logistic regression model was fitted to identify which of the risk factors was associated with late-talking status at 24 months. Information sandwich
estimates of SE27 were calculated for this analysis to
allow for correlation between twins. Again, an addi-tional logistic regression was then fitted with the 12-month CSBS total score additionally included as a co-variate. Analyses of the 24-month CSBS outcomes were restricted to cohort members who had their 24-month assessment between the ages of 23.5 and 25 months, and those of CDI vocabulary production and late-talking sta-tus were restricted to those who completed 24-month assessments between 23.5 and 25.5 months. Analyses in which the 12-month CSBS scores were also included as predictors were further restricted to those who had their 12-month assessment between the ages of 11.5 and 13.5 months. Analyses were implemented by using Stata
9.2.28R2values and residual checks for quantitative
out-comes were based on ordinary linear regression because the coefficients were essentially the same as in the ran-dom-effects regression models that allowed for correla-tion between responses from twins. The squared Pearson
correlation measure ofR2was calculated for the logistic
regression analysis.29PartialR2values for individual risk
factors are not shown, but their relative predictive
strength may be assessed by ranking the P values in
order of size. Unstandardized coefficients are reported for the linear regression analyses.
RESULTS
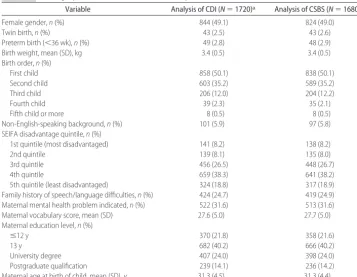
Participant characteristics are shown in Table 2. There were 21 twin pairs in the study and 1 member of another twin set, making a total of 43 nonsingletons in the study. The mean (SD) Index for Disadvantage score was 1037.6 (59.7), slightly higher than that for all metropolitan Melbourne (1020.6 [66.4]); although the spread of
val-ues was similar,⬎80% were in the 3rd, 4th, and 5th (ie,
less disadvantaged) quintiles.
Table 3 summarizes the CSBS standardized scores and CDI raw vocabulary scores at 24 months. Table 4 shows the results from the regression analyses for the 24-month CSBS total and CDI vocabulary production out-comes. Female gender and higher maternal vocabulary were associated with higher CSBS scores at 24 months of age, whereas family history of speech and language dif-ficulties and older maternal age were associated with lower CSBS scores. Graphic investigation using locally
weighted scatterplots30suggested that the negative linear
association between maternal age and the CSBS was
mainly for mothers who were ⱖ30 years of age. For
younger mothers, there was no marked relationship. The model fitted to the CSBS total score accounted for just 4.3% of the variation. Factors that were associated with higher CDI vocabulary production scores at 24 months included female gender, birth order (being fifth born), and English-speaking background, whereas fam-ily history of speech and language difficulties predicted lower CDI scores. The model explained 7.0% of the variation in CDI vocabulary production at 24 months.
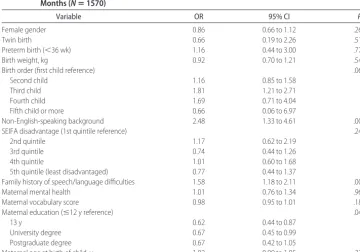
A total of 19.7% (333 of 1691) of children were classified as late talkers. Risk factors associated with late-talking status in the logistic regression analysis (Table 5) included non–English-speaking background, family his-tory of speech and language difficulties, and low
mater-nal education (ⱕ12 years). The variation explained by
the model was 4%.
TABLE 1 Comparison of Putative Risk Factors Studied in the ELVS and Those Recommended for Study by the USPSTF
ELVS USPSTF
Female gender (yes/no) Male gender
Twin birth (yes/no) Perinatal factors
Preterm birth (⬍36/ⱖ36 wk) Perinatal factors
Birth weight, kg Perinatal factors
Birth order (first to fifth or more) Birth order Not used as highly correlated with birth order Family size Non-English-speaking background (yes/no) Minority status SES (SEIFA disadvantage score in population quintiles) SES
Family history speech/language difficulties (yes/no) Family history of speech/language difficulties Maternal mental health problem (yes/no) NA
Maternal vocabulary score NA
Maternal education level (ⱕ12 y reference) Parents’ education
Maternal age at birth of child Older parents or young mother at birth
NA Childhood illnesses
Table 6 displays the linear regression models for each of the 3 CSBS composites (social, speech, and symbolic). The 12 putative risk factors accounted for 2.5% of the variation in the social composite score, 6.4% on the speech composite score, and 7.0% on the symbolic com-posite score. Higher maternal vocabulary score was the only factor associated with higher outcome scores on all 3 composites (see Table 3). Two factors, being female
and mother’s education level (ⱖ13 years), were strongly
associated with higher scores on the speech and sym-bolic composites, whereas having a family history of speech and language difficulties was associated with lower scores on both composites.
When the 12-month CSBS total score was included in the regression model of the 24-month CSBS total score,
it was the strongest predictor (regression coefficient ⫽
0.52; 95% confidence interval [CI]: 0.47 to 0.58; partial
R2⫽19.6%). Similarly, when the models for each of the
24-month CSBS composite scores were adjusted for the relevant 12-month composite score, the amounts of variation explained increased (social score: regression
coefficient ⫽0.60, 95% CI: 0.53 to 0.67, partial R2 ⫽
15.3%; speech score: regression coefficient⫽0.49, 95%
CI: 0.42 to 0.56, partial R2 ⫽ 9.5%; symbolic score:
regression coefficient ⫽ 0.48, 95% CI: 0.40 to 0.55,
partial R2 ⫽ 9.1%). When the 12-month CSBS total
score was included as a predictor in the linear regression of the 24-month CDI score, the corresponding regression
coefficient was 4.9 (95% CI: 4.3 to 5.4) and the partialR2
was 14.2%. Finally, when the 12-month CSBS total
TABLE 2 Demographic Characteristics of the Participants at 24 Months
Variable Analysis of CDI (N⫽1720)a Analysis of CSBS (N⫽1680)b
Female gender,n(%) 844 (49.1) 824 (49.0)
Twin birth,n(%) 43 (2.5) 43 (2.6)
Preterm birth (⬍36 wk),n(%) 49 (2.8) 48 (2.9)
Birth weight, mean (SD), kg 3.4 (0.5) 3.4 (0.5)
Birth order,n(%)
First child 858 (50.1) 838 (50.1)
Second child 603 (35.2) 589 (35.2)
Third child 206 (12.0) 204 (12.2)
Fourth child 39 (2.3) 35 (2.1)
Fifth child or more 8 (0.5) 8 (0.5)
Non-English-speaking background,n(%) 101 (5.9) 97 (5.8) SEIFA disadvantage quintile,n(%)
1st quintile (most disadvantaged) 141 (8.2) 138 (8.2)
2nd quintile 139 (8.1) 135 (8.0)
3rd quintile 456 (26.5) 448 (26.7)
4th quintile 659 (38.3) 641 (38.2)
5th quintile (least disadvantaged) 324 (18.8) 317 (18.9) Family history of speech/language difficulties,n(%) 424 (24.7) 419 (24.9) Maternal mental health problem indicated,n(%) 522 (31.6) 513 (31.6) Maternal vocabulary score, mean (SD) 27.6 (5.0) 27.7 (5.0) Maternal education level,n(%)
ⱕ12 y 370 (21.8) 358 (21.6)
13 y 682 (40.2) 666 (40.2)
University degree 407 (24.0) 398 (24.0)
Postgraduate qualification 239 (14.1) 236 (14.2)
Maternal age at birth of child, mean (SD), y 31.3 (4.5) 31.3 (4.4)
aChildren were included in CDI analysis when aged between 23.5 and 25.5 months at the 24-month follow-up. Denominators in the column
range from 1653 to 1720.
bChildren were included in CSBS analysis when aged between 23.5 and 25 months at the 24-month follow-up; these children were also included
in analyses of CDI. Denominators in the column range from 1621 to 1680.
TABLE 3 Summary of 24-Month CSBS (Total and Composite) Standardized Scores and CDI Vocabulary Production Raw Scores
Variable Mean (SD) Median
(Quartiles)
Range
CSBS (N⫽1677)
Total 104.3 (14.8) 103 (94, 114) 65–135
Social composite 10.2 (3.8) 10 (8, 12) 3–17
Speech composite 12.8 (4.3) 11 (9, 17) 3–17
Symbolic composite 12.7 (4.0) 11 (9, 17) 3–17
score was included in the logistic regression model of late-talking status, it was the strongest predictor (odds
ratio: 0.95; 95% CI: 0.94 to 0.96; partialR2⫽5.3%).
DISCUSSION
When the 12 early risk factors that are widely postulated to predict language outcomes in preschool children were
TABLE 4 Linear Regression of CSBS Total Score and CDI Vocabulary Production at 24 Months
Variable CSBS (N⫽1562) CDI (N⫽1570)
Coefficient 95% CI P Coefficient 95% CI P
Female gendera 3.2 1.8 to 4.7 ⬍.001 53.0 37.4 to 68.6 ⬍.001
Twin birtha ⫺2.3 ⫺7.1 to 2.6 .36 ⫺45.9 ⫺97.7 to 5.9 .08
Preterm birth (⬍36 wk)a ⫺3.3 ⫺8.0 to 1.4 .17 19.2 ⫺31.3 to 69.7 .46
Birth weight, kgb ⫺0.8 ⫺2.4 to 0.8 .31 7.2 ⫺9.4 to 23.8 .40
Birth order (first child reference)c .70 .02
Second child 1.1 ⫺0.5 to 2.7 ⫺9.7 ⫺27.3 to 7.9
Third child 0.6 ⫺1.8 to 3.0 ⫺41.3 ⫺67.0 to⫺15.5
Fourth child 0.8 ⫺4.5 to 6.0 ⫺38.0 ⫺94.7 to 18.7
Fifth child or more 4.4 ⫺7.21 to 16.0 46.8 ⫺78.3 to 172.0
Non-English-speaking backgrounda ⫺0.8 ⫺4.31 to 2.7 .65 ⫺75.4 ⫺116.3 to⫺34.5 ⬍.001
SEIFA disadvantage (1st quintile reference)c .66 .31
2nd quintile 1.0 ⫺2.6 to 4.6 ⫺19.3 ⫺58.0 to 19.5
3rd quintile ⫺0.4 ⫺3.3 to 2.5 ⫺9.3 ⫺41.2 to 22.6
4th quintile ⫺0.7 ⫺3.6 to 2.1 ⫺26.4 ⫺57.6 to 4.7
5th quintile (least disadvantaged) 0.4 ⫺2.7 to 3.6 ⫺13.4 ⫺47.2 to 20.5
Family history of speech/language difficultiesa ⫺2.5 ⫺4.2 to⫺0.8 .004 ⫺45.8 ⫺63.9 to⫺27.7 ⬍.001
Maternal mental health problema ⫺1.2 ⫺2.8 to 0.3 .12 1.1 ⫺15.6 to 17.8 .90
Maternal vocabulary scoreb 0.3 0.1 to 0.5 ⬍.001 1.6 ⫺0.2 to 3.4 .08
Maternal education level (ⱕ12 y reference)c .12 .66
13 y 1.1 ⫺0.9 to 3.0 8.4 ⫺12.6 to 29.3
University degree 1.8 ⫺0.5 to 4.0 15.5 ⫺8.5 to 39.5
Postgraduate degree 3.1 0.5 to 5.6 8.1 ⫺19.6 to 35.7
Maternal age at birth of child, yb ⫺0.3 ⫺0.5 to⫺0.2 ⬍.001 ⫺0.6 ⫺2.6 to 1.3 .53
aBinary predictor: regression coefficient represents the mean difference in outcome score between the 2 categories.
bQuantitative predictor: regression coefficient represents the mean increase in outcome score for each unit increase in the predictor.
cCategorical predictor: regression coefficient represents the mean difference in outcome score between the category of interest and the reference category.
TABLE 5 Logistic Regression of Late-Talking Status (<10th Centile on CDI Vocabulary Production) at 24 Months (Nⴝ1570)
Variable OR 95% CI P
Female gender 0.86 0.66 to 1.12 .26
Twin birth 0.66 0.19 to 2.26 .51
Preterm birth (⬍36 wk) 1.16 0.44 to 3.00 .77
Birth weight, kg 0.92 0.70 to 1.21 .54
Birth order (first child reference) .06
Second child 1.16 0.85 to 1.58
Third child 1.81 1.21 to 2.71
Fourth child 1.69 0.71 to 4.04
Fifth child or more 0.66 0.06 to 6.97
Non-English-speaking background 2.48 1.33 to 4.61 .004
SEIFA disadvantage (1st quintile reference) .24
2nd quintile 1.17 0.62 to 2.19
3rd quintile 0.74 0.44 to 1.26
4th quintile 1.01 0.60 to 1.68
5th quintile (least disadvantaged) 0.77 0.44 to 1.37
Family history of speech/language difficulties 1.58 1.18 to 2.11 .002
Maternal mental health 1.01 0.76 to 1.34 .96
Maternal vocabulary score 0.98 0.95 to 1.01 .18
Maternal education (ⱕ12 y reference) .04
13 y 0.62 0.44 to 0.87
University degree 0.67 0.45 to 0.99
Postgraduate degree 0.67 0.42 to 1.05
Maternal age at birth of child, y 1.02 0.99 to 1.05 .27
studied concurrently, none was a strong predictor of communication and vocabulary skills in 24-month-old children. The variation explained (4.3% and 7.0% for the CSBS and CDI scores, respectively) in the linear regression models was shared by the 12 putative risk factors, and the variation explained by any 1 risk factor was small. In contrast, communication skills that already were achieved at 12 months of age explained one fifth of the variation in 24-month outcomes. Thus, communi-cation score at 12 months was a much better predictor of outcome at 24 months than the 12 putative risk factors collectively. Little variation was explained by the risk factors collectively when considering the outcome of late-talking status at 24 months.
These findings are in accordance with our previous
report17in 12-month-old infants. Here we present
addi-tional evidence that in a community sample followed through the first 2 years of life, there seems to be a strong biological trajectory for communication skill de-velopment and vocabulary production that seems rela-tively unaffected by a range of child, family, and envi-ronmental variables.
Our findings are in contrast to much of the published literature and accepted views on the subject. It seems that assumptions about risk factors for early language delay may have been based largely on the studies that
involved older children. In the USPSTF article,7,31 few
studies reviewed considered risk factors in younger
chil-dren (eg,⬍24 months of age). We suggest that at these
older ages, the evidence remains inconsistent, even for the 2 most-studied potential risk factors. Of the 9 studies that investigated family history of speech and language difficulties, a significant association was reported in 7 (although not all addressed the same speech and lan-guage domains); of the 7 that investigated parental ed-ucation, 5 found an association. It is difficult to interpret the data on parental education because some studies measured only maternal education, whereas others
con-sidered that of both parents. In 1 study,32 a significant
association was found for maternal but not paternal education.
Strengths of this study include its prospective, longi-tudinal design; its community-ascertained sample; and the young age (8 months) at which participants were recruited. The findings are likely to be generalizable, given the community nature of the sample and that the prevalence of late talkers (19.7%) and spread of CSBS scores at 24 months of age were broadly similar to those
in other studies.33Furthermore, this is the first study to
measure concurrently the broad range of variables that were recently identified as requiring additional study by a major systematic review.
Relative weaknesses include that although we used validated measures that are widely considered reliable, the language outcomes of interest relied solely on parent report. Face-to-face assessments will be conducted at 4
TABLE 6 Linear Regression Analysis of the 3 CSBS Composite Scores at 24 Months (Nⴝ1562)
Variable Social Speech Symbolic
Coefficient 95% CI P Coefficient 95% CI P Coefficient 95% CI P Female gendera 0.32 ⫺0.06 to 0.70 .10 1.00 0.58 to 1.42 ⬍.001 1.16 0.78 to 1.55 ⬍.001
Twin birtha ⫺0.55 ⫺1.81 to 0.71 .39 ⫺0.44 ⫺1.83 to 0.95 .54 ⫺0.43 ⫺1.70 to 0.85 .51
Preterm birth (⬍36 wk)a ⫺1.14 ⫺2.37 to 0.09 .07 ⫺0.13 ⫺1.49 to 1.22 .85 ⫺0.31 ⫺1.56 to 0.93 .62
Birth weight, kgb ⫺0.41 ⫺0.82 to 0.00 .05 0.25 ⫺0.20 to 0.70 .28 0.26 ⫺0.15 to 0.68 .21
Birth order (first child reference)c .04 .24 .71
Second child 0.51 0.08 to 0.94 ⫺0.24 ⫺0.71 to 0.24 ⫺0.03 ⫺0.47 to 0.40 Third child 0.89 0.26 to 1.52 ⫺0.75 ⫺1.44 to⫺0.06 ⫺0.43 ⫺1.06 to 0.20 Fourth child 0.79 ⫺0.58 to 2.17 ⫺0.24 ⫺1.76 to 1.27 ⫺0.26 ⫺1.65 to 1.13 Fifth child or more 0.51 ⫺2.54 to 3.55 1.40 ⫺1.96 to 4.75 0.54 ⫺2.54 to 3.62 Non-English-speaking backgrounda 0.15 ⫺0.77 to 1.07 .75 ⫺0.41 ⫺1.43 to 0.60 .42 ⫺0.82 ⫺1.75 to 0.10 .08
SEIFA disadvantage (1st quintile reference)c .47 .52 .41
2nd quintile 0.22 ⫺0.72 to 1.16 ⫺0.51 ⫺1.55 to 0.52 0.33 ⫺0.62 to 1.28 3rd quintile ⫺0.18 ⫺0.94 to 0.59 ⫺0.51 ⫺1.35 to 0.34 0.06 ⫺0.72 to 0.84 4th quintile ⫺0.42 ⫺1.17 to 0.34 ⫺0.62 ⫺1.45 to 0.21 0.50 ⫺0.26 to 1.27 5th quintile (least disadvantaged) ⫺0.22 ⫺1.04 to 0.60 ⫺0.25 ⫺1.15 to 0.66 0.26 ⫺0.57 to 1.09 Family history of speech/language
difficultiesa
⫺0.07 ⫺0.51 to 0.37 .76 ⫺0.92 ⫺1.41 to⫺0.44 ⬍.001 ⫺0.96 ⫺1.41 to⫺0.51 ⬍.001
Maternal mental health problema ⫺0.32 ⫺0.73 to 0.08 .12 ⫺0.04 ⫺0.49 to 0.40 .85 ⫺0.54 ⫺0.95 to⫺0.13 .01
Maternal vocabulary scoreb 0.05 0.01 to 0.09 .03 0.10 0.05 to 0.15 ⬍.001 0.06 0.02 to 0.11 .007
Maternal education level (ⱕ12 y reference)c .86 ⬍.001 .005
13 y 0.13 ⫺0.39 to 0.64 0.51 ⫺0.06 to 1.07 0.37 ⫺0.15 to 0.89
University degree ⫺0.03 ⫺0.62 to 0.55 1.29 0.65 to 1.94 0.68 0.08 to 1.27 Postgraduate degree 0.19 ⫺0.48 to 0.87 1.14 0.40 to 1.89 1.20 0.52 to 1.88 Maternal age at birth of the child, yb ⫺0.10 ⫺0.15 to⫺0.06 ⬍.001 ⫺0.02 ⫺0.08 to 0.03 .40 ⫺0.01 ⫺0.06 to 0.04 .67
aBinary predictor: regression coefficient represents the mean difference in outcome score between the 2 categories.
bQuantitative predictor: regression coefficient represents the mean increase in outcome score for each unit increase in the predictor.
years of age to determine the impact that these factors have on later language development measured more objectively. It is possible that as children acquire more spoken language, risk factors that seemed to contribute little to development at 12 and 24 months may prove to be important predictors of language development by 4 years of age. This could partly reflect simple measure-ment issues: by 4 years, language and communication development can be formally tested using measures that are psychometrically more reliable and stable. Further-more, although children seem to be equipped with the basic infrastructure and primed to acquire language, ac-tivation and acceleration rates may differ during the
early years and may also be disrupted.19On the basis of
current evidence, we expect that many but not all of our late-talking 2-year-olds (19.7%) will recover and have
language skills within normal limits at 4 years of age.5,6
Finally, by 4 years of age, definitions of language impair-ment are much more specific and should improve the strength of predictive associations.
We were not able to study the impact of childhood illnesses, although we did include perinatal factors (a major component of significant early illnesses) and note that the task force review did not suggest that this was a strong predictor. It is possible that other important risk factors that were not studied here exist; however, no others were obvious either in our own literature review at the inception of this study in 2001 or in the much
more recent USPSTF review.7
CONCLUSIONS
This comprehensive study indicates that none of the putative risk factors for early language delay that were identified through a major systematic review could be used to predict language outcomes accurately in children at 24 months of age. Although they may more accu-rately predict language impairment in older children, they seem unlikely to be helpful in screening for early language delay. Two recommendations flow from these findings. First, we believe that language promotion ac-tivities in infants who are younger than 24 months should be universal or, if targeted, based on the level of communication skills displayed. Second, additional re-search should be directed toward defining more tightly the specific components of infant communicative devel-opment that most strongly predict language outcomes in the toddler and preschool years.
ACKNOWLEDGMENTS
This study was supported by Australian National Health and Medical Research Council project grant 237106 and small grants obtained from the Murdoch Childrens Re-search Institute and the Faculty of Health Sciences, La Trobe University. Ethical approval was obtained from the Royal Children’s Hospital Melbourne (23018) and La Trobe University (03–32) human ethics committees.
We sincerely acknowledge the contribution of the Victorian Maternal and Child Health nurses who assisted with recruitment of the sample, and we thank all of the participating parents.
REFERENCES
1. Beitchman JH, Brownlie EB, Inglis J, et al. Seven year follow up of speech/language impaired and control children: psychi-atric outcome.J Child Psychol Psychiatry.1996;37:961–970 2. Stothard SE, Snowling MJ, Bishop DV, Chipchase BB, Kaplan
CA. Language-impaired preschoolers: a follow up into adoles-cence.J Speech Lang Hear Res.1998;41:407– 418
3. Smith L. Predicting communicative competence at 2 and 3 years from pragmatic skills at 10 months.Int J Lang Commun Disord.1998;33:127–148
4. Law J, Boyle J, Harris F, Harkness A, Nye C. Prevalence and natural history of primary speech and language delay: findings from a systematic review of the literature.Int J Lang Commun Disord.2000;35:165–188
5. Rescorla L, Dahlsgaard K, Roberts J. Late-talking toddlers: MLU and IPSyn outcomes at 3;0 and 4;0. J Child Lang. 2000;27: 643– 664
6. Paul R, Spangle-Looney S, Dahm P. Communication and so-cialization skills at age 2 and 3 in “late talking” young children.
J Speech Hear Res.1991;34:858 – 865
7. Nelson HD, Nygren P, Walker M, Panoscha R. Screening for speech and language delay in preschool children: systematic evidence review for the US Preventive Services Task Force.
Pediatrics. 2006;117(2). Available at: www.pediatrics.org/cgi/ content/full/117/2/e298
8. Lyytinen H, Ahonen T, Eklund K, et al. Developmental path-ways of children with and without familial risk for dyslexia during the first years of life.Dev Neuropsychol.2001;20:535–554 9. Kloth SA, Janssen P, Kraaimaat FW, Brutten GJ. Speech-motor and linguistic skills of young stutterers prior to onset.J Fluency Disord.1995;20:157–170
10. Cantwell DP, Baker L. Psychiatric and learning disorders in children with speech and language disorders: a descriptive analysis.Adv Learn Behav Disabil.1985;1:4
11. Whitehurst GJ, Arnold DS, Smith M, Fischel JE, Lonigan CJ, Valdez-Menchaca MC. Family history in developmental ex-pressive language delay.J Speech Hear Res.1991;34:1150 –1157 12. Klein PS, Tzuriel D. Preschoolers’ type of temperament as predictor of potential difficulties in cognitive functioning.Isr J Psychiatry Relat Sci.1986;23:49 – 61
13. Fox A, Dodd B, Howard D. Risk factors for speech disorders in children.Int J Lang Commun Disord.2002;37:117–131 14. Peters SA, Grievink EH, van Bon WH, van den Bercken JH,
Schilder AG. The contribution of risk factors to the effect of early otitis media with effusion on later language, reading and spelling.Dev Med Child Neurol.1997;39:31–39
15. Weindrich D, Jennen Steinmetz C, Laucht M, Esser G, Schmidt M. Epidemiology and prognosis of specific disorders of lan-guage and scholastic skills.Eur Child Adolesc Psychiatry.2000;9: 186 –194
16. Yliherva A, Olsen P, Maki-Torkko E, Koiranen M, Jarvelin M. Linguistic and motor abilities of low-birthweight children as assessed by parents and teachers at 8 years of age.Acta Paediatr.
2001;90:1440 –1449
17. Reilly S, Eadie P, Bavin EL, et al. Growth of infant communi-cation between 8 and 12 months: a population study.J Paediatr Child Health.2006;42:764 –770
for anatomical anomalies in a motor-language network.Brain Lang.2007;102:91–98
19. Rice ML. Growth models of developmental language disorders: developmental language disorders. In: Rice ML, Warren SF, eds.Developmental Language Disorders: From Phenotypes to Etiolo-gies.Mahwah, NJ: Lawrence Erlbaum; 2004:207–240 20. Australian Bureau of Statistics.Socio-Economic Indexes for Areas.
Canberra, Australia: Australian Bureau of Statistics; 2001 21. Wetherby A, Prizant B.Communication and Symbolic Behaviour
Scales. Baltimore, MD: Paul H. Brookes; 2002
22. Fenson L, Dale PS, Reznick JS. The MacArthur Communicative Development Inventories: User’s Guide and Technical Manual. San Diego, CA: Singular Publishing Group; 1993
23. Murray L, Fiori-Cowley A, Hooper R, Cooper P. The impact of postnatal depression and associated adversity on early mother-infant interactions and later mother-infant outcome.Child Dev.1996; 67:2512–2526
24. Kessler R, Mroczek D.Final Version of our Non-Specific Psycholog-ical Distress Scale[memorandum]. Ann Arbor, MI: Institute for Social Research; 1994
25. Raven JC.Mill Hill Vocabulary Scale. Oxford, United Kingdom: JC Raven Ltd; 1997
26. Goldstein H. Multilevel Statistical Models. London, United Kingdom: Arnold; 1995
27. Zeger SL, Liang KY. Longitudinal data analysis for discrete and continuous outcomes.Biometrics.1986;42:121–130
28. Stata Statistical Software[computer program]. Release 7.0. Col-lege Station, TX: Stata Corp; 2005
29. Hosmer DW, Lemeshow S. Applied Logistic Regression. New York, NY: Wiley; 2000
30. Cleveland W. Robust locally weighted regression and smooth-ing scatterplots.J Am Stat Assoc.1979;74:829 – 836
31. Nelson HD, Nygren P, Walker M, Panoscha R. Screening for Speech and Language Delay in Preschool Children: Systematic Evi-dence Review. Number 41. Rockville, MD: Agency for Healthcare Quality and Research, US Department of Health and Human Services; 2006
32. Tomblin JB, Hardy JC, Hein HA. Predicting poor-communica-tion status in preschool children using risk factors present at birth.J Speech Hear Res.1991;34:1096 –1105
33. Wetherby A, Prizant B, Hutchinson T. Communicative, social-affective, and symbolic profiles of young children with autism and pervasive developmental disorder.Am J Speech Lang Pathol.
DOI: 10.1542/peds.2007-0045
2007;120;e1441
Pediatrics
Bretherton, Patricia Eadie, Yin Barrett and Obioha C. Ukoumunne
Sheena Reilly, Melissa Wake, Edith L. Bavin, Margot Prior, Joanne Williams, Lesley
Predicting Language at 2 Years of Age: A Prospective Community Study
Services
Updated Information &
http://pediatrics.aappublications.org/content/120/6/e1441
including high resolution figures, can be found at:
References
http://pediatrics.aappublications.org/content/120/6/e1441#BIBL
This article cites 22 articles, 0 of which you can access for free at:
Subspecialty Collections
rning_disorders_sub
http://www.aappublications.org/cgi/collection/cognition:language:lea Cognition/Language/Learning Disorders
al_issues_sub
http://www.aappublications.org/cgi/collection/development:behavior Developmental/Behavioral Pediatrics
following collection(s):
This article, along with others on similar topics, appears in the
Permissions & Licensing
http://www.aappublications.org/site/misc/Permissions.xhtml
in its entirety can be found online at:
Information about reproducing this article in parts (figures, tables) or
Reprints
http://www.aappublications.org/site/misc/reprints.xhtml
DOI: 10.1542/peds.2007-0045
2007;120;e1441
Pediatrics
Bretherton, Patricia Eadie, Yin Barrett and Obioha C. Ukoumunne
Sheena Reilly, Melissa Wake, Edith L. Bavin, Margot Prior, Joanne Williams, Lesley
Predicting Language at 2 Years of Age: A Prospective Community Study
http://pediatrics.aappublications.org/content/120/6/e1441
located on the World Wide Web at:
The online version of this article, along with updated information and services, is
by the American Academy of Pediatrics. All rights reserved. Print ISSN: 1073-0397.