Prognostication and Certainty in the Pediatric Intensive Care Unit
James P. Marcin, MD, MPH*; Murray M. Pollack, MD, FCCM‡§; Kantilal M. Patel, PhD§; Bruce M. Sprague, BS§; and Urs E. Ruttimann, PhD§\†
ABSTRACT. Objective. Prognostication is central to developing treatment plans and relaying information to patients, family members, and other health care provid-ers. The degree of confidence or certainty that a health care provider has in his or her mortality risk assessment is also important, because a provider may deliver care differently depending on their assuredness in the assess-ment. We assessed the performance of nurse and physi-cian mortality risk estimates with and without weighting the estimates with their respective degrees of certainty.
Methods. Subjective mortality risk estimates from critical care attendings (n55), critical care fellows (n5 9), pediatric residents (n534), and nurses (n552) were prospectively collected on at least 94% of 642 eligible, consecutive admissions to a tertiary pediatric intensive care unit (PICU). A measure of certainty (continuous scale from 0 to 5) accompanied each mortality estimate. Estimates were evaluated with 232 outcome probabili-ties, thekstatistic, the area under the receiver operating characteristics curve, and the Hosmer and Lemeshow goodness-of-fitx2statistic. The estimates were then re-evaluated after weighting predictions by their respective degree of certainty.
Results. Overall, there was a significant difference in the predictive accuracy between groups. The mean mor-tality predictions from the attendings (6.09%) more closely approximated the true mortality rate (36 deaths, 5.61%) whereas fellows (7.87%), residents (10.00%), and nurses (16.29%) overestimated the mean overall PICU mortality. Attendings were more certain of their predic-tions (4.27) than the fellows (4.01), nurses (3.79), and residents (3.75). All groups discriminated well (area un-der receiver operating characteristics curve range, 0.86 – 0.93). Only PICU attendings and fellows did not signifi-cantly differ from ideal calibration (x2). When mortality predictions were weighted with their respective certain-ties, their performance improved.
Conclusions. The level of medical training correlated with the provider’s ability to predict mortality risk. The higher the level of certainty associated with the mortality prediction, the more accurate the prediction; however, high levels of certainty did not guarantee accurate pre-dictions. Measures of certainty should be considered when assessing the performance of mortality risk
esti-mates or other subjective outcome predictions.Pediatrics 1999;104:868 – 873; mortality, prediction, certainty, sever-ity of illness, pediatric intensive care, intensive care units.
ABBREVIATIONS. PICU, pediatric intensive care unit; ICU, in-tensive care unit; AUC, area under the receiver operating charac-teristic curve.
P
rognostication is central to developing a treat-ment plan and relaying information to pa-tients, family members, and other health care providers. A health care provider’s estimate of mor-tality risk is an important element in prognostication and care delivery to patients admitted to a pediatric intensive care unit (PICU). A more accurate assess-ment could lead to more appropriate monitoring, therapies, and family counseling. Similarly, the de-gree of confidence or certainty that a health care provider has with his or her assessment of mortality risk is also important, because a provider may de-liver care differently depending on his or her as-suredness in the mortality risk assessment. There-fore, risk assessment and its certainty have important implications for length of stay, quality of care, and cost of hospitalization.Physicians’ accuracy in estimating mortality risk for patients admitted to neonatal and adult intensive care units (ICUs) has been variable.1– 4 Generally, clinically experienced physicians perform better than less experienced physicians; however, there are often discrepancies between physicians of equal clinical experience.5The performance of physician mortality risk estimates also depends on the patient’s disease or severity of illness.1,2,6There have been no studies of prediction accuracy in a PICU where the length of stays are shorter and overall mortality rates are lower than neonatal and adult ICUs.7–9 There have been no investigations in any ICU environment of certainty assessments in mortality risk estimates.
We assessed the accuracy, calibration, and cer-tainty of subjective mortality risk estimates from physicians and nurses for patients admitted to a tertiary PICU. We hypothesized that the perfor-mance of these estimates could be improved by weighting them with their respective degrees of cer-tainty. We also investigated whether mortality risk estimates and degrees of certainty changed within 24 hours of the initial assessment. We anticipated that the degree of certainty would increase for all pa-tients. We expected also that estimates of mortality From the *Section of Critical Care Medicine, Department of Pediatrics,
University of California, Davis, Sacramento, California; and the ‡Depart-ment of Critical Care Medicine, Children’s National Medical Center; the §Center for Health Services and Clinical Research, Children’s Research Institute, George Washington University School of Medicine; and the\ Na-tional Institute on Alcohol Abuse and Alcoholism, Washington, DC. †Deceased.
Received for publication Oct 12, 1998; accepted Feb 12, 1999.
Reprint requests to (J.P.M.) Department of Pediatrics, Section of Critical Care, UC Davis Medical Center, TICON II #384, 2516 Stockton Blvd, Sac-ramento, CA 95817. E-mail: [email protected]
risk would increase for patients who eventually died, and decrease for patients who survived.
METHODS
The study was conducted at the Children’s National Medical Center PICU, a 16-bed PICU with;1000 admissions per year. The physician coverage includes an attending pediatric intensivist, 2 to 3 PICU fellows, 0 to 1 rotating fellows (from anesthesia, the emergency department, or outside facilities), and 3 to 4 pediatric residents (postgraduate year [PGY-2] or PGY-3). Each patient is assigned an attending, fellow, resident, and nurse.
The study was approved by the Institutional Review Board. Informed consent was obtained from each participating health professional. All consecutive patients who were in the PICU for 10 to 24 hours at the time of morning or afternoon rounds (whichever came first) were included in the study. Excluded patients were those who were discharged or expired before the 10-hour obser-vation period, and patients admitted just before morning rounds who would not have formal rounds during the 10- to 24-hour observation period. This purposefully excluded patients who were admitted for short stays (,10 hours), patients admitted for procedures, and patients admitted in the process of dying.
Data from physicians (attendings, fellows, and residents) and nurses were obtained after morning and afternoon rounds. Formal rounds included the presentation or review of the patient’s his-tory, physical, laboratory data, and imaging studies. Therefore, clinical assessment included 10 to 24 hours of observation, and review of all pertinent medical information, as well as discussions regarding the patient’s current condition and treatment plan.
Data included the health care provider’s estimate of mortality risk (from 0% to 100%) and the degree of certainty associated with the estimate on a continuous scale from 0 to 5, with 0 being complete uncertainty and 5 being absolute certainty. The informa-tion sheet was confidentially completed by each of the providers just after rounds on that patient. Second day mortality estimates and degrees of certainty were collected for those patients who remained in the PICU 24 hours after the first estimates.
The mean mortality estimates and certainties from attendings, fellows, residents, and nurses were compared using ANOVA and Student-Newman-Keuls, where appropriate. The different groups’ abilities to differentiate survivors from deaths were compared using three separate measures: the McNemar’s test, thek coeffi-cient, and the area under the receiver operating characteristic curves.10,11The McNemar’s test is used to compare two correlated
binomial proportions. APvalue of,.05 indicates that the strength of the relationship is unlikely to have arisen by chance alone. The
kcoefficient similarly measures the correlation between the pre-dicted and observed outcomes, but corrects for asymmetry in 23 2 tables that might result in misleadingly significant McNemarP
values.12Akcoefficient of 0 indicates no agreement and 1
indi-cates perfect agreement. For the McNemar’s test andkcoefficient, a cutoff value of an estimated mortality risk of 50% was used to differentiate subjective predictions of survival and nonsurvival. To compare the prediction accuracy (or discrimination), Hanley’s and McNeil’s11,13method based on the Wilcoxon statistic was used
to test for differences between the area under the receiver operat-ing characteristic curve (AUC).
We investigated whether weighting mortality risk estimates by their degree of certainty improved performance by repeating cal-culations (McNemar’s,k, and AUC) with a weight equal to the degree of certainty. For example, an estimate with a certainty of 4.5 counted 4.5 times whereas a mortality risk estimate certainty of 1.0 counted only once. This was accomplished in SAS (SAS Insti-tute; SAS, Cary, NC) by using the weight statement for both the FREQ procedure and LOGISTIC procedure.
For attendings, fellows, residents, and nurses, the following parameters were evaluated: sensitivity (correctly predicted deaths/total deaths), specificity (correctly predicted survivors/ total survivors), false-positives (incorrectly predicted deaths/total deaths), false-negatives (incorrectly predicted survivors/total sur-vivors), positive predictive value (correctly predicted deaths/total predicted deaths), and negative predictive value (correctly pre-dicted survivors/total prepre-dicted survivors). These calculations were also repeated weighting their estimates with the respective degrees of certainty. To assess the goodness-of-fit (calibration) of the predictors, we calculated Hosmer and Lemeshow14x2statistics
for each of the health care provider groups.
For those patients with two mortality estimates, we investi-gated whether the mortality risk estimates and degrees of cer-tainty changed significantly during a 24-hour period. The means were compared with a repeated measures ANOVA, then stratified for survivor status and for the level of training (resident, fellow, attending, and nurse), and compared with the Wilcoxon rank sum test when appropriate.
RESULTS
Of the 713 patients that were admitted during the study, 642 met the eligibility criteria. Excluded from the study were patients who were discharged (n 5
55) or died (n5 5),10 hours after admission. Also excluded were 11 patients (0 deaths) that were ad-mitted just before morning rounds and therefore were not formally rounded on between the 10- to 24-hour observation period. There were 36 deaths included in the study (5.61%). The median age was 4.5 years (mean, 6.1 years), 57% of the admissions were emergency admissions, and 37.9% of the pa-tients were postoperative. The four most frequent diagnoses were: 1) postoperative, noncardiac (23.4%); 2) postoperative, cardiac (14.5%); 3) asthma (11.2%); and 4) trauma (11.2%). For every patient, a subjective mortality risk estimate was collected from at least one of each of the following: critical care attendings (n 5 5), critical care fellows (n 5 9), pe-diatric residents (n534), and PICU nurses (n552). In some instances, if more than one provider from each group was present on rounds (ie, an additional attending), predictions were collected from both. Data were collected on 96.4%, 93.8%, 84.1%, and 87.6% of the eligible admissions, respectively. None of the missing patients died.
Table 1 shows the average mortality risk estimates and certainties on all patients, survivors, and deaths for the four health care provider groups. Overall, there was a significant difference in the mortality risk estimates and degrees of certainty between provider groups (P,.001 for both). The mean mortality esti-mates from the attendings (6.09%) more closely ap-proximated the true mortality rate (5.61%) whereas fellows (7.87%), residents (10.00%), and nurses (16.29%) overestimated the mean overall PICU mor-tality. Attendings were more certain (4.27) of their estimates than the fellows (4.01), who were more certain than nurses (3.79), and residents (3.75). Phy-sicians were more certain of their estimates of sur-vival than death (P , .001, P 5 .068, P 5 .007, respectively), whereas nurses tended to be more cer-tain of their estimates of death (P5.15).
(0.934, 0.945) and fellows (0.858, 0.879) without and with certainty weights, respectively.
The sensitivities, specificities, false-positive values, false-negative values, positive predictive values, and negative predictive values are shown in Table 3. The performance of the prediction parameters generally improved with certainty weighting. The attendings and fellows demonstrated good calibration as as-sessed by the Hosmer and Lemeshow14 goodness-of-fitx2statistic (Fig 2,P ..05), whereas the estimates of the residents and nurses were poorly calibrated (P , .001). All groups tended to overestimate mor-tality, especially when mortality estimates were .45%.
The first and second day degrees of certainty for patients who were in the ICU for more than 34 hours are shown in Table 4. For all groups, there was no significant change in mortality estimates between the first and second day. The attendings were the only group that had a significant change in the degree of certainty, being more certain of their mortality esti-mates on the second day compared with the first day for all patients (P 5.047).
DISCUSSION
Physician estimates of mortality risk may influ-ence medical interventions, therapeutic plans, and possibly patient outcomes.15,16Several studies have assessed the ability of health care providers to estimate mortality risk1– 6; however, few of these studies involved infants or children and none of these studies were conducted in the PICU. The
purpose of this study was to comprehensively evaluate nurse and physician subjective mortality estimates in the PICU, to reassess these estimates after incorporating the degree of certainty of the prediction, and to evaluate whether or not these predictions or degrees of certainty change during a 24-hour period.
This study used a design that provided an ob-servation period of 10 to 24 hours of clinically relevant time before collecting mortality risk esti-mates. This excluded simple predictions on pa-tients who were admitted for very short stays or in the process of dying, and to provide time for nurses and physicians to determine diagnosis and assess responsiveness to therapy. In addition to analyzing the categorization of patients with out-come probabilities, we examined the ability of health care providers to discriminate and calibrate. Discrimination, the ability to correctly differentiate survivors from deaths, was analyzed by the AUC.11 Calibration, the correlation between the prediction and outcome throughout the entire range of mor-tality risk, was analyzed by the Hosmer-Leme-show goodness-of-fit x2test.14
In this study, the level of medical training gen-erally correlated with the provider’s ability to pre-dict mortality risk. Attending physicians had the highest proportion of patients correctly catego-rized, were the best at discriminating survivors from deaths, and were well calibrated throughout the entire range of mortality risks. All groups per-formed very well at discriminating survivors from
TABLE 1. Health Care Providers’ Average Mortality Estimates and Average Degree of Certainty*
Attendings (n5680)
Fellows (n5602)
Residents (n5640)
Nurses (n5637)
Mortality estimate (%)
All patients 6.09 (0.68)a† 7.87 (0.70)ab 10.00 (0.81)b 16.29 (0.93)c
Survivors 3.40 (0.41)a‡ 5.44 (0.45)b 12.71 (0.65)c 7.61 (0.73)d
Deaths 50.30 (6.47)ab 45.00 (6.46)a 49.29 (5.58)ab 67.17 (4.98)b
Certainty of estimates
All patients 4.26 (0.03)a 4.01 (0.03)b 3.75 (0.05)c 3.78 (0.05)c
Survivors 4.30 (0.04)a 4.03 (0.04)b 3.78 (0.05)c 3.77 (0.05)c
Deaths 3.64 (0.17)a 3.74 (0.14)a 3.15 (0.17)b 4.03 (0.13)a
* Seven hundred thirteen patients, 36 deaths (5.61%); means (SEM).
† Means in the same row with the same letter are not significantly different (P..05). ‡ Means in the same row without a similar letter are significantly different (P,.05).
TABLE 2. Performance of Health Care Providers’ Estimates With and Without Certainty Weighting
McNemarP k* AUC (SEM)
Attendings
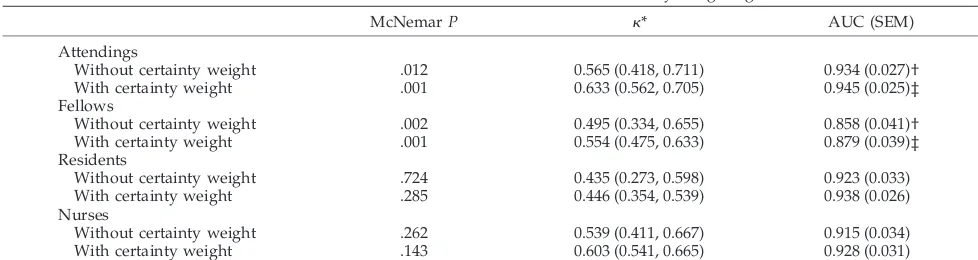
Without certainty weight .012 0.565 (0.418, 0.711) 0.934 (0.027)†
With certainty weight .001 0.633 (0.562, 0.705) 0.945 (0.025)‡
Fellows
Without certainty weight .002 0.495 (0.334, 0.655) 0.858 (0.041)†
With certainty weight .001 0.554 (0.475, 0.633) 0.879 (0.039)‡
Residents
Without certainty weight .724 0.435 (0.273, 0.598) 0.923 (0.033)
With certainty weight .285 0.446 (0.354, 0.539) 0.938 (0.026)
Nurses
Without certainty weight .262 0.539 (0.411, 0.667) 0.915 (0.034)
With certainty weight .143 0.603 (0.541, 0.665) 0.928 (0.031)
AUC indicates area under receiver operating characteristic curve. *k(95% confidence interval bounds).
deaths but performed less well when assessed throughout the range of mortality risk intervals. This finding is consistent with others, in which subjective mortality estimates are most accurate at the ends of the prediction spectrum.1–5,17 The poor calibration of the residents and nurses was the result of their tendency to overestimate mortality risk. Overestimation of mortality risk by less expe-rienced care providers may be a reflection that children are more likely than adults to survive significant derangements in physiologic parame-ters (ie, multiorgan system failure).18,19
This is the first study to measure the degree of clinical certainty associated with subjective mortal-ity estimates. Overall, PICU attendings and fellows were more certain in their estimates than the resi-dents and nurses, especially when predicting sur-vival. Nurses were more certain in their estimates of death. We hypothesized that the performance
measures of the subjective mortality risk estimates would improve when weighted by their degree of certainty, such that predictions with a high level of certainty were weighted more than predictions made with a low level of certainty. We found this to be consistently true, but only to a marginal degree (Table 2). For example, clinically important categories, such as the positive predictive value of a mortality prediction, remained relatively low even with certainty weighting. The inability of certainty weighting to make significant improve-ments in mortality prediction performance may be multifactorial. One factor may be health care pro-viders’ overconfidence or unwillingness to admit uncertainty.
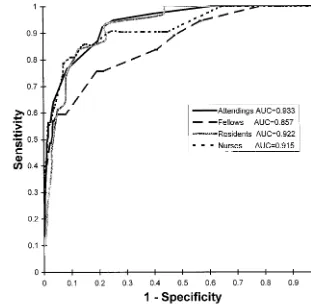
For patients who remained in the PICU for more than 2 days, first day mortality estimates were not significantly different from second day mortality estimates. We hypothesized that second day mor-Fig 1. Receiver operating characteristics
curve.
TABLE 3. Performance of Health Care Providers’ Mortality Estimates (Given as Percentages) With and Without Certainty Weight
Sensitivity Specificity False-positives False-negatives PPV NPV
Attendings
Without certainty weight 48.7 98.9 26.9 3.1 73.1 96.9
With certainty weight 55.3 99.2 21.5 2.3 78.5 97.7
Fellows
Without certainty weight 40.5 98.9 28.5 3.8 71.4 96.2
With certainty weight 46.5 99.0 25.3 3.4 74.7 96.8
Residents
Without certainty weight 45.2 97.1 51.7 3.3 48.2 96.7
With certainty weight 44.6 97.8 50.0 2.8 50.0 97.3
Nurses
Without certainty weight 61.9 96.1 46.9 2.7 53.1 97.3
With certainty weight 66.3 96.7 39.7 2.6 60.3 97.4
tality estimates on patients who went on to ulti-mately live or die would be lower or higher, re-spectively, compared with first day estimates. These results do however, agree with earlier find-ings of Poses et al,20in which admission mortality predictions did not change when compared with predictions made 48 hours later. Poses proposed that such findings were evidence that physicians “could not take advantage of sequential clinical information over time.” We also anticipated that the degree of certainty on predictions would be higher on the second day than on the first, because more time was available to collect and review clin-ical, radiographic, and laboratory data pertinent to patient prognosis. This was only true for attending physicians when average mortality estimates were compared on all patients (Table 4).
Our study underscores health care providers’ limitations in accuracy and reliability in mortality predictions made on the day of admission for pa-tients admitted to the PICU. Although the perfor-mance of attending physicians’ mortality estimates was best compared with other providers, limita-tions in their abilities remain. And while factoring
in the degree of certainty in mortality estimates improved the overall performance of estimates, these improvements were not substantial. Health care providers should realize their inability to pre-dict outcome with absolute certainty, and to real-ize that their level of certainty in a mortality pre-diction may be inappropriately high. Prepre-diction performance may improve, however, with training in severity of illness assessment or with additional tools. Incorporation of more descriptive informa-tion, degree of certainty, and objective risk models could help health care providers improve their abilities in the assessment of mortality risk.
REFERENCES
1. Stevens SM, Richardson DK, Gray JE, Goldmann DA, McCormick MC. Estimating neonatal mortality risk: an analysis of clinicians’ judgments. Pediatrics. 1994;93:945–950
2. McClish DK, Powell SH. How well can physicians estimate mortality in a medical intensive care unit?Med Decis Making. 1989;9:125–132 3. Poses RM, Bekes C, Winkler RL, Scott WE, Copare FJ. Are two
(inex-perienced) heads better than one (ex(inex-perienced)head?Arch Intern Med. 1990;150:1874 –1878
4. Kruse JA, Thill-Baharozian MC, Carlson RW. Comparison of clinical assessment with APACHE II for predicting mortality risk in patients admitted to a medical intensive care unit.JAMA. 1988;260:1739 – 1742
5. Poses RM, Bekes C, Copare FJ, Scott WE. The answer to “What are my chances, Doctor?” depends on whom is asked: prognostic dis-agreement and inaccuracy for critically ill patients.Crit Care Med. 1989;8:827– 833
6. Perkins HS, Jonsen AR, Epstein WV. Providers as predictors: using outcome predictions in intensive care.Crit Care Med.1986;14:105– 110
7. Pollack MM, Patel KM, Ruttimann UE. PRISM III: an updated pediatric risk of mortality score.Crit Care Med.1996;24:743–752
8. Knaus WA, Wagner DP, Draper EA, et al. The APACHE III prognostic system. Risk prediction of hospital mortality for critically ill hospital-ized adults.Chest.1991;100:1619 –1636
9. Richardson DK, Gray JE, McCormick MC, Workman K, Goldmann DA. Score for neonatal acute physiology: a physiologic severity index for neonatal intensive care.Pediatrics.1993;91:617– 623
10. Armitage P.Statistical Methods in Medical Research. New York, NY: John Wiley and Sons, Inc; 1971;108 –115
11. Hanley JA, McNeil BJ. The meaning and use of the area under a receiver operating characteristic (ROC) curve.Radiology. 1982;143:29 –36 Fig 2. Calibration curve, x2, 6
degrees of freedom.
TABLE 4. Health Care Providers’ First and Second Day Mean Degree of Certainty (267 Patients, 31 Deaths [11.61%])
Degree of Certainty
All Patients Survivors Deaths
Attendings
First day 3.94* 3.96 3.79 Second day 4.10* 4.11 3.98 Fellows
First day 3.79 3.79 3.72 Second day 3.92 3.91 4.06 Residents
First day 3.37 3.41 3.08 Second day 3.48 3.51 3.28 Nurses
First day 3.54 3.48 3.98 Second day 3.63 3.61 3.78
12. Fleiss JL.Statistical Methods for Rates and Proportions. 2nd ed. John Wiley and Sons, New York, NY: 1981;219 –229
13. Hanley JA, McNeil BJ. A method of comparing the areas under receiver operating characteristic curves derived from the same cases.Radiology. 1983;148:830 – 843
14. Hosmer DW, Lemeshow S.Applied Logistic Regression. New York NY: John Wiley and Sons Inc; 1989
15. Shapiro AR. The evaluation of clinical predictions. A method and initial application.N Engl J Med.1977;296:1509 –1514
16. Levy DE, Caronna JJ, Singer BH, et al. Predicting outcome from hypoxic-ischemic coma.JAMA. 1985;253:1420 –1426
17. Brannen AL, Godfrey LJ, Goetter WE. Prediction of outcome from critical illness.Arch Intern Med.1989;149:1083–1086
18. Wilkinson JD, Pollack MM, Ruttimann UE, Glass NL, Yeh TS. Outcome of pediatric patients with multiple organ system failure.Crit Care Med. 1986;14:271–274
19. Zimmerman JE, Knaus WA, Sun X, Wagner DP. Severity stratification and outcome prediction for multisystem organ failure and dysfunction. World J Surg.1996;20:401– 405
DOI: 10.1542/peds.104.4.868
1999;104;868
Pediatrics
Ruttimann
James P. Marcin, Murray M. Pollack, Kantilal M. Patel, Bruce M. Sprague and Urs E.
Prognostication and Certainty in the Pediatric Intensive Care Unit
Services
Updated Information &
http://pediatrics.aappublications.org/content/104/4/868
including high resolution figures, can be found at:
References
http://pediatrics.aappublications.org/content/104/4/868#BIBL
This article cites 17 articles, 2 of which you can access for free at:
Subspecialty Collections
http://www.aappublications.org/cgi/collection/correction
Correction
sub
http://www.aappublications.org/cgi/collection/emergency_medicine_
Emergency Medicine
http://www.aappublications.org/cgi/collection/critical_care_sub
Critical Care
following collection(s):
This article, along with others on similar topics, appears in the
Permissions & Licensing
http://www.aappublications.org/site/misc/Permissions.xhtml
in its entirety can be found online at:
Information about reproducing this article in parts (figures, tables) or
Reprints
http://www.aappublications.org/site/misc/reprints.xhtml
DOI: 10.1542/peds.104.4.868
1999;104;868
Pediatrics
Ruttimann
James P. Marcin, Murray M. Pollack, Kantilal M. Patel, Bruce M. Sprague and Urs E.
Prognostication and Certainty in the Pediatric Intensive Care Unit
http://pediatrics.aappublications.org/content/104/4/868
located on the World Wide Web at:
The online version of this article, along with updated information and services, is
by the American Academy of Pediatrics. All rights reserved. Print ISSN: 1073-0397.
![TABLE 4.Health Care Providers’ First and Second Day MeanDegree of Certainty (267 Patients, 31 Deaths [11.61%])](https://thumb-us.123doks.com/thumbv2/123dok_us/9521700.1481347/5.587.101.534.34.252/table-health-providers-second-meandegree-certainty-patients-deaths.webp)
