An Efficient Fuzzy Clustering Algorithm
Based on Modified K-Means
D.Vanisri1*,
Department of Computer Technology, Kongu Engineering College, Perunudai-638 052, Tamilnadu,, INDIA
Dr.C.Loganathan2
2Principal, Maharaja Arts and Science College, Coimbatore, Tamilnadu, INDIA
Abstract
Fuzzy K-means clustering algorithm is very much useful for exploring the structure of a set of patterns, especially when the clusters are overlapping. K-means algorithm is simple with low time complexity, and can process the large data set quickly. But conventional K-means algorithm cannot get high clustering precise rate, and easily be affected by clustering center random initialized and isolated points. This paper proposes an algorithm to compute initial cluster centers for K-means clustering. A cutting plane is used to partition the data in a cell that divides cell in to two smaller cells. The plane is perpendicular to the data axis with high variance and is intended to reduce the sum squared errors of the two cells while at the same time keeping the two cells apart. Cells are partitioned one at a time till the number of cells equals to the predefined number of clusters, K. The centers of the K cells become the initial cluster centers for K-means. The experimental results suggest that the proposed algorithm is effective, converge to better clustering results than those of the random initialization method. The research also indicated the proposed algorithm would greatly improve the likelihood of every cluster containing some data in it. The research also indicated the proposed algorithm would greatly improve the likelihood of every cluster containing some data in it
Keywords: Clustering, Fuzzy C-Means, Fuzzy Clustering Algorithm.
1. Introduction
Clustering is the task of dividing data points into homogeneous classes or clusters so that items in the same class are as similar as possible and items in different classes are as dissimilar as possible. Clustering is a form of data compression, where a large number of samples are converted into a small number of representative prototypes or clusters. An ideal clustering algorithm classifies data such that samples that belong to a cluster are close to each other while samples from different clusters are further away from each other.
In non-fuzzy or hard clustering, data is partitioned into crisp clusters, where each data point belongs to exactly one cluster. Whereas in fuzzy clustering technique, the data points can belong to more than one cluster, and associated with each of the points are membership grades which indicate the degree to which the data points belong to the different clusters. In real applications, fuzzy clustering is often best suited as there is often no sharp boundary between clusters for the data. In fuzzy clustering, membership degrees between zero and one are used instead of crisp assignments of the data to clusters.
There are various algorithms for clustering approaches. K-means is a unique and effective algorithm, based on a given number of clusters the algorithm iterates to find best clusters for the objects. Although K-means algorithm is simple and can be used for a wide variety of data types, it is highly sensitive to initial positions of cluster centers.
parameters, makes clustering results not easily plunged partly optimism. Thus this paper proposes an enhanced k means algorithm which can produce better results than the conventional K- means.
2. Related work
The (N. Vlassis et al., 2003) proposed the global k-means clustering algorithm that constructs initial centers by recursively partitioning data space into disjoint subspaces using a k-d trees method. The cutting hyper plane used in the method is defined as the plane that is perpendicular to the highest variance axis derived by principal component analysis. The partitioning is performed until each of the leaf nodes (bucket) contains less than a predefined number of data instances (bucket size) or the predefined number of buckets has been created. The centroids of data in the final buckets are then used as initial centers for K-means.
New approach (Giovanna Castellano , 2003) proposed an approach for automatic discovery of transparent diagnostic rules from data. The approach depends on a fuzzy clustering technique that is defined by three sequential steps. Firstly, the Crisp Double Clustering algorithm is applied on available symptoms measurements, to provide a set of representative multidimensional prototypes that are further clustered onto each one-dimensional projection. The resulting clusters are used in the second step, in which a set of fuzzy relations are defined in terms of transparent fuzzy sets. In the final step, the derived fuzzy relations are applied to define a set of fuzzy rules, which set up the knowledge base of a fuzzy inference system that can be used for fuzzy diagnosis. The experiments were applied to the Aachen Aphasia dataset as a real-world benchmark and compared with related work.
Fuzzy Logic formularizes an intuitive theory based on human reason of approximation. It differs from the traditional logic methods where crisp or exact results are expected. The concept of fuzzy logic was first put forth by (U. Maulik, 2000). Fuzzy Logic is used in problems where the results can be approximate rather than exact. Hence, the principles of fuzzy logic suit well to clustering problems. The results are determined by some degree of closeness to true or to false. Clustering problems generally measure some kind of closeness between similar objects. Fuzzy Logic approach is used in various fields to provide flexibility to classical algorithm, due to its applicability to problems that do not require hard solutions.
K-means is one of the widely used clustering algorithms and has been used in various fields of science and technology. The major drawback of the k-means algorithm is that it produces empty clusters depending on initial center vectors. This problem is considered insignificant for static execution of the k-means and it can be easily solved by executing the algorithm for a number of times. But when k-means is presented as an integral part of some higher level application, this empty cluster problem may produce irregular behavior of the system and may lead to significant performance degradation. Next (R. Dubes, A. Jain, 1998) presents a modified version of the k-means algorithm that efficiently eliminates this empty cluster problem. Based on the experimental results of the proposed algorithm, it is observed that there is no performance degradation due to incorporated modification.
It is very difficult to build a perfect classifier with 100% prediction accuracy because of the complexity of biomedical classification problems. Hence it is better to build an effective Decision Support System (DSS), which should not only predict unseen samples accurately, but also work in a human-understandable way. Then (Yuanchen He et al, 2006) proposed a novel adaptive Fuzzy Association Rules (FARs) mining algorithm, named FARM-DS, to build such a DSS for binary classification problems in the biomedical domain. Four steps are executed to mine FARs, in the training phase, which are thereafter used to predict unseen samples in the testing phase. The experiment of the new FARM-DS algorithm is conducted on two publicly available medical datasets. The experimental results show that FARM-DS is very significant in terms of prediction accuracy. Moreover, the mined FARs provides strong decision support on disease diagnoses due to their easy interpretability.
3.Methodology
The K-means clustering algorithms are the simplest methods of clustering data. This is a widely-used clustering algorithm, owing to its simple and convenience.
Algorithm description of K-means is as follows:
4. These centroids of the clusters are updated correctly. 5. The process is repeated until these centroids do not change. There are certain disadvantages in this K-means algorithm. They are
K-means only can be used under the situation that the average value has been defined. This may not suit some applications, such as mobile objects clustering, data concerned about classified attributes.
K must be given by users. Besides, it's sensitive to the initial value, and can lead to different clustering results with different initial value.
K-means is not fit to non-convex cluster, or big difference on size. Besides, it's sensitive to "noise" and isolated points data, a little data like this can make huge effects on average values.
So to overcome these draw backs, a modified K- means has to be incorporated.
A. Enhanced K- Means Approach
This proposed approach mainly focuses on the initialization of cluster centers for K-means. The proposed algorithm follows a novel approach that performs data partitioning along the data axis with the highest variance. The approach has been used successfully for color quantization [8]. The data partitioning tries to divide data space into small cells or clusters where intercluster distances are large as possible and intracluster distances are small as possible.
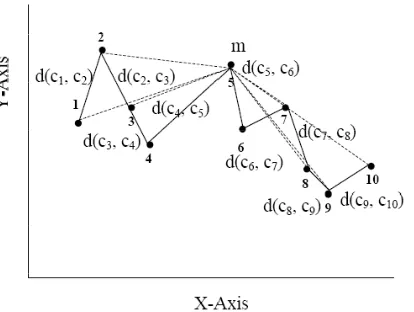
Fig. 1 Diagram of ten data points in 2D, sorted by its X value, with an ordering number for each data point
Consider ten data points in 2D data space as shown in figure 1. The aim is to partition the ten data points into two disjoint cells where the sum of total clustering errors of the two cells is minimum as represented in figure 2. Consider a cutting plane perpendicular to X-axis used to partition the data. Let C1 and C2 be the first cell and the second cell respectively and and be the cell centroids of the first cell and the second cell, respectively. The total clustering error of the first cell is thus computed by:
,
and the total clustering error of the second cell is thus computed by:
,
Fig. 2 Diagram of partitioning a cell of ten data points into two smaller cells, a solid line represents the intercluster distance and dash lines represent the intracluster distance
Fig. 3 Illustration of partitioning the ten data points into two smaller cells using m as a partitioning point. A solid line in the square represents the distance between the cell centroid and a data in cell, a dash line represents the distance between m and data in each cell and a solid dash line represents the distance between m and the data centroids in each cell.
The partition could be done using a cutting plane that passes through m. Thus
, 1 , 1,
, 2 , 2,
, , , . | |
m is considered as the partitioning data point where |C1| and |C2| are the numbers of data points in cluster C1 and C2
respectively. The total clustering error of the first cell can be minimized by reducing the total discrepancies between all data in first cell to m, which is computed by:
,
The same argument is also true for the second cell. The total clustering error of the second cell is minimized by reducing the total discrepancies between all data in second cell to m, which is computed by the following equation.
,
Where , is the distance between m and each data in each cell. Therefore the problem to minimize the sum of total clustering errors of both cells can be transformed into the problem to minimize the sum of total clustering error of all data in the two cells to m.
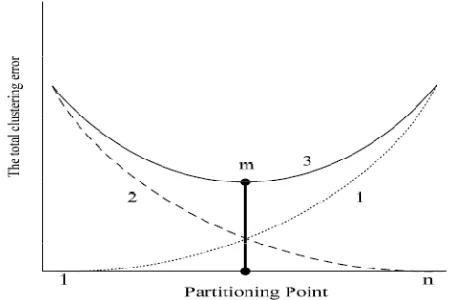
The relationship between the total clustering error and the clustering point is illustrated in Fig. 4, where the horizontal-axis represents the partitioning point that runs from 1 to n where n is the total number of data points and the vertical-axis represents the total clustering error. When m=0, the total clustering error of the second cell is equal to the total clustering error of all data points while the total clustering error of the first cell is zero. On the other hand, when m=n, the total clustering error of the first cell equals to the total clustering error of all data points, while the total clustering error of the second cell is zero.
Fig. 4 Graphs depict the total clustering error, lines 1 and 2 represent the total clustering error of the first cell and second cell, respectively, Line 3 represents a summation of the total clustering errors of the first and the second cells.
Fig. 5 Illustration of ten data points, a solid line represents the distance between adjacent data along the X-axis and a dash line represents the distance between m and any data point
The task of approximating the optimal point (m) in 2D is thus replaced by finding m in one-dimensional line as shown in Fig. 6.
Fig. 6 Illustration of the ten data points on a one-dimensional line and the relevant Dj
The point (m) is therefore a centroid on the one-dimensional line which is shown in Fig. 6 yields
, ,
Let
∑ and a centroidDist can be computed by:
∑
Therefore, the total clustering errors of the two smaller cells partitioned by the plane passing through the data point nearest to centroidDist are similar. The X-axis or Y-axis can be possible chosen as the principal axis for data partitioning. However, data axis with the highest variance will be chosen as the principal axis for data partitioning. The reason is to make the inter distance between the centers of the two cells as large as possible while the sum of total clustering errors of the two cells are reduced from that of the original cell. To partition the given data into k cells, we start with a cell containing all given data and partition the cell into two cells. Later on we select the next cell to be partitioned that yields the largest reduction of total clustering errors (or Delta clustering error). The sum of Total clustering errors of the two sub cells of the original is defined as Total clustering error of the original cell. This is done so that every time a partition on a cell is performed, it will minimize the sum of total clustering errors for all cells.
2. Sort all data in the cell c in ascending order on each attribute value and links data by a linked list for each attribute.
3. Compute variance of each attribute of cell c. Choose an attribute axis with the highest variance as the principal axis for partitioning.
4. Compute squared Euclidean distances between adjacent data along the data axis with the highest variance
, and compute the ∑
5. Compute centroid distance of cell c:
∑
Where dsumi is the summation of distances between the adjacent data
6. Divide cell c into two smaller cells. The partition boundary is the plane perpendicular to the principal axis and passes through a point m whose dsumi approximately equals to centroidDist. The sorted linked lists of cell c are scanned and divided into two for the two smaller cells accordingly
7. Compute Delta clustering error for c as the total clustering error before partition minus total clustering error of its two sub cells and insert the cell into an empty Max heap with Delta clustering error as a key. 8. Delete a max cell from Max heap and assign it as a current cell.
9. For each of the two sub cells of c, which is not empty, perform step 3 - 7 on the sub cell. 10. Repeat steps 8 - 9. Until the number of cells (Size of heap) reaches K.
11. The centroids of cells have to be used in max heap as the initial cluster centers for K-means clustering.
4. Experimental Results
The experiments for the proposed algorithm are evaluated on iris and wine data sets from UCI Machine Learning Repository (C.l. Blake, C.J. Merz, 1998). The clustering results of the K-Means algorithm using random initial centers and initial centers derived by the proposed algorithm is compared based on the observed results.
The measurements used for comparing the clustering results are
1. The sum of the squared error distances between the data and the centroid of their clusters (SSE). The SSE results on 10 UCI data sets are shown in Fig. 7
2. Entropy to measure impurity of each cluster
log
Fig. 7 SSE Results on Iris and Wine Based On Number of Clusters
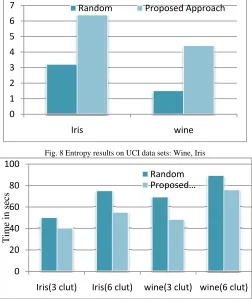
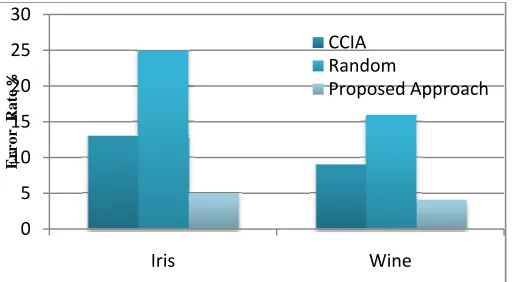
The averaged Entropy for all clusters is then used for comparison. The averaged Entropy of iris and wine in UCI data sets are shown in Fig. 8. From the two measurements we can see that the proposed algorithm outperform the random initialization algorithm in most cases. The proposed algorithm also performs much better than the random initialization algorithm as the required number of clusters increases. The execution times of K-Means using proposed algorithm is also much less than the average execution times of K-Means when using random initialization algorithm for iris and wine data sets. This may be due to the initial cluster centers generated by the proposed algorithm are quite close to the optimal solutions. The execution time comparisons for the two UCI data sets are shown in Fig.9. The clustering results from proposed algorithm with the results from the Clustering Center Initialization Algorithm (CCIA) are also compared. Fig. 10 shows the clustering results in terms of classification error (%) when a class of data in a cluster is predicted to be the majority class of data in the cluster.
It can be seen that proposed algorithm performances are comparable to the CCIA. However, the proposed algorithm is much simpler to implement than CCIA.
Fig. 8 Entropy results on UCI data sets: Wine, Iris
0 2 4 6 8 10
Iris (3 clut) Iris (6 clut) wine(3 clut)
Random Proposed Approach
0 1 2 3 4 5 6 7
Iris wine
Random Proposed Approach
0 20 40 60 80 100
Tim
e in
secs
Fig. 10 Classification error comparisons among the three methods, Cluster Center Initialization Algorithm (CCIA), Random Initialization Algorithm and Proposed Algorithm
5. Conclusion
A novel initialization algorithm of cluster centers for K means algorithm has been proposed. The algorithm was based on the data partitioning algorithm used for color quantization. A data set was partitioned into k clusters in such a way that the sum of the total clustering errors for all clusters was reduced as much as possible while inter distances between clusters are maintained to be as large as possible. The proposed algorithm is very effective, converges to better clustering results and almost all clusters have some data in it. The experimental results show that the proposed algorithm performs better than random initialization and can reduce running time of K-Means significantly for iris and wine datasets. The performances of proposed algorithm are also comparable to the CCIA however the proposed algorithm is much simpler and easier to implement.
References
[1] R. Dubes and A.Jain, “Algorithms for Clustering Data, Prentice-Hall, Englewood Cliffs”, NJ, 1998.
[2] N. Vlassis, A. Likas and J.J. Verbeek, “The Global k-means Clustering algorithm”, Pattern Recognition , Volume 36, Issue 2, pp. 451- 461, 2003.
[3] P.S. Bradley and U.M. Fayyad, “Refining initial points for K-means Clustering”, Proceeding of The Fifteenth International Conference on Machine Learning, Morgan Kaufmann, San Francisco, CA, 1998, pp. 91-99.
[4] C.L. Blake, C.J. Merz. UCI Repository of machine learning databases. University of California, Irvine, Department of Information and Computer Science, 1998.
[5] J. Han and M. Kamber, “Data Mining: Concepts and Techniques”, Morgan Kaufmann Publishers, San Diego, 2001.
[6] P. Mitra, C.A. Murthy, S.K. Pal, “Density based multi scale data condensation”, IEEE Trans, Pattern Anal, Machine Intell, 24 (6), pp. 734– 747, 2002.
[7] S. S. Khan and A. Ahmad, “Cluster Center Initialization for K-mean Clustering”, Pattern Recognition Letters, Volume 25, Issue 11, pp. 1293-1302, 2004.
[8] Y. Sirisathitkul, S. Auwatanamongkol and B. Uyyanonvara, “Color image quantization using distances between adjacent colors along the color axis with highest color variance”, Pattern Recognition Letters, Volume 25, Issue 9, pp. 1025-1043, 2004.
[9] Yuanchen He, Yuchun Tang, Yan-Qing Zhang, Rajshekhar Sunderraman, “Adaptive Fuzzy Association Rule mining for effective decision support in biomedical applications”, International Journal of Data Mining and Bioinformatics Vol. 1, No.1 pp. 3 – 18, 2006. [10] Pratima Gautam, Neelu Khare, K. R. Pardasani, “A Model for Mining Multilevel Fuzzy Association Rule in Database”, Journal of
Computing, Vol. 2, Issue 1, January 2010.
[11] Giovanna Castellano,Anna M. Fanelli, Corrado Mencar, "A Fuzzy Clustering Approach for Mining Diagnostic Rules", IEEE transaction in 2003.
[12] W. Pedrycz, J.V. de Oliveira, “Optimization of Fuzzy Models”, IEEE Trans. on Systems, Man and Cybernetics B, vol. 26 No. 4, 1996. [13] D. Nauck, R. Kruse, “Obtaining Interpretable Fuzzy Classification Rules from Data”, Artificial intelligence in medicine”, vol 16, No 2, pp
129-147, 1999.
[14] Jim C. Bezdek, “Fuzzy Mathematics in Pattern Classification.” Cornell University, Ithaca, 1973.
[15] S. L. Chiu. “Fuzzy model identification based on cluster estimation” Journal of Intelligent and Fuzzy Systems, 1994.
[16] S. Bandyopadhyay, U. Maulik, and M. K. Pakhira, “Partitional clustering using simulated annealing with probabilistic redistribution,” in
International Journal Pattern Recognition and Artificial Intelligence, vol. 15, pp. 269--285, 2001.
[17] U. Maulik and S. Bandyopadhyay, “Genetic algorithms based clustering technique,” in Pattern Recognition, vol. 33, pp. 1455- 1465, 2000.
0 5 10 15 20 25 30 Iris Wine Error Rate % CCIA Random
Biographical notes:
D. Vanisri has received the Master of Science in Mathematics in 2001 from Madurai Kamaraj University. Then she completed her Master of Philosophy in Mathematics in the year 2003. She has presented many papers in national and international conferences and also guided many UG projects. She has published a paper in international journal. Now she is doing research in the field of Fuzzy clustering and rule mining at Mother Terasa Women’s University, Kodaikannal. Currently she is working as a Lecturer in the Department of Computer Technology and Applications, Kongu Engineerring College, Tamilnadu.