825 | P a g e
AN OPTIMISTIC ANALYSIS OF
BIG DATA BY USING HDFS
Manjunath.N.Wali
1, K SreePrasanna
2, Surabhi L
31,2,3
Asst Professor, Dept of CSE, Sphoorthy Engineering College. Hyderabad (India)
ABSTRACT
This paper is an effort to present the essential understanding of BIG DATA is and its efficiency to an
organization from the performance perspective. Along-with the introduction of BIG DATA, the important
parameters and attributes that make this emerging concept attractive to organizations has been highlighted.
You can use this document as both an instruction set and as a template into which you can type your own text.
Nowadays, excellence volumes of data from individualize resources such as sensory devices, social media
networks and information serving devices are induce. This kind of large data is called as big data and about
80% of the data is now in unstructured formats. Hadoop is an open source platform that expands computing of
big data. Hadoop is made up of two components such as Hadoop distributed file system (HDFS) and Map
Reduce engine. HDFS is made up of physically distributed Data Node and access of these Data Node service is
known as Name Node. Map Reduce is a minimization technique which constructs use of sorting, shuffling and
reducing. The paper also evaluates the difference in the challenges faced by a small organization as compared
to a medium or large scale operation and therefore the differences in their approach and treatment of BIG
DATA and also introduces the Big Data technology, framework of Hadoop, architecture of Hadoop and its
efficient analysis.
Keywords:
Hadoop, Analysis, Big Data, HDFS, Map Reduce.
I.
INTRODUCTION
Big Data analysis is the way of examining huge data sets containing a combo of data type’s i.e. big data to
uncover hidden patterns, market, trends, and customer’s choice and other efficient business information.
Big
data is the availability of a large amount of data which becomes difficult to store, process and mine using atraditional database mainly because of the data available is large, complex, unstructured and rapidly changing.
This is probably one of the main reasons why the concept of big data was first embraced by online firms like
Google, eBay, Face book, LinkedIn etc. There is a specific reason as to why big data was first appreciated by
the online firms and start-ups as mentioned above. These companies were built around the concept of using
rapidly changing data and did not probably face the challenge of integrating the new and unstructured data with
the already available ones. If we look at the challenges regarding big data being faced by the online firms and
the start-ups we can highlight the following:
i. Volume: The largeness of the data available made it a challenge as it was neither possible nor efficient to
826 | P a g e
ii. Variety: As compared to the earlier versions, where data was available in one or two forms, and the currentversions would mean data being available additionally in the form of pictures, videos, tweets etc.
iii. Velocity: Increasing use of the online space meant that the data that was available was rapidly changing and
therefore had to be made available and used at the right time to be effective. Big data is analyzed by one of the
best-known methods for turning raw data into useful information is by what is known as Map Reduce. Map
Reduce is a method for taking a large data set and performing computations on it across multiple computers, in
parallel. It serves as a model for how to program, and is often used to refer to the actual implementation of this
model. In essence, Map Reduce consists of two parts. The Map function does sorting and filtering, taking data
and placing it inside of categories so that it can be analyzed. The Reduce function provides a summary of this
data by combining it all together. While largely credited to research which took place at Google, Map Reduce is
now a generic term and refers to a general model used by many technologies.
II.
ARCHITECTURE
Big Data Solutions Architecture is an architecture domain that aims to address specific big data problems and
requirements. Big data solutions architects are skilled to describe the structure and generally behavior of a big
data solution and how that big data solution can be delivered using big data technology such as Hadoop. The
core of Apache Hadoop consists of a storage part, known as Hadoop Distributed File System (HDFS), and a
processing part called Map Reduce. Hadoop splits files into large blocks and distributes them across nodes in a
cluster. Formatting unstructured data makes it appropriate for data mining and analysis. Hadoop is the core
platform for structuring Big Data. It also solves the problem of formatting it for analytic purposes. Hadoop uses
a distributed computing architecture consisting of many servers using commodity hardware.
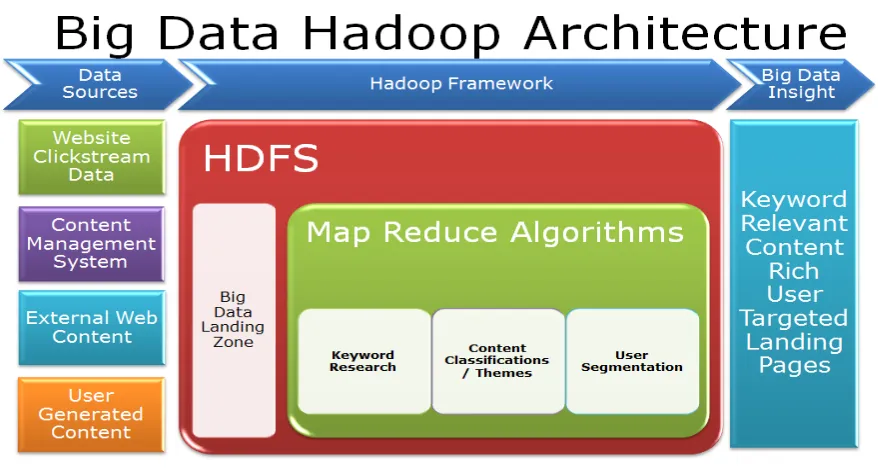
Fig 1: Big Data Hadoop Architecture.
Big data may be new for startups and for online firms, but several large firms view it as amazing they have been
wrestling with for a while. Some managers appreciate the innovative nature of big data, but more find it
827 | P a g e
focused on the variety of data, not its volume, both today and in three years. The main goal and potential rewardof Big Data initiatives is the ability to analyze diverse data sources. The second common objective of big data
technologies and solutions is time reduction. Macy’s merchandise pricing optimization application provides a
classic example of reducing the cycle time for complex and large-scale analytical calculations from hours or
even days to minutes or seconds. Big data can be used for improving the process efficiency also. An excellent
use of big data in this regard is cricket especially with the advent of the Indian Premier League (IPL). Not only
are matches analyzed using the data available in order to formulate future strategies but even minute details like
the performance of a bowler against a particular batsman and that too on a particular ground under certain
conditions are being made available for the stakeholders to improve their efficiency.
III.
ANALYSIS
OF
BIG
DATA
IN
HADOOP
Big Data study allow to a large variety of use cases reach across multiple industries. Numerous data today is not
natively in systematic format. Data analysis, retrieval, organization and modeling are the essential challenges.
Analysis of data is a process of auditing, converting and cleaning and designing data with the intent of detecting
useful meaning information and decision support system making and it has multiple facts and approaches under
a variety names in science and social domains. Big data is mostly generated from social media websites,
sensors, devices, video/audio, networks, log files and web, and much of it is generated in real time and on a very
large scale. Big data analytics is the process of examining this large amount of different data types, or big data,
in an effort to uncover hidden patterns, unknown correlations and other useful information. Big data analysis
specifically allows market analysts, researchers and business users to develop deep insights from the available
data, resulting in numerous business advantages. Business users are able to make a precise analysis of the data
and the key early indicators from this analysis can mean fortunes for the business.
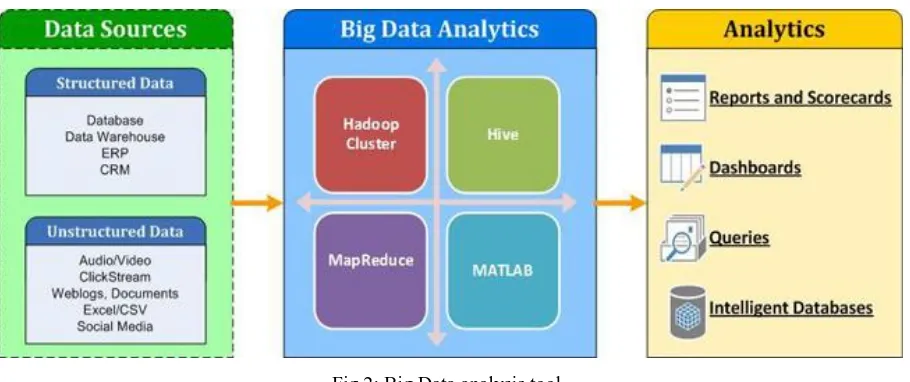
Fig 2: Big Data analysis tool.
The Big Data analytics and detail data analysis process at different stages of batch process shown in figure 2.
Big Data processing part is mostly done using Hadoop / PIG technology with classical ETL logic
implementation. The Map Reduce model that Hadoop provides can linearly scale to the processing by adding
machines to the Hadoop cluster. Cloud computing resources (Amazon, EMR) is common approach to the
828 | P a g e
amount of carefully sampled data that fits into a single system capacity. The detail data analysis is part usuallyinvolve data, data virtualization, data preparation model, learning model evaluation and analysis.
IV.
BIG
DATA
ANALYSIS
BY
MAP
REDUCE
Hadoop map reduce is a software framework for easily writing applications, Process vast amount of data in
parallel process on Large clusters of commodity hardware in Fault Tolerant manner. Map reduce generally
splits the input data set into indecent chunks which processed by the map tasks in a completely parallel manner,
and the Frame work sorts the out-put of map, which are then input to reduce tasks. And both input and out-put
are stored in a file system. The map reduce frame work helps developers divide a query into steps, divide dataset
into chunks and run those step pattern separate hosts. The map reduce model consist of two functions, map ( )
and reduce ( ). Map Reduce libraries written in numerous programming languages, with discrete levels of
optimization. The name Map Reduce originally point out to the proprietary Google technology.
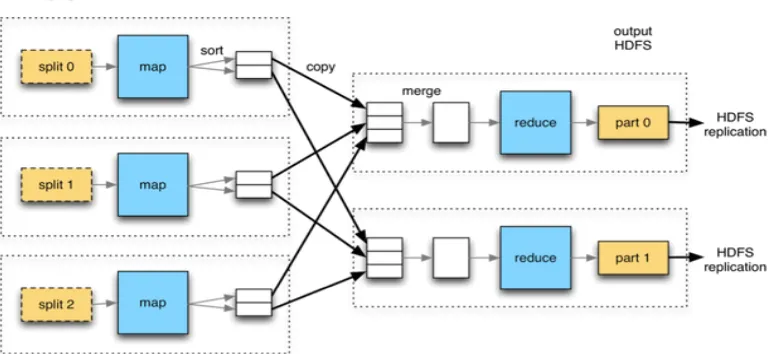
Fig 3: Map Reduce Working
A) Map Reduce Components
Name Node- the Name Node bearing by clients of the HDFS to locate information specifically within
the file system and feed updates for data they have generally added, deleted and manipulated.
Data Node- Data Node serves two functions. It contains a section of data in HDFS and acts as compute
platform for specifically running jobs and other resort the local data within HDFS.
Job Tracker- Job Tracker schedules jobs and tracks the assign job to task tracker. Task Tracker- Tracks the tasks and reports to the job tracker.
B) Map Reduce Process
Map Reduce boldness the general instability problems promote in homegrown distributed systems. The Map
Reduce splits into multiple tasks i.e. Mapper and Reducer. Map Reduce has a master and Slaves. The master is
generally recorded in “Masters” configuration file and slaves are generally recorded in “Slaves” and they
829 | P a g e
Mapper: The Mapper maps the input key/ values pairs to a set of intermediate key/ values pairs. For example the sorter i.e. (the boy asking to the old man how old are you) only concerned about sorting people into
accurate groups ( in case age). In Map Reduce to take the boy is known as MAPPER.
Reducer: Reducer reduces set of interpose values which portion a key to a smaller set of values. The Reducer has mainly three phases i.e. Shuffle, Sort and Secondary sort.
a) Practitioner- Practitioner allows you to distribute how outputs from map stage are sent to reducers. The key
is used to obtain the partition, ideally by a hash function and hash Practitioner is the default Practitioner.
b) Reporter-Reporter is a skill for Map Reduce function to report mainly the progress. Mapper and Reducer
utilization can use reporter to report progress.
c) Output Collector: Output Collector facility supplied the Map Reduce framework to collect data output by the
mapper or reducer.
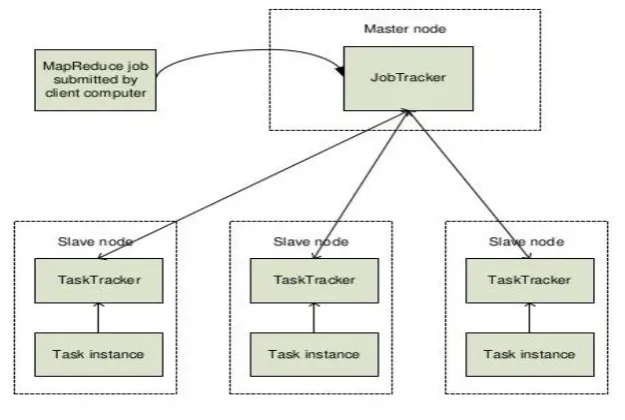
Fig 4: Map Reduce Working with Master and Slave Nodes
V.
CONCLUSION
Hadoop is an open platform to process extensive among of big data. Hadoop supply distributed storage known
Hadoop distributed file system (HDFS) and expand generally through computing through a programming model
called Map reduces. Map Reduce dividing the whole program and executed separately. Big data analysis tools
as map reduce and HDFS. Ensure to help chamber/organizations better group their client and the market place,
for better business decisions. To process the wide amount of data accessible drives science progress, innovation
and to search new ways to some problems, which are considered impossible in the past. The need to process
general enormous quantities of data has never been greater. Not only are terabyte- and petabyte-scale datasets
rapidly becoming commonplace, but there is consensus that great value lies buried in them, waiting to be
unlocked by the right computational tools. In the commercial sphere, business intelligence, driven by the ability
to gather data from a dizzying array of sources. Big Data analysis tools like Map Reduce over Hadoop and
HDFS, promises to help organizations better understand their customers and the market place, hope fully
830 | P a g e
for batch operations over large amounts of data, such a style of computation would likely result in insufficientuse of resources. In Hadoop, for example, map and reduce tasks have considerable start-up costs.
REFERENCES
[1] Dr. Rakesh Rathi,Sandhya Lohiya, “Big Data and Hadoop”, International Journal of Advanced Research
inComputer Science & Technology (IJARCST 2014), Vol. 2, Issue 2, Ver. 2 (April - June 2014), pp
214-217.
[2] Twinkle Antony, Shaiju Paul, "Addressing big data with hadoop”, International Journal of Computer
Science and Mobile Computing, Vol.3 Issue.2, February- 2014, pp 459-462.
[3] Vinod Sharma, N.K. Joshi, “The Evolution of Big Data Security through Hadoop Incremental Security
Model”, International Journal of Innovative Research in Science, Engineering and Technology, Vol. 4, Issue 5, May 2015,pp 3489-3493.
[4] Bhawna Gupta, Dr. Kiran Jyoti, " Big Data Analytics with Hadoop to analyze Targeted Attacks on
Enterprise Data" International Journal of Computer Science and Information Technologies, Vol. 5 (3) ,
2014, pp 3867- 3870.
[5] Poonam S. Patil, Rajesh. N. Phursule, " Survey Paper on Big Data Processing and Hadoop Components",
[6] International Journal of Science and Research (IJSR), Volume 3 Issue 10, October 2014,pp 585-590. [8]
Suman Arora, Dr.Madhu Goel, " Survey Paper on Scheduling in Hadoop", Volume 4, Issue 5, May 2014,
pp 812-815.
[7] Mehak, Gagandeep, " Improving Data Storage Security in Cloud using Hadoop", Journal of Engineering
Research and Applications, ISSN : 2248-9622, Vol. 4, Issue 9( Version 3), September 2014, pp.133-138.
[8] Silky kalra, Anil Lamba,'' A review on HAdoop Map Reduce- A job Aware Scheduling Technology",
International Journal of computational Engineering Research(IJCER), ISSN (e): 2250 – 3005, Vol, 04 ,
Issue, 5 , May – 2014, pp 36-40.
[9] Harshitha R, Rekha G S, Dr. H S Guruprasad, "A Survey on Scheduling Techniques in Hadoop" , IJEDR ,
Volume 3, Issue 1, 2014, pp 248-254.
[10] VinayakBorkar, Michael J. Carey, Chen Li, Inside “Big Data Management”:Ogres,Onions,orParfaits?,
EDBT/ICDT 2012 Joint Conference Berlin, Germany,2012 ACM 2012, pp 3-14.
[11] GrzegorzMalewicz, Matthew H. Austern, Aart J. C. Bik, James C.Dehnert, Ilan Horn, NatyLeiser, and GrzegorzCzajkowski,Pregel: A System for Large-Scale Graph Processing, SIGMOD‟ 10,–11,2010,pp135-145June. [17] Hadoop,“PoweredbyHadoop,”http://wiki.apache.org/hadoop/Po weredBy.
[12] W. Zeng, M. S. Shang, Q. M. Zhang, et al., “Can Dissimilar Users Contribute to Accuracy and Diversity of
Personalized Recommendation?,” International Journal of Modern Physics C, vol. 21, no. 10, pp.
1217-1227, June 2010.
[13] T. C. Havens, J. C. Bezdek, C. Leckie, L. O. Hall, and M. Palaniswami, “Fuzzy c-Means Algorithms for Very Large Data,” IEEE Trans. on Fuzzy Systems, vol. 20, no. 6, pp. 1130-1146, December 2012.
[14] Z. Liu, P. Li, Y. Zheng, et al., “Clustering to find exemplar terms for keyphrase extraction,” in Proc. 2009