R E S E A R C H
Open Access
A multilevel analysis of prenatal care and birth
weight in Kenya
Japheth Osotsi Awiti
Abstract
The paper investigates the effect of adequate use of prenatal care on birth weight in Kenya using data from the Kenya Demographic and Health Survey of 2008–2009 together with additional administrative data. Both a single–level model and a multi–level model are estimated. The estimation strategy controls for potential sample selection bias, potential endogeneity of prenatal care, and potential unobserved heterogeneity. The results indicate that adequate use of prenatal care increases birth weight, holding other factors constant. We further observe that the single–level model overstates the effect of prenatal care on birth weight. The results imply that infant health can be improved by using prenatal care adequately. The study calls for the pursuit of policies that encourage adequate use of prenatal care by expectant mothers such as ensuring availability of skilled health care providers such as doctors and nurses at prenatal care clinics, reducing the average distances mothers have to cover when seeking prenatal care services, intensifying education of females as a way of empowering them to be able to make the right choices regarding when to seek prenatal care and from whom, and increasing income opportunities for households.
Keywords: Birth weight; Prenatal care; Multilevel analysis; Kenya
Background
The study of infant healtha is important because many health problems that we observe in adult life originate in the early years of life [1]. Infant health can be measured at both the individual and population levels. Examples of indicators of infant health at the population level include neonatal mortality rate, post–neonatal mortal-ity rate, infant mortalmortal-ity rate, birth weight distribution, and gestational age distribution [2,3]. Examples of infant health indicators at the individual level include child sur-vival, birth weight, Apgar score, gestation, disability, and nutritional indicators [4,5].
Table 1 gives data on some key infant health indica-tors for selected Sub–Saharan African countries and other regions.
A closer look at the data shows that most of the Sub-Saharan African countries have poor infant health out-comes. For example, Kenya had a neonatal mortality rate of 27 per 1,000 live births in 2012 while Tanzania had an infant mortality rate of 38 per 1,000 live births in 2012. Further, 8% of the infants in Kenya and 10% of the infants born in Tanzania have low–birth weight. The table also
Correspondence: [email protected]
School of Economics, University of Nairobi, University Way, Nairobi, Kenya
shows that about 13% of the infants born in the African region have low–birth weight as compared to only 5% in Western Pacific, 7% in Europe and 8% in the Americas. A higher percentage of infants with low–birth weight are, however, found in South–East Asia and the Eastern Mediterranean region as compared to Africa.
Additional indicators of infant and child health for Kenya show that 85 of every 1,000 infants born alive in Kenya in 2010 were likely to die before reaching their fifth birthday, 15% of all under–five deaths in Kenya in 2010 were due to premature births, and about 16% of children under 5 years of age in Kenya are underweight [8].
There is, therefore, need to find out how infant health can be improved in Kenya. This study investigates one way in which this can be done.
Although there are many indicators of infant health, this study focuses on birth weight. Since birth weight repre-sents the outcome of the gestation period, it is a good measure of infant health at birth [3]. Weight at birth of less than 2,500 grams is termed to be low [9]. Low birth weight is associated with various adverse health outcomes such as fetal and neonatal morbidity and mortality, impaired cog-nitive development, and the advent of chronic diseases in later life [10,11].
Table 1 Some key infant health indicators for selected Sub-Saharan Africa countries
Country/region Neonatal mortality rate Infant mortality rate Low birth weight (per 1,000 live births) (per 1,000 live births) newborns (%) 2000 2009 2012 2000 2009 2012 2000–2009*
Angola 48 42 45 126 98 100 12
Botswana 32 22 29 66 43 41 13
Cameroon 37 37 28 96 95 61 11
Central African Republic 47 45 41 119 112 91 13
Democratic Republic of Congo 51 51 44 126 126 100 10
Eritrea 23 17 18 58 39 37 14
Ethiopia 43 35 29 91 67 47 20
Gabon 28 25 25 61 52 42 14
Gambia 37 32 28 93 78 49 20
Ghana 35 26 28 68 47 49 13
Kenya** 32 27 27 66 55 49 8
Lesotho 42 33 45 86 61 74 13
Liberia 51 37 27 133 80 56 14
Madagascar 31 21 22 65 40 41 16
Malawi 37 30 24 99 69 46 14
Mauritius 12 9 9 16 13 13 14
Mozambique 47 41 30 123 96 63 15
Namibia 26 19 18 50 34 28 16
Nigeria 46 39 39 114 86 78 12
Senegal 36 31 24 61 51 45 19
Sierra Leone 56 49 50 150 123 117 14
Swaziland 26 20 30 71 52 56 9
Togo 36 32 33 78 64 62 12
Uganda 34 31 23 94 79 45 14
United Republic of Tanzania 39 34 21 86 68 38 10
Zambia 35 29 29 99 86 56 11
Zimbabwe 27 34 39 69 56 56 11
WHO Region
African 41 36 32 98 80 63 13
Americas 13 9 8 22 15 13 8
South – East Asia 39 31 27 62 45 39 24
European 10 7 6 19 12 10 7
Eastern Mediterranean 35 30 26 65 54 44 21
Western Pacific 17 11 9 28 18 14 5
*Data is for the latest year available.
**The boldface is to help the reader to quickly locate the Kenyan data in the table. Source: [6,7].
The literature on the determinants of low birth weight is expansive (see, for example, [10-13]). The literature iden-tifies a number of maternal risk factorsb for low birth weight. The factors include historical factors (such as short or long birth interval), demographic factors (such as adolescent mothers), nutritional factors (such as iron deficiency), anthropometric factors (such as low body mass index), medical and pregnancy–related conditions
(such as malaria infection), adverse psychosocial factors, lifestyle–related factors (such as tobacco use), environ-mental tobacco exposure, violence/maternal abuse, infer-tility and in vitro fertilization (IVF) treatment, and health care risks (such as inadequate prenatal care) [10-12].
prenatal care should involve the following activities: pro-vision of appropriate advice on health matters such as nutrition, hygiene, newborn care and safer sex; identifi-cation of expectant women at risk of experiencing preg-nancy complications through appropriate screening and diagnosis; and either the treatment of identified pre– existing illnesses and conditions or, where treatment is not available at the particular health facility, referral to an appropriate health facility that can deal with the identified conditions [14]. Prenatal care can benefit both expectant mothers and their unborn children through identification of expectant mothers at risk of delivering infants with low–birth weight or experiencing complications during delivery and providing appropriate psychosocial, nutri-tional, and medical interventions aimed at reducing such risks [11,16].
Several indicators have been used in the literature to measure prenatal care use. Examples of these indicators include number of prenatal care visits, number of prenatal care visits adjusted for pregnancy length, whether pre-natal care was ever initiated, author–constructed quality index of type of care received, timing of first prenatal care visit, Kessner index of adequacy of prenatal care received, adequacy of prenatal care utilization index, and indexes based on World Health Organization (WHO) recommen-dations for developing countries [17-19].
The World Health Organization (WHO) recommends a minimum of four prenatal care visits at particular intervals, to skilled health personnel (doctors or nurses), for expectant women in developing countries [14]. There is also a recommended timing for each visit. For exam-ple, it is recommended that the first prenatal care visit should be made within the first 16 weeks of pregnancy while the third visit should be made at 32 weeks of preg-nancy [14]. There are further detailed recommendations on what should be done at each visit [14]. It has been shown that the recommendations of WHO regarding pre-natal care use in developing countries are appropriate [15]. In this study, we construct a prenatal care utilization index based on WHO’s recommendations.
A careful look at the literature reveals that there is still controversy over the effectiveness of prenatal care in improving birth weight. Although there are studies which show that prenatal care improves birth weight (see, for example, [3,10,17,19-21]), there are still others that find prenatal care to be ineffective in improving birth weight (see, for example, studies cited in [11]). Yet other studies (see, for example, [22]) only find weak influ-ences of prenatal care on the health of infants. A look at the literature further reveals that there are very few studies in Sub–Saharan Africa investigating the effect of prenatal care on birth weight. Most of the studies cited in the literature also use a single–level model in their analysis.
This study investigates the effect of adequate use of pre-natal care on birth weight in Kenya. The main objective of the study is to, therefore, show how adequate use of pre-natal care affects birth weight in Kenya, controlling for the effects of other potential determinants of birth weight.
Specifically, in the study, we first construct a measure of adequacy of prenatal care use in Kenya following the WHO recommendations. Second, we determine the fac-tors influencing adequate utilization of prenatal care in Kenya. Third, we establish the effect of adequate use of prenatal care on birth weight in Kenya, using both single– level and multi–level analysis. Fourth, by comparing the results of the single–level model and the multi–level model, we attempt to make a theoretical contribution by determining the most appropriate way of modelling the effect of prenatal care on birth weight. Finally, we draw appropriate policy implications from the study findings.
The study contributes to the literature by adding to the studies that find prenatal care to be effective in improv-ing birth weight. It also contributes to the literature by studying a Sub–Saharan African country, Kenya. Finally, unlike previous studies, our study estimates both a single– level model and a multi–level model that links prenatal care use to birth weight and demonstrates that the effects of prenatal care on birth weight are overstated in the single–level model.
Methods
In this section, we present the theoretical framework, the conceptual model used in the analysis, the identification strategy, the empirical model, and a discussion of the data used in the analysis.
Theoretical framework
Following [3,23,24], we assume that an expectant mother, j, maximizes the utility,Uj, obtained from her
consump-tion of various goods and services that have no impact on the health of her unborn child,Xj, and the health status
of her unborn child,Hj. We can represent the expectant
mother’s utility function as follows:
Uj=U(Xj,Hj). (1) We assume that the health status of the unborn child, Hj, is in turn influenced by the adequacy of prenatal care
use,Zj, that affects health directly, other factors,Yj, and
unobservable biological endowments,μj. The health
pro-duction function of the unborn child can, therefore, be represented by the following:
Hj=H(Zj,Yj,μj). (2) The mother is assumed to maximize her utility func-tion subject to the above health producfunc-tion funcfunc-tion and a budget constraint given by:
whereIis exogenous mother’s/household’s income,Pxis
the unit price ofX,Pythe unit price ofY, andPzis the unit
price ofZ.
Following [3], we can manipulate the above equations to obtain the input demand equations shown below,
Xj = X(Px,Py,Pz,Ij,μj) (4) Yj = Y(Px,Py,Pz,Ij,μj) (5) Zj = Z(Px,Py,Pz,Ij,μj) (6)
We can derive the effects of the changes in the prices of the various goods and services on infant health as follows [3]:
dH dPx =
Hz dZ dPx +
Hy dY dPx
(7)
dH dPy =
Hz dZ dPy +
Hy dY dPy
(8)
dH dPz =
Hz dZ dPz +
Hy dY dPz
(9)
whereHzis the marginal product of the health inputZand Hyis the marginal product of the health inputY.
The above equations demonstrate that input prices are correlated with infant health [3]. This is mainly because the changes in input prices result in changes in the quan-tities of inputs used in the production of health. The changes in the quantities of health inputs, in turn, lead to changes in the health status of the infant. There is, there-fore, an indirect effect of input prices on infant health. The consequences for the policy makers here is that some-times health can be changed in the desired direction by pursuing policies that change the prices in the appropriate direction.
Conceptual model
We can develop the conceptual model shown in Figure 1 for the analysis of the effect of prenatal care use on birth weight following [4].
According to the figure, birth weight (a measure of infant health) is influenced by prenatal care use and unob-servable biological endowments of both the mother and the child, including true maternal health status.
Prenatal care use, in turn, is influenced by maternal/ household demographic and socio–economic charac-teristics, community characteristics or environmental factors, prices, and unobservable maternal/household preferences.
Estimation issues
Our objective is to consistently estimate Equation (2) so that we can be able to tell the effects of changes in Z (prenatal care) on H (health status of the infant). Such estimation is straightforward in the absence of challenges.
Depending on how H is measured and on the specific
functional form, all we need to do is find the necessary data and then use the appropriate estimation technique.
Sometimes, however, there are challenges such as the values ofHmissing in the dataset for some of the obser-vations, correlation between the error term in the model andZ, and non–linear interaction betweenZ and some unobservable factors that causes the effect ofZonH to differ amongst population subjects [25-27]. These chal-lenges pose difficulties to the estimation process and have to be addressed if we are to get consistent estimates. The challenges may call for use of a different estimation tech-nique or the modification of the model to be estimated before the estimation can be done.
The challenge of missing values of H for some of the observations leads to a problem of potential sample selec-tion bias, the challenge of correlaselec-tion between the error term and Z leads to a problem of potential endogeneity in the model, and the challenge of non–linear interaction betweenZand unobservable factors that cause differences in the effect ofZonHamongst population subjects leads to the problem of potential unobserved heterogeneity [25-27].
Sample selection bias
In general, sample selection bias is likely to occur in situ-ations where the dependent variable is observed only for a restricted, non–random sample [25]. It is likely to arise when we examine a subsample in circumstances where the unobservable factors that influence inclusion of individu-als in the subsample are correlated with the unobservable factors that influence the variable of primary interest [28]. For example, in our case, we only observe the birth weight of a child if it is reported in the dataset. The birth weight information is, however, missing for about 52% of the children.
In this case, sample selection bias will occur if the unob-servable factors affecting the decision to report the birth weight of the child are correlated with the unobservable factors affecting the birth weight itself.
Although several approaches to correcting for sample selection bias have been proposed in the literature (see, for example, [29,30]), we use the approach suggested by Olsen [30]c. Unlike the popular Heckman approach [29] which is based on maximum likelihood estimationd, the Olsen approach only requires Ordinary Least Squares (OLS) regression techniques in the first step [30].
Endogeneity
Observable Unobservable
Maternal/Paternal Demographic and Socioeconomic
Characteristics
Prenatal Care
Birth Weight (Infant Health) Preferences
Prices Biology/Genetics/
Maternal Health
Figure 1Conceptual model for analyzing the effect of prenatal care on birth weight.This figure shows the conceptual model that is used to analyze the effect of prenatal care on birth weight.
in our model will be inconsistent, and we can also not infer causality between the dependent variable and the independent variables [32]. Since controlling for endo-geneity matters in empirical studies [26], we employ the Two–Stage–Residual–Inclusion (2SRI) method [33] in an attempt to correct for this endogeneity. For simplicity, we assume that this is the only endogenous covariate in our model. In the 2SRI method, we control for potential endogeneity of prenatal care use by computing the gener-alized residualsffrom the adequacy of prenatal care model and including these generalized residuals as an additional regressor in the birth weight model.
Following [34], we test for the endogeneity of the ade-quacy of prenatal care use in the birth weight equation by testing for the statistical significance of these residuals in the equation. If the coefficient of the residuals is statisti-cally significantly different from zero, then the adequacy of prenatal care use variable is endogenous; otherwise, it is exogenous.
Unobserved heterogeneity
In our case, unobserved heterogeneity will exist if there are some unobservable factors that interact non–linearly with the adequacy of prenatal care use causing the effect of prenatal care use on birth weight to differ amongst children in the population [27].
The standard procedure for controlling for unobserved heterogeneity is the control function approachg[3,35]. We employ this approach.
Model identification
For us to properly interpret the estimated parameters of our birth weight model, it is important that birth weight effects of the endogenous covariate (in our case, the ade-quacy of prenatal care use) and of the sample selection
rule be identified [3]. Because we have one endogenous variable in our model, identification requires at least two exclusion restrictions since we have a situation that requires the simultaneous solution of two equations [3].
The variables chosen as instruments should be uncor-related with the stochastic error term in the birth weight equation (i.e. they should be valid or exogenous), should be correlated with the endogenous variable in the birth weight equation (i.e. they should be relevant, or rather, their effects on the endogenous explanatory variable in the birth weight equation should be statistically significant), and should be excluded from the birth weight equation [3,25,36,37].
In our case, therefore, the variables we use as instru-ments for prenatal care use should first, affect prenatal care use or be associated with prenatal care use; second, they should be unrelated to mother or household charac-teristics; and third, they should be related to birth weight only through their association with prenatal care [37].
Examples of variables that have been used as instru-ments for prenatal care in the literature include number of prenatal care clinics or providers per capita, distance from residence to prenatal care clinics, population per hospital bed, unemployment rate, rate of uninsured females, price of prenatal care, bus strikes, whether mother cohabits with father of child, and mother’s income [17,21,38].
We use the “average distance to the nearest health facil-ity” and the “health facilities per 100,000 of population” as instruments in our models. Our models are, therefore, exactly identified [36]. We use these instruments both to identify birth weight reporting and also to identify the effect of prenatal care on birth weight.
use. Since mothers have other uses for their time (such as engaging in paid work, housework, and child care), they must optimally allocate the time available to them amongst the various uses. The longer the distance to the nearest health facility, the higher the opportunity cost to the mother of visiting the facility for prenatal care. Research actually shows that distance to the health facility significantly influences the utilization of health care ser-vices (see, for example, [39]). We would, therefore, expect a mother’s utilization of prenatal care to be limited the longer the distance to the nearest health facility. Conse-quently, we expect a mother’s utilization of prenatal care to be inadequate the longer the distance to the nearest health facility.
One argument in the literature against the use of dis-tance to the nearest health facility as an instrumental variable is that mothers can choose to live near health facilities because of their health status or because of their preferences [15,23]. This then undermines the argument that the distances are exogenous.
To overcome this possibility, we use provincialh level averages for the distance to the nearest health facility in Kenya. This is because, even though an individual mother may choose to live near a health facility because of her health status or simply because she prefers to do so, all the women in a province are unlikely to make this decision simultaneously every time they are preg-nant. As such, an individual woman’s decision may not immediately affect the average distance to the nearest health facility in a province. Furthermore, if the relo-cation of a mother is from one area of the province to another area of the province, this does not change the average distance to the nearest health facility in the province.
The health facilities per 100,000 of population is aimed at indicating the overall accessibility and availability of health care in a particular province. We expect that the higher the number of health facilities per 100,000 of popu-lation, the more the health care (including prenatal care) is accessible and available for use. Consequently, we expect that the higher the number of health facilities per 100,000 of population, the higher the probability of adequate pre-natal care use, and the higher the probability of reporting birth weight.
Empirical model
We formulate both a single–level model and a multilevel model of birth weight.
Single–level model
Since we are using birth weight as a measure of the infant’s health status, we letHibe the birth weight of theithinfant.
Oursingle–levelversion of Equation (2) is, therefore, given by:
Hi=β1+β2Zi+β3Y+ε1i (10)
whereZ is an indicator of the adequacy of prenatal care use,Y is a vector of other factors (controls), andε1 is a stochastic error term.
BecauseZ is potentially endogenous in Equation (10), we have to control for this potential endogeneity. To use the Two–Stage–Residual–Inclusion method to control for this potential endogeneity, we estimate a model for the adequacy of prenatal care use, obtain generalized residu-als from the estimated model using the procedure in [40], and then include these generalized residuals together with the adequacy of prenatal care variable in our structural equation of interest.
The adequacy of prenatal care use variable is con-structed based on the WHO recommendations [14]. The adequacy of prenatal care variable is defined as follows:
Zi=
1 if mother sought adequate prenatal care while pregnant, 0 otherwise.
(11)
The appropriate model for the adequacy of prenatal care use is, therefore, the binary regression model [41,42].
Three common methods for deriving the binary regres-sion model include assuming that there is an unobserved variable that is linked to the observed outcome through a measurement equation, constructing the model as a probability model, and generating the model as a ran-dom utility model [42], p.132. We adopt the latent variable method because of its appeal to intuition.
Using the latent variable formulation, we can define a latent variable Z∗i that is related to Zi via the following
equation:
Zi=
1 ifZi∗>0,
0 otherwise. (12)
This latent variable is linked to the covariates using the equation
Z∗i =α1+α2Y+α2Q+ε2i (13)
where Y is a vector of controls,Qis a vector of instru-ments, andε2is a stochastic error term.
Assuming a standard normal distribution forε2leads to a probit model given by:
Pr(Zi=1)= (α1+α2Y+α2Q) (14)
We estimate this model, obtain its generalized residu-als, and include the generalized residuals as an additional variable in the structural equation of interest.
Rbwi=
1 if infanti’s birth weight is reported,
0 otherwise. (15)
Following [30], we formulate a linear probability sample selection model as:
Rbwi=γ1+γ2Y+γ3Q+υ3i (16)
whereY is a vector of controls,Qis a vector of instru-ments, andυ3is a stochastic error term.
We estimate this model by Ordinary Least Squares, obtain the predicted probabilities,Pˆ, construct the selec-tion term,
ˆ P−1
, and include this selection term as an additional regressor in our model of primary interest [30]. To control for potential unobserved heterogeneity, we include the interaction of the adequacy of prenatal care use with the generalized residuals from the adequacy of prenatal care use equation.
Equation (10) is, therefore, extended as follows:
Hi=β1+β2Zi+β3Y+β4ε2ˆ i+β5
ˆ
P−1+β6Zε2ˆ i+ε1i
(17)
whereZis an indicator of the adequacy of prenatal care use,Y is a vector of controls,ε2ˆ are generalized residu-als from the prenatal care model,
ˆ P−1
is the selection term, andε1is a stochastic error term. When necessary, Equation (17) is extended by the inclusion of additional higher order interaction terms between the adequacy of prenatal care use and the generalized residuals computed from the adequacy of prenatal care use equation.
Multi–level model
We obtain the random–intercept multilevel models by breaking the stochastic error terms in our single–level models into two parts, a mother–specific component,
ζ, and an infant–specific component, . The mother–
specific component,ζ, controls for unobservable mother– specific characteristics that affect the dependent variable of interest (e.g. birth weight, adequacy of prenatal care use, reporting of birth weight) and is assumed to remain unchanged across infants born to the same mother but to be independent across mothers [43]. The infant–specific component, , varies between infants as well as moth-ers but is assumed to be independent across both infants and mothers [43]. It is also further assumed that ζ is independent of [43].
LettingHijbe the birth weight of theithchild born to
thejthmother, the multilevel counterparts of our models are as follows:
Hij=β1+β2Zij+β3Y+ζ1j+ 1ij (18)
Zij=
1 if motherjsought adequate prenatal care when pregnant with infanti,
0 otherwise. (19)
Rbwij
=
1 if the birth weight for infantifrom motherjis reported, 0 otherwise.
(20)
For the multilevel case, the binary responses are related to the latent continuous responses via the following equations:
Zij=
1 ifZ∗ij>0,
0 otherwise. (21)
The multilevel latent response for the adequacy of pre-natal care use, and the multilevel sample–selection mod-els are given by:
Z∗ij=α1+α2Y+α2Q+ζ2j+ 2ij (22)
Rbwij=γ1+γ2Y+γ3Q+ζ3j+ 3ij (23)
where Y is a vector of controls, Q is a vector of
instruments,ζ1j,ζ2j,ζ3j are random intercepts that
con-trol for unobservable mother – specific characteristics, 1ij, 2ij, 3ijare infant – specific stochastic error terms.
We assume thatζ1j ∼ N(0,ψ1), ζ2j ∼ N(0,ψ2), and ζ3j ∼ N(0,ψ3). 1ij ∼ N(0,θ), while 2ij and 3ij are
assumed to follow the standard normal distribution. The corresponding multilevel probit model for the ade-quacy of prenatal care use is given by:
PrZij=1=α1+α2Y+α3Q+ζ2j (24)
To control for potential endogeneity of prenatal care, potential sample selection bias and potential unobserved heterogeneity, we extend Equation (18) as follows:
Hij=β1+β2Zij+β3Y+β4ˆ2ij+β5Zijˆ2ij+β6
ˆ
P−1
+ζ1j+ 1ij
(25)
where 2ˆij are generalized residuals from the multilevel
prenatal care model, and
ˆ P−1
is the selection term. For the multilevel models, the dependence among the responses for the same mother can be quantified by the residual intraclass correlation, ρ, of the responses given the covariates [43]. For the multilevel birth weight model, this is given by:
ρ= ψψ+θ (26)
while for the multilevel binary models it is given by:
ρ= ψψ+
We estimate our models using Stata software version 12 [44]. The multilevel binary models are estimated using the
gllammcommand [43].
Data
The main dataset we use is the Demographic and Health Survey (DHS) data set for Kenya collected in 2008 [45]i. A good guide to Demographic and Health Survey (DHS) data sets can be found in [46]. Demographic and Health Surveys are nationally representative household surveys that provide a wide range of household level data on child and maternal health.
Data on average distance to health facilities is obtained from the community dataset of the Kenya Integrated Household Budget Survey (KIHBS) that was carried out between 2005 and 2006j [47]. Data on health facilities per 100,000 of population is computed using information obtained from the Kenya National Bureau of Statistics [48,49].
Following [14], prenatal care use is classified as “ade-quate” if all of the following conditions were met: the mother must have sought the prenatal care from a skilled provider, in particular, from either a doctor or a nurse; the mother must have had at least four prenatal care visits; and the first prenatal care visit must have occurred within the first four months of pregnancy.
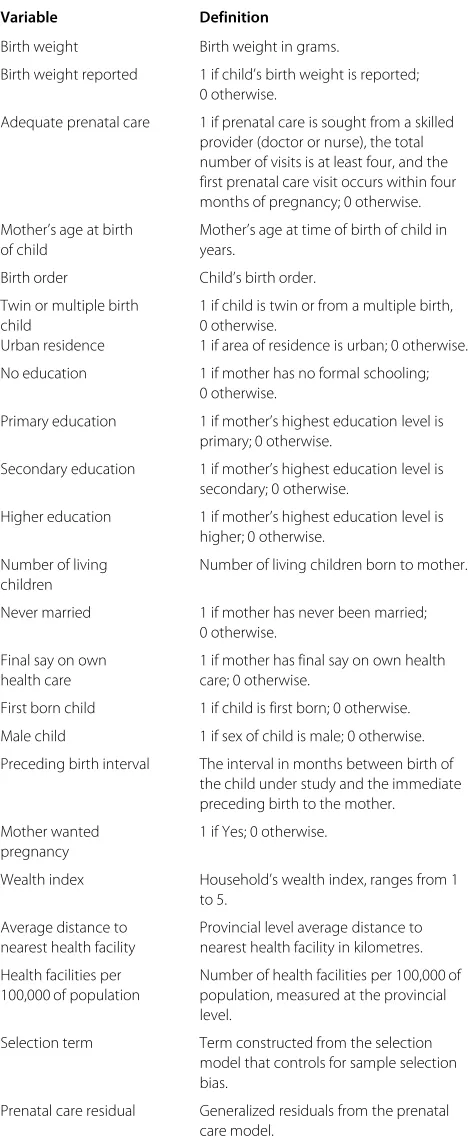
Table 2 shows the variable definitions for the various variables found in our models.
Estimation strategy
We estimate our models in two stages. In the first stage, we estimate sample selection models and prenatal care models. In the second stage, we estimate the birth weight model.
Results
In this section we present the descriptive statistics, the results of the first–stage models, and the results of the birth weight model.
Descriptive statistics
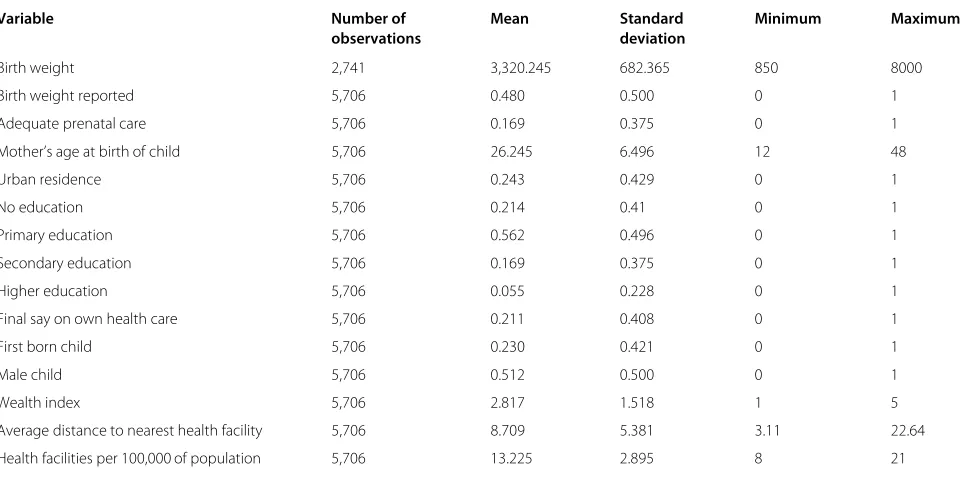
The descriptive statistics are shown in Table 3.
From the table, we can observe that the average birth weight in the sample is 3,320 grams. We can further observe that about 48% of the children had their birth weights reported while about 16.9% of the infants were born to mothers who had sought adequate prenatal care when pregnant. The table also shows that the average age at birth for mothers is about 26 years and about 51% of the infants in the sample are males.
First–stage models
We report the average marginal effectsk based on our estimations [41].
Table 2 Variable definitions
Variable Definition
Birth weight Birth weight in grams.
Birth weight reported 1 if child’s birth weight is reported; 0 otherwise.
Adequate prenatal care 1 if prenatal care is sought from a skilled provider (doctor or nurse), the total number of visits is at least four, and the first prenatal care visit occurs within four months of pregnancy; 0 otherwise.
Mother’s age at birth Mother’s age at time of birth of child in
of child years.
Birth order Child’s birth order.
Twin or multiple birth 1 if child is twin or from a multiple birth,
child 0 otherwise.
Urban residence 1 if area of residence is urban; 0 otherwise.
No education 1 if mother has no formal schooling; 0 otherwise.
Primary education 1 if mother’s highest education level is primary; 0 otherwise.
Secondary education 1 if mother’s highest education level is secondary; 0 otherwise.
Higher education 1 if mother’s highest education level is higher; 0 otherwise.
Number of living Number of living children born to mother. children
Never married 1 if mother has never been married; 0 otherwise.
Final say on own 1 if mother has final say on own health health care care; 0 otherwise.
First born child 1 if child is first born; 0 otherwise.
Male child 1 if sex of child is male; 0 otherwise.
Preceding birth interval The interval in months between birth of the child under study and the immediate preceding birth to the mother.
Mother wanted 1 if Yes; 0 otherwise. pregnancy
Wealth index Household’s wealth index, ranges from 1 to 5.
Average distance to Provincial level average distance to nearest health facility nearest health facility in kilometres.
Health facilities per Number of health facilities per 100,000 of 100,000 of population population, measured at the provincial
level.
Selection term Term constructed from the selection model that controls for sample selection bias.
Prenatal care residual Generalized residuals from the prenatal care model.
Table 3 Descriptive statistics
Variable Number of Mean Standard Minimum Maximum
observations deviation
Birth weight 2,741 3,320.245 682.365 850 8000
Birth weight reported 5,706 0.480 0.500 0 1
Adequate prenatal care 5,706 0.169 0.375 0 1
Mother’s age at birth of child 5,706 26.245 6.496 12 48
Urban residence 5,706 0.243 0.429 0 1
No education 5,706 0.214 0.41 0 1
Primary education 5,706 0.562 0.496 0 1
Secondary education 5,706 0.169 0.375 0 1
Higher education 5,706 0.055 0.228 0 1
Final say on own health care 5,706 0.211 0.408 0 1
First born child 5,706 0.230 0.421 0 1
Male child 5,706 0.512 0.500 0 1
Wealth index 5,706 2.817 1.518 1 5
Average distance to nearest health facility 5,706 8.709 5.381 3.11 22.64
Health facilities per 100,000 of population 5,706 13.225 2.895 8 21
We show the results for the multilevel model and those for the single level model, for comparison purposes. The single level model results are shown in columns (1) and (3) of the table while the multilevel model results are shown in columns (2) and (4) of the table.
We show the results for the sample selection model in Columns (1) and (2) of the table and those of the pre-natal care model in columns (3) and (4) of the table. From columns (1) and (2) we can conclude that mothers who have formal education, reside in urban, or are mem-bers of wealthy households are more likely to report the infant’s birth weight, holding other factors constant. The birth weight of a first born child is also more likely to be reported than that of a non–first born child, holding other factors constant.
Columns (3) and (4) show that significant determinants of adequate prenatal care use include mother’s age at birth of child, level of education, wealth index, average distance to nearest health facility, and health facilities per 100,000 of population.
The likelihood ratio test forρ=0 shown in the table is a test of the null hypothesis that the variance of the random intercept is zero. From the table, we can observe that while this hypothesis is rejected in the sample selection model, we are unable to reject it in the prenatal care model.
Birth weight model
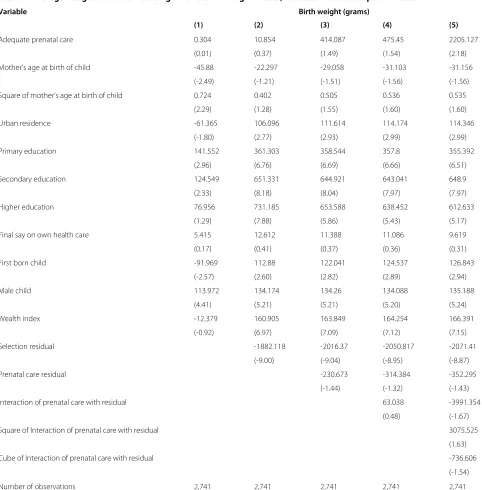
Table 5 shows the results for the single–level birth weight model.
In the table, the columns showing the results have been labelled (1), (2), (3), (4) and 5. They all show different
versions of the model. Column (1) of the table shows the basic model; column (2) shows the version of the model controlling for sample selection bias; column (3) shows the version of the model controlling for both sample selec-tion bias and endogeneity of prenatal care use; column (4) shows the version of the model controlling for sample selection bias, endogeneity of prenatal care use and unob-served heterogeneity; while column (5) shows a version of the model that contains the same variables as the ver-sion of the model in column (4) together with higher order terms for controlling for unobserved heterogeneity.
Table 4 Average marginal effects for sample selection and prenatal care models, robustZstatistics in parentheses
Variable Report Adequate
(birth weight=1) (prenatal care=1)
(1) (2) (3) (4)
Mother’s age at birth of child 0.005 0.009 0.018 0.018
(0.75) (1.19) (2.80) (2.78)
Square of mother’s age at birth of child -0.00007 -0.0001 -0.0003 -0.0003
(-0.57) (-0.97) (-2.50) (-2.50)
Urban residence 0.079 0.064 -0.014 -0.014
(4.17) (3.07) (-0.89) (-0.90)
Primary education 0.142 0.14 0.040 0.040
(8.05) (6.64) (2.47) (2.46)
Secondary education 0.319 0.306 0.092 0.092
(14.04) (11.70) (4.83) (4.76)
Higher education 0.386 0.368 0.211 0.211
(15.34) (10.24) (8.75) (8.67)
Final say on own health care 0.0005 -0.007 0.001 0.001
(0.03) (-0.45) (0.09) (0.09)
First born child 0.099 0.088 0.006 0.006
(5.92) (5.84) (0.45) (0.46)
Male child 0.011 0.003 0.004 0.004
(0.97) (0.34) (0.38) (0.38)
Wealth index 0.084 0.092 0.021 0.021
(14.02) (14.23) (4.41) (4.45)
Average distance to nearest health facility -0.024 -0.022 -0.011 -0.011
(-5.09) (-4.15) (-2.78) (-2.75)
Average distance to nearest health facility squared 0.001 0.0009 0.0003 0.0003
(5.52) (4.45) (1.74) (1.73)
Health facilities per 100,000 of population 0.083 0.070 0.073 0.073
(4.98) (4.43) (5.30) (5.33)
Health facilities per 100,000 of population squared -0.002 -0.002 -0.002 -0.002
(-3.81) (-3.43) (-5.08) (-5.11)
ψ 0.109 2.084×10⁻²⁰
ρ 0.59 2.084×10⁻²⁰
Likelihood ratio test forρ=0:χ12 788.19 4.5×10⁻⁴
(P-value) (0.00) (0.492)
Number of observations 5,706 5,706 5,706 5,706
The estimates for the sample selection model come from a linear probability model while those of the prenatal care model come from a probit model.
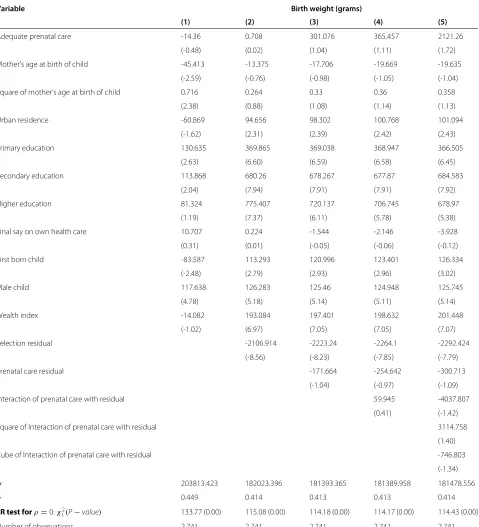
Table 6 shows the results for the multi–level birth weight model.
The column of results are also labelled as (1), (2), (3), (4) and (5). Column (1) of the table shows the basic model; column (2) shows the version of the model that controls for sample selection bias; column (3) shows the version of the model that controls for sample selection bias and endogeneity of prenatal care use; while column (4) shows
the version of the model that controls for sample selection bias, endogeneity of prenatal care use and unobserved het-erogeneity. We include higher order terms that control for unobserved heterogeneity in the version of the model in column (5).
Table 5 Average marginal effects from single–level birth weight model, robustZstatistics in parentheses
Variable Birth weight (grams)
(1) (2) (3) (4) (5)
Adequate prenatal care 0.304 10.854 414.087 475.45 2205.127
(0.01) (0.37) (1.49) (1.54) (2.18)
Mother’s age at birth of child -45.88 -22.297 -29.058 -31.103 -31.156
(-2.49) (-1.21) (-1.51) (-1.56) (-1.56)
Square of mother’s age at birth of child 0.724 0.402 0.505 0.536 0.535
(2.29) (1.28) (1.55) (1.60) (1.60)
Urban residence -61.365 106.096 111.614 114.174 114.346
(-1.80) (2.77) (2.93) (2.99) (2.99)
Primary education 141.552 361.303 358.544 357.8 355.392
(2.96) (6.76) (6.69) (6.66) (6.51)
Secondary education 124.549 651.331 644.921 643.041 648.9
(2.33) (8.18) (8.04) (7.97) (7.97)
Higher education 76.956 731.185 653.588 638.452 612.633
(1.29) (7.88) (5.86) (5.43) (5.17)
Final say on own health care 5.415 12.612 11.388 11.086 9.619
(0.17) (0.41) (0.37) (0.36) (0.31)
First born child -91.969 112.88 122.041 124.537 126.843
(-2.57) (2.60) (2.82) (2.89) (2.94)
Male child 113.972 134.174 134.26 134.088 135.188
(4.41) (5.21) (5.21) (5.20) (5.24)
Wealth index -12.379 160.905 163.849 164.254 166.391
(-0.92) (6.97) (7.09) (7.12) (7.15)
Selection residual -1882.118 -2016.37 -2050.817 -2071.41
(-9.00) (-9.04) (-8.95) (-8.87)
Prenatal care residual -230.673 -314.384 -352.295
(-1.44) (-1.32) (-1.43)
Interaction of prenatal care with residual 63.038 -3991.354
(0.48) (-1.67)
Square of Interaction of prenatal care with residual 3075.525
(1.63)
Cube of Interaction of prenatal care with residual -736.606
(-1.54)
Number of observations 2,741 2,741 2,741 2,741 2,741
model is appropriate for our analysis. We can observe from the model that although we have a selection issue, prenatal care is not endogenous and our mod-els do not suffer from unobserved heterogeneity. We can, however, observe from the model in column (5) that adequate use of prenatal care increases birth weight.
We show the results of both the single–level birth weight model and the multi–level birth weight model in Table 7, for comparison purposes.
From Table 7, we can conclude that significant determi-nants of birth weight include adequate prenatal care use, urban residence, education, whether or not the child is firstborn, sex of the child, and wealth.
Discussion
First–stage models
Table 6 Average marginal effects from multi–level birth weight models,Zstatistics in parentheses
Variable Birth weight (grams)
(1) (2) (3) (4) (5)
Adequate prenatal care -14.36 0.708 301.076 365.457 2121.26
(-0.48) (0.02) (1.04) (1.11) (1.72)
Mother’s age at birth of child -45.413 -13.375 -17.706 -19.669 -19.635
(-2.59) (-0.76) (-0.98) (-1.05) (-1.04)
Square of mother’s age at birth of child 0.716 0.264 0.33 0.36 0.358
(2.38) (0.88) (1.08) (1.14) (1.13)
Urban residence -60.869 94.656 98.302 100.768 101.094
(-1.62) (2.31) (2.39) (2.42) (2.43)
Primary education 130.635 369.865 369.038 368.947 366.505
(2.63) (6.60) (6.59) (6.58) (6.45)
Secondary education 113.868 680.26 678.267 677.87 684.583
(2.04) (7.94) (7.91) (7.91) (7.92)
Higher education 81.324 775.407 720.137 706.745 678.97
(1.19) (7.37) (6.11) (5.78) (5.38)
Final say on own health care 10.707 0.224 -1.544 -2.146 -3.928
(0.31) (0.01) (-0.05) (-0.06) (-0.12)
First born child -83.587 113.293 120.996 123.401 126.334
(-2.48) (2.79) (2.93) (2.96) (3.02)
Male child 117.638 126.283 125.46 124.948 125.745
(4.78) (5.18) (5.14) (5.11) (5.14)
Wealth index -14.082 193.084 197.401 198.632 201.448
(-1.02) (6.97) (7.05) (7.05) (7.07)
Selection residual -2106.914 -2223.24 -2264.1 -2292.424
(-8.56) (-8.23) (-7.85) (-7.79)
Prenatal care residual -171.664 -254.642 -300.713
(-1.04) (-0.97) (-1.09)
Interaction of prenatal care with residual 59.945 -4037.807
(0.41) (-1.42)
Square of Interaction of prenatal care with residual 3114.758
(1.40)
Cube of Interaction of prenatal care with residual -746.803
(-1.34)
ψ 203813.423 182023.396 181393.365 181389.958 181478.556
ρ 0.449 0.414 0.413 0.413 0.414
LR test forρ=0:χ12(P−value) 133.77 (0.00) 115.08 (0.00) 114.18 (0.00) 114.17 (0.00) 114.43 (0.00)
Number of observations 2,741 2,741 2,741 2,741 2,741
constant. This is likely to be mainly because older women are more experienced in matters of child birth and may have learnt from earlier experiences the advantages of seeking adequate prenatal care while pregnant. This find-ing is supported by the findfind-ing in the literature where maternal age of less than 18 years is found to be associated
with inadequate use of prenatal care in Aracaju, Northeast Brazil [50].
Table 7 Average marginal effects from our chosen birth weight models,Zstatistics in parentheses
Variable Birth weight (grams)
Single level Multi–level model model
Adequate prenatal care 2205.127 2121.26
(2.18) (1.72)
Mother’s age at birth of child -31.156 -19.635
(-1.56) (-1.04)
Square of mother’s age at birth 0.535 0.358
of child (1.60) (1.13)
Urban residence 114.346 101.094
(2.99) (2.43)
Primary education 355.392 366.505
(6.51) (6.45)
Secondary education 648.9 684.583
(7.97) (7.92)
Higher education 612.633 678.97
(5.17) (5.38)
Final say on own health care 9.619 -3.928
(0.31) (-0.12)
First born child 126.843 126.334
(2.94) (3.02)
Male child 135.188 125.745
(5.24) (5.14)
Wealth index 166.391 201.448
(7.15) (7.07)
Selection residual -2071.41 -2292.424
(-8.87) (-7.79)
Prenatal care residual -352.295 -300.713
(-1.43) (-1.09)
Interaction of prenatal care with -3991.354 -4037.807
residual (-1.67) (-1.42)
Square of Interaction of prenatal 3075.525 3114.758
care with residual (1.63) (1.40)
Cube of Interaction of prenatal -736.606 -746.803
care with residual (-1.54) (-1.34)
ψ 181478.556
ρ 0.414
LR test forρ=0:χ2
1(P−value) 114.43 (0.00)
Number of observations 2,741 2,741
other factors constant. The reason could be that education enables the mothers to be aware of the benefits of prenatal care by, for instance, being able to benefit from awareness campaigns. Findings from the literature support the posi-tive effects of education on the probability of seeking ade-quate prenatal care. For example, in Aracaju, Northeast Brazil, low maternal schooling is associated with inad-equate prenatal care use [50]. Similarly, in Turkey, it is observed that the probability of women with one to five years of schooling and that of the women with six or more years of schooling using prenatal care services is higher than that of the women with no schooling [51].
The results also show that the wealthier the household to which a mother belongs, the higher the probability of seeking adequate prenatal care, holding all other factors constant. This is similar to the finding in the literature that household wealth is positively associated with pre-natal care use [51]. The explanation here is that wealthy households have the necessary resources to pay for the indirect costs of using prenatal care services.
The results of the prenatal care model in Table 4 further show that, holding other factors constant, the longer the average distance to the nearest health facility, the lower the probability of the mother seeking adequate prenatal care. This is in line with our expectations. A more likely explanation of this relationship is that the total cost of seeking prenatal care from a facility is higher if the facil-ity is farther from the mother. This is true of the indirect costs such as the cost of transportation to the facility, and of the opportunity cost since it might take longer for the mother to go to such facilities. The findings from the lit-erature support this. For example, [50] reports that those women who had to obtain prenatal care outside Aracaju had inadequate use of prenatal care services.
We can further observe from the results in Table 4 that more health facilities per 100,000 of population increase the probability of seeking adequate prenatal care, if other factors are held constant. This is because more health facilities mean that health care (including prenatal care) is generally available for those who may want to seek it.
Birth weight model
adequate prenatal care on infant health could be mainly that during prenatal care visits, mothers receive a wide range of advice on what to do so as to improve the health of the foetus. They, further, receive treatment from any ill-nesses which might have detrimental effects on the health of the foetus.
Comparing the results from the multi–level model and those from the single–level model shows that the single– level model overstates the effect of adequate use of prena-tal care on birth weight. In the single–level model, holding other factors constant, the birth weight of infants whose mothers sought adequate prenatal care while pregnant is higher than that of the infants whose mothers did not seek adequate prenatal care by about 2205 grams. This implies that adequate use of prenatal care increases birth weight by about 2205 grams, holding other factors constant. In the multilevel model, however, the corresponding differ-ence in birth weights between infants whose mothers sought adequate prenatal care and those whose mothers did not seek adequate prenatal care is only about 2121 grams. Consequently, failure to control for unobserved mother–specific characteristics, leads to an overstate-ment of the effect of adequate prenatal care use on birth weight.
The results further indicate that mothers who reside in urban areas have heavier children compared to those who reside in rural areas, holding other factors constant. A possible explanation would be the relative availability of skilled health providers in urban areas than in rural areas leading to prompt treatment of all sorts of illnesses that could be detrimental to child health. There is also the issue of the relative high levels of awareness in urban areas than in rural areas of child health matters due to having so many information campaigns.
The results also indicate that mothers with formal schooling have heavier infants compared to those with-out formal schooling, holding other factors constant. This result is consistent with some of the findings in the literature where, for example, in Malawi, women who have attained at least secondary level education are less likely to bear low birth weight children compared to women without formal education [52].
The results indicate that male infants have higher birth weights compared to female infants, holding other factors constant. This is in line with the findings from literature where, for example, in Kenya female infants are found to be lighter than male infants [3].
In contrast to the findings in the literature, however, we find that first born infants have higher birth weights than their non–first born counterparts, holding other fac-tors constant. This could be due to the higher (though not statistically significant) probability of seeking ade-quate prenatal care when pregnant with the first born child reported in Table 4.
Conclusions
The main conclusion from our study is that using prena-tal care adequately when pregnant leads to higher birth weights amongst infants, and by extension, to better infant health. The study, therefore, demonstrates that prenatal care is effective in improving birth weight when used ade-quately. We can also conclude that there is need for con-trolling for unobserved mother–specific effects in models that attempt to investigate the effect of prenatal care on birth weight. There is also further need to control for sam-ple selection bias and unobserved heterogeneity in such models.
Because the study shows that adequate use of prenatal care increases birth weight and, by extension, improves infant health, the implication is that policies for pro-moting adequate use of prenatal care should be pursued. These policies range from ensuring availability of skilled health care providers such as doctors and nurses at pre-natal care clinics, reducing the average distances mothers have to cover when seeking prenatal care services, intensi-fying education of females as a way of empowering women to be able to make the right choices regarding when to seek prenatal care and from whom, and increasing income opportunities for households.
The study provides important lessons for developing countries in the sense that emphasis should be on ade-quate prenatal care use, and not just prenatal care use. A clear criteria for judging the adequacy of prenatal care use is also provided.
Endnotes
aThis is the health of children aged one year and below.
bThese are factors whose possession or presence is
associated with an increased probability of giving birth to a low birth weight infant [10].
cThe Olsen approach involves estimation of a linear
probability model of the selection equation, obtaining the probability of selection into the samplePˆ,
construction of the selection term
ˆ P−1
, and inclusion of this selection term as an additional regressor in the infant health equation [30]. A statistically significant coefficient of the selection term indicates sample selection bias.
dMaximum likelihood estimation is biased in small
samples and relies on numerical methods which could lead, in some circumstances, to nonconvergence or convergence with a wrong solution [41]. For a further critique of the Heckman procedure, see [53].
eCommon causes of endogeneity include failure to
fResiduals can generally be viewed as being functionally
related to the observed values of the dependent variable and the estimated values of the parameters [54]. For models estimated using maximum likelihood (such as probit), deviance–based definitions of residuals are recommended [55]. A detailed discussion on how to compute these residuals for various non–linear models is provided in [40]. Specifically for the probit model, the discussion in [40] implies that for a binary dependent variabley, theithresidualuˆican be computed as follows
ˆ ui=
⎧ ⎪ ⎪ ⎪ ⎨ ⎪ ⎪ ⎪ ⎩
φxβˆ
xβˆ ifyi=1
−φxβˆ
1−xβˆ ifyi=0
whereφis the probability density function of the standard normal distribution andis the cumulative density function of the standard normal distribution.
gThe approach involves including in the birth weight
equation interactions between the residuals and the endogenous explanatory variable (in our case, the adequacy of prenatal care use). If the coefficient of the resulting interaction term is statistically significantly different from zero, there is unobserved heterogeneity in our birth weight model. If the coefficient is not
statistically significantly different from zero, there is no unobserved heterogeneity in our birth weight model.
hThe new constitution enacted in Kenya in 2010
abolished provinces.
iMore information on Demographic and Health
Surveys can be obtained by visiting http://www.
measuredhs.com/What-We-Do/Survey-Types/DHS.cfm jSince prenatal care is sought during pregnancy, the
ideal case would have been to obtain data on distances for the year in which the mother was pregnant with the child. A look at the DHS 2008 data shows that the children in the dataset were aged between less than one year and four years. This puts their years of birth to between 2004 and 2008. This would imply the years at which the mothers were pregnant with the children range roughly from 2003 to 2007. The data on distance to the facilities gathered between 2005 and 2006 gives us a rough idea about the ease or otherwise of access to health care over the five–year period 2005-2010, since we do not expect massive changes in the distances over the five–year period. This period coincides with the period mothers are likely to have been pregnant with about 63% of the children in our estimation sample. We, therefore, believe that the distance information from the KIHBS 2005/2006 provides a good estimate of the indirect cost of accessing the facilities when the mothers were pregnant for the majority of the children.
kOne important question we may want to answer after
the estimation of our models is how changes in the explanatory variables affect the probabilities of a positive outcome. This question can be answered by reporting the marginal effects of the respective covariates [41]. The marginal effect is computed by taking the partial derivative of the dependent variable or in the case of the binary regression model, taking the partial derivative of the estimated probability model, with respect to the variable of interest [41]. Since in the case of the binary regression model the resulting partial derivative is a function of all the variables, it can either be evaluated at the means of the various variables, leading to what is called the marginal effect at the means, or it can be computed for each observation and then averaged over all observations, leading to average marginal effects [41]. The average marginal effects are preferable to the marginal effects at means [56]. We, therefore, compute and report the average marginal effects for the variables in our models. In the linear regression model, the marginal effects are generally equivalent to the estimated partial slope parameters. For dummy explanatory variables in the binary regression model, the marginal effects are given by the differences in the probabilities when the variable assumes the value of 1 and when it assumes the value of 0 [41].
Competing interests
The authors declare that they have no competing interests.
Received: 14 May 2014 Accepted: 7 November 2014
References
1. Hertzman C, Power C:Child development as a determinant of
health across the life course.Curr Paediatr2004,14:438–443.
2. Alves D, Belluzzo W:Infant mortality and child health in Brazil. Econ Hum Biol2004,2:391–410.
3. Mwabu G:The production of child health in Kenya: a structural
model of birth weight.J Afr Economies2009,18:212–260.
4. Schultz TP:Studying the impact of household economic and
community variables on child mortality.Popul Dev Rev1984,
10(Supplement):215–235.
5. Mwabu G:Health economics for low-income countries.InHandbook of Development Economics Volume 4. Edited by Schultz TP, Strauss J. Amsterdam: Elsevier/North-Holland; 2008:3305–3374.
6. World Health Organization:World Health Statistics 2011. Geneva: World Health Organization; 2011.
7. World Health Organization:World Health Statistics 2014. Geneva: World Health Organization; 2014.
8. World Health Organization:World Health Statistics 2012. Geneva: World Health Organization; 2012.
9. Zegers-Hochschild F, Adamson GD, de Mouzon J, Ishihara O, Mansour R, Nygren K, Sullivan E, Vanderpoel S:International committee for monitoring assisted reproductive technology (ICMART) and the world health organization revised glossary of ART terminology. Fertil Steril2009,95:1520–1524.
10. Medicine I:Preventing Low Birth Weight. Washington, D.C: National Academy Press; 1985.
11. Kramer MS:Determinants of low birth weight: methodological
assessment and meta-analysis.Bull World Health Org1987,
12. Institute of Health Economics:Determinants and Prevention of Low Birth Weight: A Synopsis of the Evidence. Edmonton: Institute of Health Economics; 2008.
13. Darling RD, Atav AS:Risk factors for low birth weight in New York
state counties.Policy Polit Nurs Pract2012,13:17–26.
14. Berg CJ:Prenatal care in developing countries: the World Health
Organization technical working group on antenatal care.J Am Med
Womens Assoc (1972)1995,50:182–186.
15. Gajate-Garrido G:The impact of adequate prenatal care on urban
birth outcomes: an analysis in a developing country context.Econ
Dev Cultural Change2013,62:95–130.
16. Alexander GR, Korenbrot CC:The role of prenatal care in preventing
low birth weight.Future Child1995,5:103–120.
17. Evans WN, Lien DS:The benefits of prenatal care: evidence from the
PAT bus strike.J Econometrics2005,125:207–239.
18. Conway KS, Kutinova A:Maternal health: does prenatal care make a
difference?Health Econ2006,15:461–488.
19. Nazim NH, Fan L:Does prenatal healthcare improve child birth weight outcomes in Azerbaijan? Results of the national
demographic and health survey.Econ Hum Biol2011,9:56–65.
20. Jewell RT, Triunfo P:The impact of prenatal care on birth weight: the
case of Uruguay.Health Econ2006,15:1245–1250.
21. Wehby GL, Murray JC, Castilla EE, Lopez-Camelo JS, Ohsfeldt RL:Quantile effects of prenatal care utilization on birth weight in Argentina. Health Econ2009,18:1307–1321.
22. Currie J, Grogger J:Medicaid expansions and welfare contractions:
offsetting effects on prenatal care and infant health?J Health Econ
2002,21:313–335.
23. Rosenzweig MR, Schultz TP:The behaviour of mothers as inputs to child health: the determinants of birth weight, gestation, and rate
of fetal growth.InEconomic Aspects of Health. Fuchs VR. Chicago:
University of Chicago Press; 1982:53–92.
24. Rosenzweig MR, Schultz TP:Estimating a household production function: heterogeneity, the demand for health inputs, and their
effects on birth weight.J Pol Econ1983,91:723–746.
25. Wooldridge JM:Econometric Analysis of Cross Section and Panel Data. Cambridge, Masschusetts: MIT Press; 2002.
26. Zohoori N:Does endogeneity matter? A comparison of empirical
analyses with and without control for endogeneity.Ann Epidemiol
1997,7:258–266.
27. Zohoori N, Savitz DA:Econometric approaches to epidemiologic data: relating endogeneity and unobserved heterogeneity to
confounding.Ann Epidemiol1997,7:251–257.
28. Vella F:Estimating models with sample selection bias: a survey. J Hum Resour1998,33:127–169.
29. Heckman J:Sample selection as a specification error.Econometrica
1979,47:153–161.
30. Olsen RJ:A least squares correction for selectivity bias.Econometrica
1980,48:1815–1820.
31. Stock JH, Watson MW:Introduction to Econometrics. Boston: Addison-Wesley; 2011.
32. Cameron AC, Trivedi PK:Microeconometrics Using Stata. College Station: Texas Stata Press; 2010.
33. Terza JV, Basu A, Rathouz PJ:Two-stage residual inclusion estimation:
addressing endogeneity in health econometric modelling.J Health
Econ2008,27:531–543.
34. Bollen KA, Guilkey DK, Mroz TA:Binary outcomes and endogenous explantory variables: tests and solutions with an application to the
demand for contraceptive use in Tunisia.Demography1995,
32:111–131.
35. Florens JP, Heckman JJ, Meghir C, Vytlacil E:Identification of treatment effects using control functions in models with continuous,
endogeneous treatment and heterogeneous effects.Econometrica
2008,76:1191–1206.
36. Murray MP:Avoiding invalid instruments and coping with weak
instruments.J Econ Perspect2006,20:111–132.
37. Brookhart MA, Rassen JA, Schneeweiss S:Instrumental variable methods in comparative safety and effectiveness research. Pharmacoepidemiol Drug Saf2010,19:537–554.
38. Conway KS, Deb P:Is prenatal care really ineffective? Or, is the ‘devil’
in the distribution?J Health Econ2005,24:489–513.
39. Qian D, Pong RW, Yin A, Nagarajan KV, Meng Q:Determinants of health care demand in poor rural China: the case of Gansu province. Health Policy Plann2009,24:324–334.
40. Gourieroux C, Monfort A, Renault E, Trognon A:Generalized residuals. J Econometrics1987,34:5–32.
41. Long JS:Regression Models for Categorical and Limited Dependent
Variables.Thousand Oaks: Sage Publications; 1997.
42. Long JS, Freese J:Regression Models for Categorical Dependent
Variables Using Stata.College Station, Texas: Stata Press; 2006.
43. Rabe-Hesketh S, Skrondal A:Multilevel and Longitudinal Modeling Using Stata. College Station, Texas: Stata Press; 2008.
44. StataCorp:Stata: Release 12. Statistical Software. College Station, Texas: StataCorp; 2011.
45. Kenya National Bureau of Statistics (KNBS) and ICF Macro:Kenya Demographic and Health Survey 2008-09. Calverton, Maryland: Kenya National Bureau of Statistics (KNBS) and ICF MacrO; 2010.
46. Rutstein SO, Rojas G:Guide to DHS Statistics. Calverton, Maryland: ORC Macro; 2006.
47. Kenya National Bureau of Statistics (KNBS):Kenya Integrated Household Budget Survey (KIHBS) 2005/06: Basic Report. Nairobi: Kenya National Bureau of Statistics (KNBS); 2007.
48. Kenya National Bureau of Statistics (KNBS):Economic Survey 2011. Nairobi: Kenya National Bureau of Statistics (KNBS); 2011.
49. Kenya National Bureau of Statistics (KNBS):Statistical Abstract 2011. Nairobi: Kenya National Bureau of Statistics (KNBS); 2011.
50. Ribeiro ER, Guimares AMDN, Bettiol H, Lima DDF, Almeida MLD, De Souza L, Silva AAM, Gurgel RQ:Risk factors for inadequate prenatal care use
in the metropolitan area of Aracaju, Northeast Brazil.BMC Pregnancy
Childbirth2009,31:1–8.
51. Celik Y, Hotchkiss DR:The socio-economic determinants of maternal
health care utilization in Turkey.Soc Sci Med2000,50:1797–1806.
52. Muula AS, Siziya S, Rudatsikira E:Parity and maternal education are
associated with low birth weight in Malawi.Afr Health Sci2011,
11:65–71.
53. Puhani PA:The Heckman correction for sample selection and its
critique.J Econ Surv2000,14:53–68.
54. Cox DR, Snell EJ:A general definition of residuals.J R Stat Soc Series B (Methodological)1968,30:248–275.
55. Pierce DA, Schafer DW:Residuals in generalized linear models. J Am Stat Soc1986,81:977–986.
56. Bartus T:Estimation of marginal effects using margeff.Stat J2005, 5:309–329.
doi:10.1186/s13561-014-0033-3
Cite this article as:Awiti:A multilevel analysis of prenatal care and birth weight in Kenya.Health Economics Review20144:33.
Submit your manuscript to a
journal and benefi t from:
7Convenient online submission
7 Rigorous peer review
7Immediate publication on acceptance
7 Open access: articles freely available online
7High visibility within the fi eld
7 Retaining the copyright to your article