Interfacing the System Evaluation Method LSP
with E-commerce Web Sites
Greydon Buckley1 and Jozo Dujmović2
1Department of Computer Science San Francisco State University
[email protected] 2Department of Computer Science
San Francisco State University [email protected]
Abstract. For many people faced with a tough purchasing decision, the research tool of choice is a web browser. Search engines solve the general problem of finding relevant data, however it is up to the user to sort, filter, and evaluate it. Decision support methods such as LSP can turn raw data into formal evaluations, but they are generally disconnected from the Web – the most up-to-date, widely-used, and convenient source of data available. This paper demonstrates how LSP can be connected to the Web, so that live data from e-commerce web sites can be used in consumer-oriented system evaluations.
Keywords: Web Information Extraction Systems (WIES); Logic Scoring of Preference (LSP) method.
1. Introduction
Web Information Extraction Systems (WIES) are tools that transform web pages into program-friendly structures that can be used by a variety of web applications and services. A recent WEIS survey [1] provided evaluation and comparison of various information extraction approaches and found that despite the great necessity for WIES the automation degree is generally rather low.
achieved degree of automation. We believe that our results are typical and can be used by WIES designers, planners, and users.
2.
LSP method for system evaluation
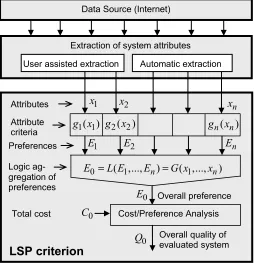
System evaluation is a process of determining the ability of a system to satisfy user requirements. In the context of e-commerce, it is how we decide what to buy. Evaluations can range from simple feature-by-feature comparisons to full-blown mathematical modeling supported by dedicated decision-support software. The LSP method for system evaluation [4,5,6] falls into the latter category. It is capable of reducing a large and complex set of system attributes into a single overall quality indicator that precisely indicates how well those attributes match against user-specified criteria. This process is illustrated in Fig. 1 where we present both the structure of an LSP criterion and the process of providing inputs for the LSP method if the source of data about evaluated systems is Internet, i.e. an e-commerce web site.
1
E
Data Source (Internet)
Automatic extraction User assisted extraction
( ) n n g x
n x
2( )2
g x
1 1( )
g x
2
E En
0 ( ,...,1 n) ( ,...,1 n) E =L E E =G x x
0
E Overall preference Cost/Preference Analysis
0
C
0
Q Overall quality of evaluated system Attribute
criteria
Logic ag-gregation of preferences
Attributes x1 x2
Preferences
Total cost
LSP criterion
Extraction of system attributes
Fig. 1. Extraction of attributes and the structure of LSP criterion
indicator. In the case of large and complex systems input attributes are provided by a team of professional evaluators and domain experts. In the case illustrated in Fig. 1 we consider a simple situation of evaluating an object whose attributes are available on Internet, posted on an e-commerce web site. Of course, the evaluator could manually collect all input data for evaluation and then use them as inputs for the LSP criterion function. On the other hand, it would be much better if the extraction of inputs could be done automatically using a specialized tool. Then the collected data could be automatically forwarded to a tool that implements the LSP criterion. Fig. 1 shows a realistic situation where automatic extraction of data includes a fraction of total inputs, and remaining inputs are provided by evaluator. Before presenting the problem of automatic data extraction we have to understand the basics of the LSP method.
The values of attributes x1,...,xn, xi∈R, i=1,..., ,n n≥2 are inputs for the LSP criterion function. In the case of real estate, examples of input attributes can be the area of a home (xi), and the home-work distance (xj). For each attribute we specify requirements in the form of an attribute criterion function Ei =g xi( ),i Ei∈[[ , ],0 1 i=1,...,n. For example, we could be perfectly satisfied with the area xi ≥A1, and the area xi ≤A0 could be unacceptable. In such a case the elementary attribute criterion could be
Ei =min{1,max[0,(xi −A0) /(A1−A0)]}, A0 <A1, 0≤Ei ≤1.
So, Ei denotes the degree of satisfaction with the area of evaluated home. Similarly, the distance from home to work xj ≥D0 could be considered unacceptable while the distance xj ≤D1 could perfectly satisfy the homebuyer. In such a case the criterion could be
Ej =min{1,max[0,(D0−xj) /(D0−D1)]}, D1<D0, 0≤Ej ≤1
The resulting values E1,...,En are called elementary preference scores. They express the degree of satisfaction of each specific requirement (0 = no satisfaction, 1 = complete satisfaction). The next step is a logic aggregation of preference E0=L E( ,...,1 En) that computes the overall preference score E0 that reflects the overall ability of the evaluated system to satisfy user requirements. The aggregation process is based on graded logic functions, i.e. functions that provide parameterized continuous transition from conjunction to disjunction. The basic preference aggregation function is the generalized conjunction/disjunction (GCD) [7] that is usually implemented using the weighted power mean:
(
)
1/1 , 0 1, 1 1, [0,1], [0,1], 2
r r
k k
out i i i i i i i out
Using stepwise aggregation of groups of related inputs we can make more complex logic functions [8] and organize the tree-like aggregation structure that eventually yields the overall preference indicator E0, That indicator reflects the overall capability of evaluated system to satisfy user requirements.
The final evaluation and selection step is to use a cost/preference analysis to compute an overall system quality indicator Q0 as a function of the overall preference E0 and the total cost C0. Among many possible cost/preference models the simplest is Q0=E C0/ 0. We assume that the evaluation is regularly performed as a part of the comparison of multiple alternatives and selection of the best system. In such cases competitive systems are ranked according to decreasing values of the overall quality Q0and the system with the highest Q0value is proposed for acquisition.
The presented evaluation process critically depends on our ability to extract relevant, up-to-date inputs for the evaluation process. This nontrivial step combines a spectrum of advanced software tools and technologies [3,11,12,13,19], and in some cases generates only partial results. In this paper we identify major problems related to automated attribute extraction and offer several solutions to this problem. It is important to emphasize that system evaluation is only one of many problems where the Web data extraction techniques are indispensable. Therefore, the results of this paper are applicable in a variety of Web-oriented applications.
3.
Problems of Web Data Extraction
Whenever we access Web data we are faced with a data that are primarily prepared for visual consumption and consequently pay little attention to facilitating programmatic access. Generally, the difficulties are the consequences of the following:
• Intentional barriers designed to impede extraction of proprietary/reusable data:
o Client filtering o Automation policies
o Protected/encrypted display formats o Authentication/verification
• Unintentional barriers:
o Lack of website development standards o Browser quirks mode
Client filtering [10] – Prevents access to content based on the source of the request (usually determined at the IP level). This tactic is a successful barrier against various program-based (“bot”) attacks from common sources.
Automation policies [2] – Directives embedded into web pages that well-behaved programs visiting the site voluntarily obey. This gives site owners a way to declare what data is accessible to bots, and how it should be read.
Protected/encrypted display formats – This may be as simple as shifting content around or heavy-handed such as requiring a browser “plug-in”. This practice can drive traffic away by adversely affecting search engine scores.
Authentication/verification – Restrictions that usually require human involvement, either to enter credentials or to perform a simple task that would be difficult for a program to accomplish (such as CAPTCHA-style puzzles [17]). Most programs are foiled by this type of obstacle.
Lack of website development standards – The same page layout can be coded many different ways using completely different HTML elements, and there are currently no internet-wide standards that govern this.
Quirks mode [12] – Web browsers handle an extraordinary range of coding styles and they can cover up certain serious developer mistakes. This functionality would be difficult to reproduce in a standalone data extraction program without essentially writing a new browser.
Limited experience – The majority of web sites are developed by people with minimal formal programming education [15,16]. No doubt the professionals are concentrated in the e-commerce sector, but the Web is still dominated by a “hobbyist” culture.
Pages optimized for viewing – The web is oriented around free-flowing hyperlinked content. This is nearly opposite the linear, structured format typical of ideal data extraction solutions.
While this is by no means an exhaustive list, it illustrates the magnitude of difficulty involved in designing a general-purpose web data extraction solution, and the fact that there is no single accepted solution for locking down content. In general intentional barriers are easier to overcome than unintentional ones, which tend to result in unpredictable, hard-to-parse pages. It is this random element to site designs more than anything else that complicates any attempt at automated data extraction.
The collective effect of intentional and unintentional barriers results in an overall level of programmatic accessibility called the cooperation level of the site, where fully-cooperative means there exists a convenient and efficient means for extracting useful data, and non-cooperative means data extraction is difficult or impossible.
4.
Data Extraction and LSP Integration
general-purpose data retrieval tool without writing a full browser. Any tool that is built around one or several (or even several dozen) specific data sources would miss out on the vast potential of the internet. Therefore, in this project we attempt to bridge the gap by:
1. Providing a tool to collect data specific to the currently-selected LSP project.
2. Providing automated data-collection features where possible, and general data-entry assistance elsewhere.
3. Defining an open standard for storing and moving system attributes. 4. Creating a data repository based on the standard, featuring an interface
that is compatible with existing LSP tools.
In short, the goal is to help users find and collect the data more efficiently, and make it easier to share and reuse.
The general solution to collecting data from restricted data sources is to emulate human behavior programmatically as much possible, and involve human users when it is unavoidable. To avoid having to rewrite most of the functionality that makes browsers so flexible, a browser extension is the logical solution. Browser extensions (also known as “add-ons”) [13] provide a way to leverage the exceptional parsing ability of common browsers and create a seamless connection to the LSP analytic engine running on a remote server.
There are many ways to present the same set of data, but standard conventions and HTML limitations can be used to frame data retrieval and entry services. Extensions have full access to any currently-displayed HTML data, regardless of the source, so it is possible to view, analyze, and attempt to reconcile it against LSP project data. To analyze data on a given page, the contents must be broken down into a navigable set of related low-level components, and there must be some way to navigate this structure and explore relationships between them, both logical and physical (i.e. position).
Although the underlying page code can often be difficult for programs to analyze, humans have little trouble understanding the displayed content. This is because no matter how stylized and embellished the presentation, and no matter how complex the underlying code is, the data is usually arranged in columns, rows, grids, or other conventional publishing layouts. We can make a program analyze a web page more "intelligently" by forcing it to look past the actual structure, and making it consider what the page actually looks like to a user. Not all pages lend themselves to this approach, but enough do to make it a worthwhile endeavor. The technique is as follows:
1. Search for HTML elements that are typically used to display structured data, such as Tables and DIVs.
3. By finding those inline elements that fall on the same (or close) x-coordinate, we can programmatically discern what elements will form a column of data to the user’s eye, no matter how obfuscated the code is.
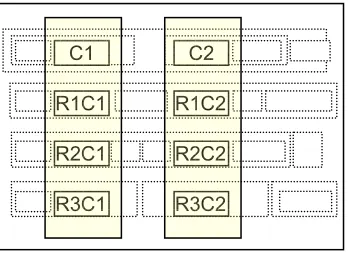
Once the column structure is determined, it is possible to make educated guesses about the content based on criteria and system information in the current project. For example, data for a particular system could be discerned by looking at the top-most element in a column (that with the lowest y value) and, assuming it is a column header, match it against system names in the current project (Fig. 2). If a match is found, further steps can be taken to automatically extract the data into the data entry grid.
Fig. 2. Inferring Page Structure
Each criterion definition includes a regular expression value for the name and the legal values that apply to it. When combined with structural analysis it becomes possible to programmatically “read” data on a web page.
Label/Value Proximity - Attribute searches closely follow the behavior of a human reader performing the same search. First, the current attribute is searched for by label (using regular expressions). Once found, this cell position is used as an anchor for locating the applicable value. The value search goes left-to-right, top-to-bottom (adjusted appropriately for the current locale settings) as a human reader would behave, and values found closer to the label anchor have a higher probability of being correct. When multiple potential matches are found, the values are presented in decreasing order of proximity, with the most probable value being the default. Many page extraction algorithms follow a similar pattern of emulating human reading habits in the hopes of improving extraction accuracy [1].
Once a user has collected some data they can post an update to the repository directly, either to restore it later for further editing, or to immediately run an LSP evaluation. To post the updates, all of the current system data is bundled into a single XML document and posted to the repository server via asynchronous XML (AJAX) calls. In the realm of information extraction systems, this general approach can be categorized as a “supervised multiple-pass record-level wrapper which relies on regular expressions to extract data
C1 C2
R1C1 R1C2
R2C1 R2C2
from semi-structured (HTML) content” [1]. The complete design and implementation details for the LSP/data extraction project can be found in [9].
Figure 3. shows the complete process:
1. The evaluation is set up using standard LSP tools such as ISEE [5] 2. Evaluation metadata is imported into the WebForager server.
3. The WebForager browser add-on uses this information to assist data collection in a normal web browsing session.
4. Collected system data is returned to the LSP server and stored in a neutral format in the repository.
5. The system data is exported to standard LSP tools, and the evaluation results are sent via HTTP back to the browser. To the end-user, this simply appears as a comprehensive report in a new tab in their browser.
LSPCalc WebForager Server ASP.NET ISEE
etc.
Browser Extension XUL 1. Setup LSP project
2. Import into WebForager
3. Data Collection
Web Sites HTML, XML, JScript SQL
5. Run Evaluation
4. Upload System
LSP Evaluation
Download Results to Browser AJAX
HTTP
Fig. 3. Lifecycle of a Web-based LSP Evaluation
5.
Sample Evaluation: Real Estate
Multiple Listing Service (MLS) was created to allow real estate brokers to share listing information in a consistent, centralized, data-driven way, with unique identifiers (MLS numbers) assigned to each property. MLS predates the creation of the Web by decades, but the idea would seem to translate perfectly. Despite this, there are over 900 semi-cooperative local MLS organizations, and consolidation has been slow. The reason for this lack of consolidation is not technical, but most likely grounded in economics [14].
Put simply, MLS data has intrinsic value to the brokers that control it, and it is in their best interest to remain in control. This has the unfortunate effect of dispersing valuable home information, forcing home buyers to either manually consolidate the data themselves, or let their agent determine their “short list” of homes based on some loose criteria. The common sense approach would be exactly opposite: use objective facts to reduce a large list of homes to a short list that all fulfill minimum buyer requirements, then apply the costly and time-consuming in-depth research towards the top-scoring results.
In this case study, we demonstrate how results may be consolidated from several sources, allowing prospective home buyers to run comprehensive LSP evaluations against a list of homes. This can immediately eliminate unqualified homes and highlight those that are most likely to satisfy the buyer.
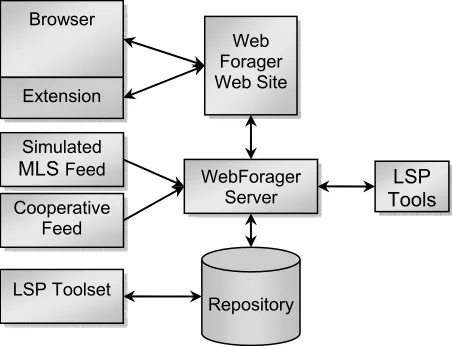
Data is consolidated from three sources (Fig. 4):
• A (simulated) direct MLS feed.
• A regional “independent” real estate web site (with non-MLS listings).
• Data extracted from the pages of a regional real estate web site featuring searchable MLS-based listings.
Fig. 4. LSP/Real Estate Data Integration
LSP Project Setup
This example features a trivial LSP evaluation intended to show how data from disparate web-based sources can be consolidated into a single
Web Forager Web Site
Repository WebForager
Server Browser
Extension
Simulated MLS Feed
LSP Toolset Cooperative
Feed
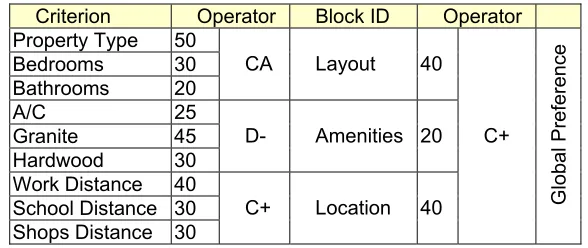
evaluation. The number of elementary criteria and complexity of the aggregation structure could easily be extended to any size. We are mainly interested in a subset of core home data – information that is found in most MLS records. The attributes are based on three major categories (Table 1):
Layout – this includes physical dimensions, number of rooms, etc. (relative importance 40%)
Amenities – a sampling of typical home features, such as hardwood floors and air conditioning (relative importance 20%)
Location – typically these attributes are specific to a given buyer and not made explicit in MLS (relative importance 40%)
Table 1. Preference Aggregation
Criterion Operator Block ID Operator Property Type 50
Bedrooms 30 Bathrooms 20
CA Layout 40
A/C 25 Granite 45 Hardwood 30
D- Amenities 20
Work Distance 40 School Distance 30 Shops Distance 30
C+ Location 40 C+
Global Preference
These three categories are considered mandatory and the strong partial conjunction aggregator (C+) reflects this requirement [4]. The layout aggregator is the medium partial conjunction CA. All partial conjunction aggregators require simultaneous satisfaction of all inputs and punish systems that are unable to provide the required level of simultaneity. Most house-hunting efforts emphasize the physical dimensions and location of a house, and amenities are considered secondary priorities, the rationale being that it is easier to put in new floors than to add an extra room or relocate the house. This is expressed using appropriate weights. The presented criterion also uses a weak partial disjunction aggregator D-, enabling inputs to easily compensate each other.
Data Collection
After the initial LSP project setup and WebForager import, the two external feeds were incorporated (Fig. 4), providing the user with a starting point for comparisons. The remaining records were gathered in an interactive browsing session and uploaded to join the existing data.
Non-standard Feeds - A growing number of alternatives allow buyers and sellers to bypass MLS entirely. These companies could conceivably adopt the XML-based system attribute exchange schema used by the WebForager system. The advantage would be twofold, as they would benefit from a common data exchange, and system data would be directly usable in LSP evaluations.
ListID|PropType|AgentID|AgentName|AgentPhone|OfficeID|Offi... 21234321|SFR|23322112|Bob Smith|555-555-5555|23423432|Real... 21211131|SFR|12233432|Bob Smith|555-555-5555|23423432|Real... 23332111|SFR|73311172|Alice Jones|555-555-5555|23423432|Re... 28733221|SFR|23322112|Alice Jones|555-555-5555|23423432|Re... 26543221|SFR|23322112|Ed Lee|555-555-5555|23423432|Mortgag...
Fig. 5. Sample MLS Data Feed
Extracted Page Data – Some sites allow simple queries, but only a limited number of records are displayed at one time, and there is no mechanism for downloading data for off-line use. To allow this data to be compared against data gathered from other sources, it is extracted and uploaded via the WebForager browser extension (Fig. 6).
Fig. 6. Browser Extension with Simulated Real Estate Listings
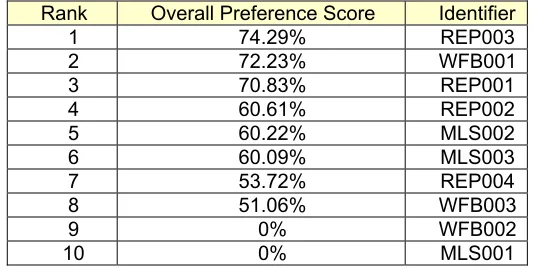
The top three selections were close to each other, while the middle three differed significantly enough to possibly drop them out of contention, and the bottom four were clearly not worth consideration. The overall preference scores are then used as inputs for the cost/preference analysis. This approach gives a buyer and agent the ability to focus on only those homes that are most likely to be satisfactory, and given the time-critical nature of real estate, this could be a tremendous advantage.
Table 2. LSP Preference Ranking
Rank Overall Preference Score Identifier
1 74.29% REP003
2 72.23% WFB001
3 70.83% REP001
4 60.61% REP002
5 60.22% MLS002
6 60.09% MLS003
7 53.72% REP004
8 51.06% WFB003
9 0% WFB002
10 0% MLS001
6. Conclusions
Search engines do an effective job of categorizing and indexing the Web, but the actual data must generally be gathered and analyzed manually. Connecting LSP to live data provided by e-commerce web sites allows it to be used in a wider range of selection problems, and it creates a way to harness the growing volume of data available on the web. Creating this integration entailed solving three basic problems: (1) extracting and transforming data from non-cooperative sites, (2) importing data from cooperative sites, and (3) building a web-server interface to the predominantly single-user-oriented LSP tools.
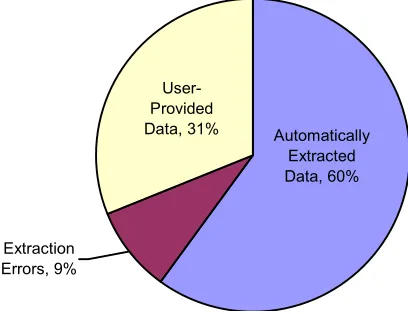
Extraction Errors, 9%
User-Provided
Data, 31% Automatically Extracted Data, 60%
Fig. 7. Typical industry-specific extraction rates
The actual success rate depends on how tightly the tool is tied to the target sites. According to our experiments, a tool that has been tuned for use in a particular industry – automotive sites for example – might experience a 70% - 90% extraction rate on certain specific sites, but overall the typical success rate will be in the 50% - 60% range, leaving users to manually transpose much of the data (Fig. 7). These success rates are not a property of the LSP method, but of information extraction solutions within the e-commerce problem domain. Similar results may be expected in a spectrum of other applications that depend on similarly-structured Web data outside of e-commerce.
An important point to consider in these results is that many website data extraction problems are completely avoidable. Certainly the intentional barriers can be removed at the whim of the site owners, but even the unintentional ones – the most difficult class of problems – are mostly the result of mere habit or lack of standardization.
7. References
1. Chang, C-H, M. Kayed, M.R. Girgis, K.F. Shaalan, A Survey of Web Information Extraction Systems. IEEE TKDE, Vol. 18, No. 10, pp. 1411-1428, October 2006.
2. Crow, D., The Robots Exclusion Protocol;
http://googleblog.blogspot.com/2007/02/robots-exclusion-protocol.html, 2007
3. Darnell et al., HTML Unleashed. Sams Publishing, 1999.
4. Dujmović, J.J., Quantitative Evaluation of Software. Proceedings of the IASTED International Conference on Software Engineering, edited by M.H. Hamza, pp. 3-7. IASTED/Acta Press, 1997.
5. Dujmović, J.J., M. Kadaster, A Technique and Tool for Software Evaluation. Proceedings of the Sixth IASTED International Conference on Software Engineering and Applications (Editor: M.M. Hamza) pp. 743-748, ACTA Press, 2002.
6. Dujmović, J.J., and H. Bai, Evaluation and Comparison of Search Engines using the LSP Method. ComSIS, Vol. 3, No. 2, pp.31-56, December 2006. 7. Dujmović, J.J. and H.L Larsen, Generalized Conjunction/Disjunction.
International Journal of Approximate Reasoning 46 (2007) pp. 423-446. 8. Dujmović, J.J., Preference Logic for System Evaluation. IEEE
Transactions on Fuzzy Systems, Vol. 15, No. 6, pp. 1082-1099, December 2007.
9. Buckley, G., Interfacing the LSP Method with e-commerce Web Sites. Department of Computer Science, San Francisco State University, SFSU-CS-CE-07.16, May 2007.
10. Ellis, E., Speed, T., The Internet Security Guidebook. Academic Press, 2001.
11. Mozilla Foundation: XUL Genealogy: XML - MDC;
http://developer.mozilla.org/en/docs/XUL_Genealogy:_XML. 12. Mozilla Foundation: Mozilla’s Quirks Mode;
http://developer.mozilla.org/en/docs/Mozilla's_Quirks_Mode.
13. Mozilla Foundation, XUL Developer’s Guide; http://www.xulplanet.com. 14. National Association of Realtors, 2006 MLS Technology Survey. Center
for REALTOR® Technology, 2006.
15. Netcraft, March 2007 Web Server Survey. Referenced 3/5/2007; http://news.netcraft.com/archives/web_server_survey.html.
16. U.S. Department of Labor, Bureau of Labor Statistics: Occupational Outlook Handbook for Computer Software Engineers. Referenced 1/20/2007; http://www.bls.gov/oco/ocos267.htm.
17. Von Ahn, L., Blum, M., Hopper, N., Langford, J. The CAPTCHA Project, Carnegie Mellon School of Computer Science; http://www.captcha.net. 18. World Wide Web Consortium, Resource Description Framework.
Referenced 12/2/2006; http://www.w3.org/RDF.
20. World Wide Web Consortium, XHTML™ 1.0 The Extensible HyperText Markup Language (Second Edition); http://www.w3.org/TR/xhtml1, 2002
Greydon Buckley was born in California and received a B.S. and M.S. in Computer Science from San Francisco State University. Since 1990 he has worked as a professional software engineer, primarily developing large-scale financial and planning applications for fortune 1000 companies. His research interests include system integration problems, multidimensional databases, alternative software development methodologies, HCI, and long-term trends in software engineering. Mr. Buckley is currently a member of the Platform Architecture team at CA, Inc., where he is helping to build the next-generation product infrastructure for CA’s industry-leading project and portfolio management application suite.
Jozo J. Dujmović was born in Dubrovnik, Croatia, and received the Dipl. Ing. degree in electronic and telecommunication engineering in 1964, and the M.Sc. and Sc.D. degrees in computer engineering, in 1973 and 1976 respectively, all from the University of Belgrade, Serbia.
Since 1994 he has been Professor of Computer Science at San Francisco State University, where he served as Chair of Computer Science Department from 1998 to 2002. His teaching and research activities are in the areas of soft computing, software metrics and computer performance evaluation. In 1973 he introduced the concepts of andness and orness and logic aggregators based on continuous transition from conjunction to disjunction. He is the author of approximately 130 refereed publications, including 13 books and book chapters. Before his current position at San Francisco State University, he was Professor of Computer Science at the University of Belgrade, University of Florida (Gainesville), University of Texas (Dallas), and Worcester Polytechnic Institute. In addition, he was teaching in the graduate Computer Science programs at the National Universities of San Luis and Jujuy (both in Argentina). At the University of Belgrade, where he was teaching from 1968 to 1992, he also served as Chairman of Computer Science Department, and as founding Director of the Belgrade University Computing Center. His industrial experience includes work in the Institute “M. Pupin” in Belgrade, and consulting in the areas of decision methods, performance evaluation, and software design.
Prof. Dujmović is the recipient of three best paper awards, and a Senior Member of IEEE. He is an editor of Informatica, and served as General Chair of the Eight IEEE International Symposium on Modeling, Analysis and Simulation of Computer and Telecommunication Systems (MASCOTS 2000), and as General Chair of the Fourth ACM International Workshop on Software and Performance (WOSP 2004).