ISSN: 2149-214X
www.jeseh.net
Relationships between Scientific Process
Skills
and
Scientific
Creativity:
Mediating Role of Nature of Science
Knowledge
Gokhan Ozdemir, Ayhan Dikici Omer Halisdemir University
To cite this article:
Ozdemir, G. & Dikici, A. (2017). Relationships between scientific process skills and
scientific creativity: Mediating role of nature of science knowledge.
Journal of Education in
Science, Environment and Health (JESEH), 3
(1), 52-68.
This article may be used for research, teaching, and private study purposes.
Any substantial or systematic reproduction, redistribution, reselling, loan, sub-licensing,
systematic supply, or distribution in any form to anyone is expressly forbidden.
Authors alone are responsible for the contents of their articles. The journal owns the
copyright of the articles.
Relationships between Scientific Process Skills and Scientific Creativity:
Mediating Role of Nature of Science Knowledge
Gokhan Ozdemir, Ayhan Dikici
Article Info
Abstract
Article History
Received: 08 July 2016
The purpose of this study is to explore the strength of relationships between 7th grade students’ Scientific Process Skills (SPS), Nature of Science (NOS) beliefs, and Scientific Creativity (SC) through Structural Equation Modeling (SEM). For this purpose, data were collected from 332 students of two public middle school students in Turkey. SPS, Nature of Scientific Knowledge Scale (NSKS) and SC instruments were used as data collection tools. Zero-order and partial correlation analysis, MANCOVA and ANCOVA analyses were conducted on the data. Two models were hypothesized. In Hypothesized Model 1, it was considered that SPS both directly and indirectly through subscales of NSKS predicted SC; whereas, in Hypothesized Model 2, it was considered that the SPS directly predicted SC. SEM analysis was conducted to test the two hypothesized models. Sobel’s z tests were conducted to examine the significance of the mediator roles of NSKS’s subscales in the relationships between SPS and SC. Results indicated that the relationships between SPS and SC were partially mediated by only the Testable subscale of NSKS; likewise, this relationship was partially mediated by second-order factor NSKS. Finally, we found that the Creative subscale of NSKS has a moderator role on predictive power of the SPS on the SC. Classroom implications obtained from the results are discussed in the paper.
Accepted: 20 November 2016
Keywords
Scientific process skills Scientific creativity Nature of science Creativity
Introduction
Creativity plays an important role in scientific knowledge production process (Hu & Adey, 2002). When scientists undertake research; they use several scientific process skills, creativity and imagination at every phase of their investigations (Hadzigeorgiou, Fokialis, & Kabouropoulou, 2012). Similarly, students use scientific process skills with creative thinking when they are involved in research activities. For example, they develop several possible methods to solve problems. Using scientific process skills such as identifying problem, establishing hypotheses, observing, inferring, choosing method, identifying variables, controlling variables, and making conclusions requires both scientific thinking and creativity in order to develop new methods and solutions to the problems. On the other hand, students’ accurate understanding of nature of science (NOS) that accepts the important role of scientific creativity has been appropriately improved through explicit-reflective inquiry activities in which students use their scientific process skills (Carey, Evans, Honda, Jay, & Unger, 1989; Khishfe & Abd-El-Khalick, 2002). Although the relationships are apparent between the two cognitive variables, which are scientific process skills and scientific creativity, the affective variable, and the beliefs about NOS, there has been no research that investigates statistically the strengths of relationships between these three variables. Therefore, the predictive power of scientific process skills on scientific creativity and the potential mediating role of NOS between scientific process skills and scientific creativity are tested in the current study through Structural Equation Modeling (SEM) analyses. Determining the outcomes of this study is important for classroom practices and curriculum developers.
Theoretical Framework and Literature Review
Olson, 2002). There is a consensus in the literature that creativity can be improved (Amabile, 1996; Baer & Kaufman, 2006; Cropley, 1992; Kaufman & Beghetto, 2009; Torrance, 1968, 1995). Even a typical academic semester without any special instruction can improve students’ scientific creativity (Antink Meyer & Lederman, 2015). Fostering creativity is about teacher behaviors, which includes maintaining an open attitude towards creative ideas or behaviors, showing a humanistic student control, being flexible in thinking and behaving, and valuing independent thinking (Amabile, 1996; Cropley, 1997; Hennessey, 1995; Lubart, 1994; Sternberg & Lubart, 1995). Teachers may encourage students’ creativity or cause it to atrophy. Research emphasizes that the relationship between teacher and student is important for students to develop their creativity (Amabile, Hennessey, & Grossman, 1986; Cropley & Cropley, 2009; Erdogdu, 2006; Torrance, 1968, 1995). Beyond the democratic atmosphere in which teachers provide for their students, scientific creativity is also developed through using scientific process skills and accurate understanding of NOS (Hadzigeorgiou et al., 2012). On the other hand, the appropriate teaching for accurate understanding of NOS is achieved through explicit-reflective inquiry activities in which students employ their scientific process skills. The relational nature of these three components, the SPS, NOS and SC, demand investigation in order to uncover the explanatory power of one to another. These relations will be discussed in the sections that follow.
Scientific Creativity and Scientific Process Skills
The typical properties of creativity are creative imagination and creative thinking (Runco, Nemiro, & Walberg, 1998). If we look over the creative thinking models (e.g. Isaksen & Treffinger, 1985; Osborn, 1953), we can see that several dimensions of creative thinking models intersect with those of SPS. For example, finding and/or solving problems, making predictions, designing experiments, seeking solutions are the common properties of SPS and scientific thinking. Meador (2003) presented that all SPS dimensions (Basic science process skills: Observing, comparing, classifying, measuring, and communicating; Intermediate process skills: Inferring and predicting; Advanced process skills: Hypothesizing, defining and controlling variables) correspond to creative thinking components except “measuring” because measuring does not require creativity. Therefore, it can be easily claimed that SPS elements has explanatory power of scientific creativity.
We have to note that the literature on creativity has a common claim that creativity requires domain-specific knowledge and developed skills (Alexander, 1992; Amabile, 1996; Baer, 1991, 2016; Han, 2003; Kaufman & Baer, 2008). Moreover, divergent thinking, which is one of the curricula components of creativity, depends on domain-specific relevance (Barron & Harrington, 1981). Science is a vital domain in which students learn scientific concepts, theories, and laws as well as develop the cognitive skills necessary for scientific creativity. For example, in a simple problem-based learning activity, a student perceives the problem, explores what is known to develop different strategies for the solution in which combines his knowledge with his imagination and skills to produce new knowledge. All these complex cognitive scientific process aid and trigger scientific creativity. At this point, a student’s scientific process skills such as identifying problem, establishing hypotheses, observing, inferring, choosing method, identifying variables, controlling variables, and making conclusions should explain the level of scientific creativity of the student. Some research found this relationship between SPS and SC. For example, Aktamıs and Ergin (2007) found that 7th grade Turkish students’ SPS scores
positively correlate with those of SC scores. In their subsequent study (Aktamıs & Ergin, 2008); they determined that 7th grade students’ scientific creativities increased when they were exposed to scientific process skills education for a period of 12 weeks.
Scientific Creativity and Beliefs on Nature of Science
ideas and different methodological procedures. Indeed, the same data can be interpreted differently and all interpretations can be scientifically valid. As a result, one can claim that beliefs about NOS predict scientific creativity.
On the other hand, there are some studies to improve students’ beliefs about the nature of science and scientific knowledge through making use of scientific process skills (e.g. Khishfe & Abd-El-Khalick, 2002). The research on this domain indicated that explicit-reflective scientific inquiry activities, where students use scientific process skills, improve their understanding on the nature of science (e.g. Lederman & Abd-El-Khalick, 1998). Some studies support this claim. For example, Ren, Li, Zhang, and Wang (2012), focused on students’ creative imagination, found that Chinese students’ creative imagination improved when involved in science-related competitions and visits to science-related places. It cannot be disregarded that these science-related activities most probably help students to learn NOS and to develop scientific process skills which support their creative imagination. Another study indicated that students who are successful in science have high scores in creative thinking (Ren et al., 2012). Similarly, in a Turkish sample, both general and scientific creativity scores of 6-8th grade students positively correlated to their academic achievement on a science and technology course (Ayverdi, Asker, Öz Aydın, & Sarıtaş, 2012). Another study focused on creative scientific problem finding (Hu, Shi, Han, Wang, & Adey, 2010), and found students’ abilities on this aspect have a developmental trend up until high school. Taking these facts into account, one can claim that beliefs about NOS would have a mediating role between scientific process skills and scientific creativity.
Research Problems
This study is focused on two major questions:
1. To what extent, if any, do middle school students’ Scientific Process Skills (SPS) have predictive power to those of Scientific Creativity (SC)?
2. To what extent, if any, do middle school students’ Nature of Science (NOS) knowledge have mediating roles in the relationship between those of SPS and SC?
Hypotheses
It is predicted that (a) students’ SPS scores will have a direct effect on their SC scores, and (b) students’ NOS scores will have a direct effect on SC scores. Finally, (c) students’ NOS scores will be significant mediators in the relationship between their SPS scores and SC scores.
Hypothesized Model
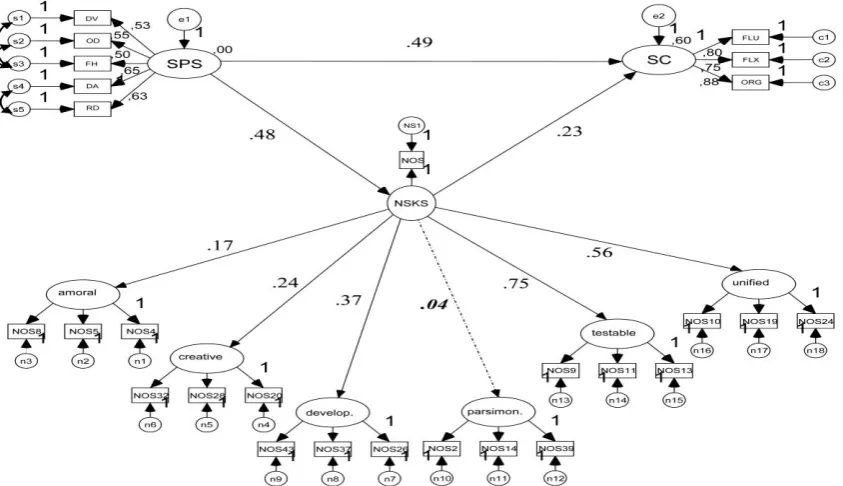
Many studies in the literature found that scientific process skills are a predictor on scientific creativity (e.g. Aktamıs & Ergin, 2008). Also, some studies indicated the relationship between NOS and SC (e.g. Antink Meyer & Lederman, 2015). Others showed that how NOS understanding can be improved by science inquiry where students use their SPS (e.g. Lederman, 2004). Consequently, two models are proposed due to the results reported in previous studies in the relationship between scientific process skills (SPS), Nature of Science (NOS), and scientific creativity (SC). To examine these relationships, two path models were proposed. In the Hypothesized Model 1, it was considered that the SPS, both directly and indirectly through NOS’s dimensions, predicted SC. In the Hypothesized Model 2, it was considered that the SPS directly predicted the SC. Figure 1 presents the model of these hypothesized structural relationships.
Method
Participants
Instruments
Three instruments were used to assess students’ SPS, NOS understanding, and SC. First, the students’ SPS were measured through the Scientific Process Skills Test (SPST) (Okey, Wise, & Burns, 1982). Second, students’ NOS understanding were measured through the Nature of Scientific Knowledge Scale (NSKS) (Rubba & Andersen, 1978). Lastly, students’ SC were measured through the Scientific Creativity (SC) test (Hu & Adey, 2002). The students also provided basic demographic information.
Scientific Process Skills Test
The Scientific Process Skills Test (SPST), originally developed by Okey, Wise, and Burns (1982), was adapted to Turkish by Geban, Aşkar, and Özkan (1992). The Cronbach’s alpha coefficient of the adapted version of the instrument is .81. For the current sample, Cronbach's alpha coefficient was found to be .74, and Kuder– Richardson Formula 20 (KR-20) was found as .78. The Test consists of 36 multiple-choice items. The scale has five sub-dimensions that are defining variables (12 questions), operational defining (6 questions), formulating hypotheses (9 questions), data analyses (6 questions), and research design (3 questions).
Figure 1. Hypothesized models
Note: Solid and dashed lines represent that Scientific Process Skills (SPS) both directly and indirectly through Nature of Scientific Knowledge subscales (Amoral, Creative, Developmental, Parsimonious, Testable, and Unified) predicted Scientific Creativity (SC) (Model 1), whereas only solid line represents the SPS directly predicted SC (Model 2). SPS = Scientific Process Skills, SC = Scientific Creativity.
Nature of Scientific Knowledge Scale
under similar conditions”, and “Scientific knowledge need not be capable of experimental test”. Unified subscales: “The laws, theories, and concepts of biology, chemistry, and physics are related”, and “The laws, theories, and concepts of biology, chemistry, and physics are not linked”.
Scientific Creativity Test
Developed by Hu and Adey (2002), the Scientific Structure Creativity Model (SSCM) was adapted to Turkish by Deniş Çeliker and Balım (2012), with a .86 Cronbach’s alpha coefficient. Cronbach's alpha coefficient was measured to be .81 for the current sample. The Scientific Structure Creativity Model (SSCM) of Hu and Adey (2002) has three dynamic dimensions; product, trait, and process. The Product dimension contains technical product, science knowledge, science phenomena, and science problem; while the Trait dimension contains fluency, flexibility, and originality; and the Process dimension contains thinking and imagination. The following questions were designed by Hu and Adey (2002) in order to measures the combination of attributes in the SSCM.
1. Please write down as many as possible scientific uses as you can for a piece of glass. 2. If you can take a spaceship to travel in the outer space and go to a planet, what scientific
questions do you want to research? Please list as many as you can.
3. Please think up as many possible improvements as you can to a regular bicycle, making it more interesting, more useful and more beautiful.
4. Suppose there was no gravity, describe what the world would be like?
5. Please use as many possible methods as you can to divide a square into four equal pieces (same shape).
6. There are two kinds of napkins. How can you test which is better? Please write down as many possible methods as you can and the instruments, principles and simple procedure. 7. Please design an apple picking machine. Draw a picture, point out the name and function of
each part.
These SC questions measures more than one dimension of the SSCM. Each dimension is associated with different sub attributes among the 24 attribute combinations. For example, Item 1, “Please write down as many as possible scientific uses as you can for a piece of glass” measures all three dimensions. This question forces students to plan and carry out a scientific investigation. Therefore, this task is associated with: (1) science knowledge in Product dimension; (2) fluency, flexibility, and originality in the Trait dimension; and (3) thinking in the Process dimension.
In scoring, each student’s responses, for questions 1, 2, 3, and 4, fluency scores were counted according to the number of responses, regardless of their qualities. For all questions, flexibility scores were counted in terms of the number of response categories (number of designs for Question 6 and number of components for Question 7). For Questions 1, 2, 3, 4, and 6, originality scores were counted in terms of rarity of the responses. If the probability of each response was less than 5%, 2 points were given. If the probability of each response was between 5% and 10%, 1 point was given. If the probability of each response was greater than 10%, it was rated as 0. The originality score for Question 7 was rated out of 5 in terms of the rarity of the each response. Question 5 was omitted in scoring because 12 students recognized that a square can be divided into four equal pieces an infinite numbers of time. So, scoring was deemed impossible.
Two researchers who are authors of this study independently rated students’ responses for each question and counted total SC scores for each student. Then, the two scoring results were compared. The score consistency between the raters was calculated as 98%. A few discrepancies between the raters in terms of scoring of the responses were resolved mutually through discussion.
Procedure
Data Analysis
Using the maximum likelihood method of estimation from AMOS 18, three separate Confirmatory Factor Analyses (CFA) were conducted in order to check whether or not the factor structures of the scales would be confirmed in the present sample. In the first CFA, the SPS model, in which five first-order factors (i.e., defining variables, operational defining, formulating hypotheses, data analyses, and research design) were predicted by second-order factor (i.e., SPS). In the second CFA, the NSKS model, in which six first-order factors (i.e., amoral, creative, developmental, parsimonious, testable, and unified) were predicted by a second-order factor (i.e., NSKS). In the third CFA, the single-factor SC model with three indicators (i.e., fluency, flexibility, and originality) was tested.
MANCOVA and ANCOVA analyses were conducted in order to see whether or not there was a significant effect of demographic variables on the scales. Zero-order and partial correlation analysis were conducted in order to see whether or not there were significant relationships among the variables. These analyses were computed using SPSS 18 software. Structural Equation Modeling (SEM) analysis was conducted in order to examine the mediating role of the NSKS subscales with a robust method (Iacobucci, Saldanha, & Deng, 2007; Kim & Bentler, 2006; Preacher & Hayes, 2004). SEM is a statistical technique for estimating and testing hypothesized causal relationships among latent and/or observed variables (Bryne, 2010). Two models were tested in the SEM analysis using AMOS 18. In the first model, SPS both directly and indirectly through NSKS subscales predicted SC; whereas, in the second model, SPS directly predicted SC. The evaluation of model adequacy was based on the minimum value of the discrepancy function (CMIN/x2), Root Mean Square Residual (RMR), Root Means Square Error of Approximation (RMSEA), Normed Fit Index (NFI), Comparative Fit Index (CFI), Goodness-of-Fit Index (GFI), and Adjusted Goodness-of-Fit Index (AGFI), and its lower and upper confidence interval boundaries (Byrne, 2010; Hair, Black, Babin, & Anderson, 2010; Hu & Bentler, 1995; Schermelleh-Engel, Moosbrugger, & Müller, 2003; Schumacker & Lomax, 2004). All of the items’ scores were changed to standard scores. Outliers were not found to be less than -3.0 or higher than +3.0 (Bakeman & Robinson, 2014). Additionally, linearity, multicollinearity, and singularity assumptions for SEM analysis were met. For Hypothesized Model 1, the multivariate kurtosis = 2.18 and critical ratio = .94 (kurtosis for NSKS subscales, amoral = .51, creative = .50, developmental = .68, parsimonious = .55, testable = .04, unified = .26 in absolute value; for SPS subscales, defining variables = .47, operational defining = .85, formulating hypotheses = .83, data analyses = .56, and research design = .77; and kurtosis for SC = .70) indicated that the data distributions were close to normal. If critical ratio values are higher than 5.00, the data are considered non-normally distributed (Bentler, 2005). If the absolute values of the kurtosis index are higher than 10.0, they suggest a problem. If these values are higher than 20.0, then they suggest an extreme problem (DeCarlo, 1997; Kline, 2005). These problems were not observed in our data. Mahalanobisd2 ranged from 15.94 to 40.77 (p>.001). Because of the large p-values of the Mahalanobis d2, none of the observations under the assumption of normality should be treated as outliers. With these findings, the data were included in the hypothesized model. Thus, maximum likelihood estimation in the SEM analysis was performed for this study. The model was tested that the SPS both directly and indirectly through the NSKS subscales predicted SC. On the basis of the unstandardized beta coefficients and standard error rates, the Sobel’s z tests (Sobel, 1982) were conducted to examine whether or not the mediation models were significant (Baron & Kenny, 1986; Kim & Bentler, 2006; Preacher & Hayes, 2004).
Results
Preliminary Analyses
The Factor Structure of the SPS
Both the first-order factor model and the second-order factor model were tested through CFA in order to validate the factor structures of the SPS. In the first model, the first-order factors (i.e., defining variables, operational defining, formulating hypotheses, data analyses, research design) were predicted by a second-order latent factor (i.e., SPS); whereas, in the second model, the first-order factors were freely estimated regardless of the effect of second-order factor. The results of the CFA demonstrated very good fit for the second order-factor model (x2(2)=1.63; x
2
/df=.82; RMR=.02; RMSEA=.01; NFI=.99; CFI=1.00; GFI=.99; AGFI=.98); whereas, the first order-factor model demonstrated a bad fit (x2(514)=1379.71; x2/df=2.68; RMR=.01; RMSEA=.07; NFI=.58;
indicating that the items in the SPS were significantly predicted by their latent variable (all ps<.001). Notably, SPS strongly predicted defining variables (β=.37), operational defining (β=.69), formulating hypotheses (β=.62), data analyses (β=.51), and research design (β=.52). For the single factor's internal consistency, Cronbach's alpha coefficient (α) was found to be .74, and Kuder–Richardson Formula 20 (KR-20) was found as .78 for the all multiple-choice items. Item difficulty values ranged from .32 to .71.
The Factor Structure of the NSKS
First, internal consistency coefficients of the NSKS the subscales were analyzed. Cronbach's alpha coefficients were found to be .18 for Amoral, .62 for Creative, .28 for Developmental, .04 for Parsimonious, .57 for Testable, and .64 for Unified. Due to the initial low internal consistency, some items were deleted to re-calculate the consistency considering that the number of items in one subscale must be at least three (Comrey, 1988). In the results of the re-analyses, the internal consistency coefficients of the scales ranged from .63 to .77 (i.e., .63 for amoral, .77 for creative, .65 for developmental, .65 for parsimonious, .70 for testable, and .73 for unified) and the whole scale reliability was computed as .68. Later, both the first-order factor model and the second-order factor model were tested through CFA in second-order to validate the factor structure of the NSKS. In the first model, the first-order factors (i.e., amoral, creative, developmental, parsimonious, testable, and unified) were predicted by a second-order latent factor (i.e., NSKS); whereas, in the second model, the first-order factors were freely estimated, regardless of the effect of second-order factor. The results of the CFA demonstrated that the first-order factor model (x2(90)=185.47; x2/df=2.06; RMR=.10; RMSEA=.05; NFI=.86; CFI=.92; GFI=.94;
AGFI=.89) fit the data significantly better than the second-order factor model (x2(7)=22.05; x2/df=3.01;
RMR=.46; RMSEA=.08; NFI=.87; CFI=.90; GFI=.98; AGFI=.94). Both because of these reasons and the scope of this study, both first-order factor (i.e., amoral, creative, developmental, parsimonious, testable, and unified) and second-order factor (i.e., NSKS) were considered in the present study. Standardized parameter estimations ranged from .61 to .80, indicating that the items in the NSKS were significantly predicted by their latent variables (all ps< .001). Notably, NSKS (i.e., second-order factor) significantly predicted amoral (β=-.53, p< .001), creative (β=.23, p< .01), developmental (β=.35, p< .001), testable (β=.79, p< .001), and unified (β=.79,
p< .001) except for parsimonious (β=.02, p> .05) (i.e., first-order factors).
The Factor Structure of the SC
The results of the CFA revealed that the one-factor SC model with three attributes (total scores of fluency, flexibility, and originality) had very good fit to data (x2(27)=0.0; x2/df=0.0; RMR=.00; RMSEA=.07; NFI=1.00;
CFI=1.00; GFI=1.00; AGFI=1.00). The fluency, flexibility, and originality parameter estimations were .75, 79, and.80 respectively. This signifies that SC was considerably predicted by their three attributes (all ps< .001). Finally, the Cronbach’s alpha coefficient was computed as .81.
Effects of Demographic Variables on SPS, SC, and NSKS Subscales
relationships among Amoral, Developmental, and Unified, and between Creative and Parsimonious were negatively significant. Importantly, all significant correlation coefficients ranged in magnitude from small (r= .12) to moderate (r= .50) (see Table 1).
Table 1. Zero-order and partial correlation coefficientsa (N=332)
Variable M SD 1 2 3 4 5 6 7 8
1.SPS 14.86 5.22 -- -.06 .13* .12* -.01 .30*** .26*** .50***
2.Amoral 8.96 2.83 -.05 -- .06 -.23*** -.01 -.10 -.32*** .04
3.Creative 10.67 3.23 .14** .07 -- .03 -.17* .18** .06 .17**
4.Developmental 10.57 2.69 .12* -.22*** .03 -- -.07 .26*** .22*** .25***
5.Parsimonious 8.41 2.89 -.01 -.02 -.17** -.06 -- .05 .10 .02
6.Testable 10.92 3.03 .31*** -.08 .21*** .26*** .03 -- .39*** .38***
7.Unified 10.84 3.02 .26*** -.27*** .08 .23*** .09 .42*** -- .18**
8.SC 47.59 17.50 .49*** .04 .17** .25*** .02 .38*** .19*** --
***p< .001, **p<.01, *p<.05
Note: a Zero-order correlations are below the diagonal, partial correlations are above the diagonal and italics after the controlled for the demographic variables (i.e., gender and age). SPS= Scientific Process Skills. SC= Scientific Creativity. Amoral, Creative, Developmental, Parsimonious, Testable, and Unified are NSKS’s subscales.
These considerable relationships between the SPS, the NSKS’s four subscales (i.e., Creative, Developmental, Testable, and Unified), and SC suggest that it is reasonable to examine the mediating roles of NSKS subscales (Creative, Developmental, Testable, and Unified) in relationships between the SPS and SC (Baron & Kenny, 1986). Although the Amoral and Parsimonious subscales did not play a significant role in the relationships between the SPS and SC, we included the Amoral and Parsimonious subscales in SEM analysis as well, which is a robust method in order to see their parameter estimations.
The Mediating Role of the NSKS Subscales
SEM Analysis
The results of the SEM analysis revealed that Hypothesized Model 2, in which the SPS directly predicted SC (x2(16)=33.14; x2/df=2.07; RMR=.29; RMSEA=.05; NFI=.97; CFI=.98; GFI=.98; AGFI=.95), fit the data better
than Hypothesized Model 1, in which the SPS both directly and indirectly through NSKS subscales (i.e., Amoral, Creative, Developmental, Parsimonious, Testable, and Unified) predicted the SC (x2(284)=1239.96;
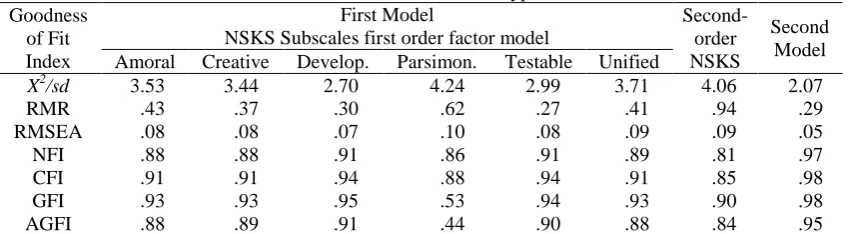
x2/df=4.36; RMR=.39; RMSEA=.10; NFI=.58; CFI=.64; GFI=.78; AGFI=.73). Parameter estimations of the Hypothesized Model 2 is given in Figure 2, and the parameter estimates for Hypothesized Model 1 are given in Figure 3. Due to the poor fit of Hypothesized Model 1, NSKS’s subscales were individually included in six separate SEM analyses. Parameter estimates derived from these analyses are shown in Figure 4.Goodness-of-fit measures obtained from these analyses were not as good as the fit for Hypothesized Model 2. Goodness-of-fit measures of these analyses are shown in Table 2. Also, Table 2 presents Goodness-of-fit measures of the second order factor NSKS (i.e., one factor NSKS) in the SEM analysis.
Table 2. Goodness-of-fit measures of the hypothesized models Goodness
of Fit Index
First Model
NSKS Subscales first order factor model
Second-order NSKS
Second Model Amoral Creative Develop. Parsimon. Testable Unified
X2/sd 3.53 3.44 2.70 4.24 2.99 3.71 4.06 2.07
RMR .43 .37 .30 .62 .27 .41 .94 .29
RMSEA .08 .08 .07 .10 .08 .09 .09 .05
NFI .88 .88 .91 .86 .91 .89 .81 .97
CFI .91 .91 .94 .88 .94 .91 .85 .98
GFI .93 .93 .95 .53 .94 .93 .90 .98
AGFI .88 .89 .91 .44 .90 .88 .84 .95
Note: First Model: The Scientific Process Skills both directly and indirectly through NSKS’s subscales (i.e.,
p < .001
Figure 2. Direct effect between the SPS and SC
Note: SPS: Scientific Process Skills. SC: Scientific Creativity. Estimate: 4.75, S.E.: .65; C.R.: 7.23, : .61 SPS: Scientific Process Skills. DV: Defining Variables, OD: Operational Defining, FH: Formulating Hypotheses, DA: Data Analyses, and RD: Research Design. SC: Scientific Creativity. FLU: Fluency, FLX: Flexibility, ORG: Originality.
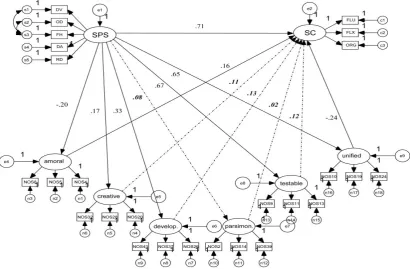
As seen in Figure 2, the standardized direct effects of SPS on SC were statistically significant ( =.61, p<.001). When NSKS subscales (i.e., Amoral, Creative, Developmental, Parsimonious, Testable, and Unified) were all together included in SEM analysis of Hypothesized Model 1, the parameter estimation, which represented the indirect effects of SPS on SC through the NSKS subscales(=.71,p< .001), was still significant and increased. While the effects of four NSKS subscales, Creative, Developmental, Parsimonious, and Testable, on the SC were not statistically significant, Amoral (=.16, p< .05) and Unified (=-.24, p< .05) subscales were significant. However, Sobel (1982) tests did not confirm the mediating roles of Amoral (z=1.62, p>.05) and Unified (z=1.75, p>.05) in relationship between SPS and SC. This means that the relationships between SPS and SC were not mediated by NSKS subscales (see Table 3).
Figure 3. The mediating role of the NSKS subscales
Table 3. Summary of NSKS subscales in SEM analysis Dependent
Variables
Independent
Variables Estimate S.E. C.R. p Sobel’s z
amoral <--- SPS -.28 .12 -2.31 -.20 .021
creative <--- SPS .32 .17 1.91 .17 .056
develop. <--- SPS .43 .13 3.15 .33 .002
parsimon. <--- SPS .03 .01 2.24 .08 .025
testable <--- SPS 1.30 .27 4.82 .67 ***
unified <--- SPS 1.32 .33 4.03 .65 ***
SC <--- SPS 6.32 1.69 3.72 .71 ***
SC <--- amoral 1.04 .45 2.28 .16 .022 1.62
SC <--- creative .51 .29 1.78 .11 .075
SC <--- develop. .85 .52 1.63 .12 .103
SC <--- parsimon. .36 .40 .89 .02 .374
SC <--- testable .54 .52 1.04 .12 .295
SC <--- unified -1.05 .53 -1.96 -.24 .049 1.75
***p< .001, **p< .01, *p< .05
Note: SEM analysis table belongs to the Hypothesized Model 1. SPS: Scientific Process Skills. SC: Scientific Creativity. Amoral, Creative, Developmental, Parsimonious, Testable, and Unified are NSKS’s subscales.
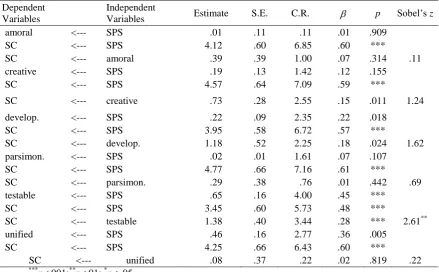
For each of the NSKS’s subscales, six separate SEM analyses were performed as to whether or not any subscale individually mediated in the predictive power of SPS on SC. The changes of the parameter estimates for each subscale are indicated on the solid line between the SPS and SC in Figure 4.
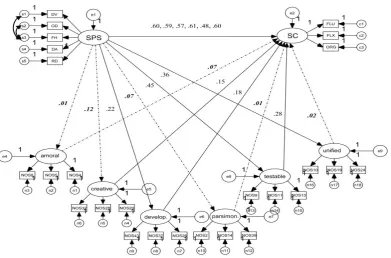
Figure 4. The mediating role of the NSKS subscales
As seen in Figure 4, the standardized direct effects of SPS on SC were still significant ( ranged from .48 to .60, ps<.001). Namely, when NSKS subscales (Amoral .60, Creative .59, Developmental .57, Parsimonious .61, Testable .48, and Unified .60) were separately included in SEM analysis for Hypothesized Model 1, the significant parameter estimations, which represented the indirect effects of SPS on SC through the NSKS subscales, did not change substantially. The lowest parameter estimations belong to the Testable (=.48,
p<.001) and Developmental (=.57, p<.001) for indirect effects of SPS on SC through the NSKS subscales. This means that the relationships between SPS and SC may be only mediated by the Testable and Developmental subscales of the NSKS (see Table 4). In addition to these results, Sobel (1982) tests did not confirm the mediating roles of four NSKS subscales, Amoral, Creative, Developmental, Parsimonious, and Unified, in relationship between SPS and SC (p>.05); whereas, the test confirmed the mediating roles of Testable subscale (z=2.61, p<.01) in this relationship(see Table 4). This finding can be interpreted that the Testable subscale has partially mediating role in predictive power of the SPS on the SC.
Table 4. Summary of separate SEM analyses each NSKS subscales Dependent
Variables
Independent
Variables Estimate S.E. C.R. p Sobel’s z
amoral <--- SPS .01 .11 .11 .01 .909
SC <--- SPS 4.12 .60 6.85 .60 ***
SC <--- amoral .39 .39 1.00 .07 .314 .11
creative <--- SPS .19 .13 1.42 .12 .155
SC <--- SPS 4.57 .64 7.09 .59 ***
SC <--- creative .73 .28 2.55 .15 .011 1.24
develop. <--- SPS .22 .09 2.35 .22 .018
SC <--- SPS 3.95 .58 6.72 .57 ***
SC <--- develop. 1.18 .52 2.25 .18 .024 1.62
parsimon. <--- SPS .02 .01 1.61 .07 .107
SC <--- SPS 4.77 .66 7.16 .61 ***
SC <--- parsimon. .29 .38 .76 .01 .442 .69
testable <--- SPS .65 .16 4.00 .45 ***
SC <--- SPS 3.45 .60 5.73 .48 ***
SC <--- testable 1.38 .40 3.44 .28 *** 2.61**
unified <--- SPS .46 .16 2.77 .36 .005
SC <--- SPS 4.25 .66 6.43 .60 ***
SC <--- unified .08 .37 .22 .02 .819 .22
***
p<.001;**p<.01; *p< .05
Note: SEM analysis table belongs to the Model 1. SPS: Scientific Process Skills. SC: Scientific Creativity. Amoral, Creative, Developmental, Parsimonious, Testable, and Unified are NSKS’s subscales.
Again, second-order factor NSKS (i.e., one factor NSKS) SEM analysis was performed for Hypothesized Model 1. Parameter estimates derived from the analysis are indicated in Figure 5. When second-order factor NSKS were included in the SEM analysis of Hypothesized Model 1, the parameter estimation, which represented the indirect effects of SPS on SC through the second-order factor NSKS, was statistically significant (see Figure 5 and Table 5). Sobel (1982) test confirmed the mediating roles of second-order factor NSKS in relationship between SPS and SC (z=2.38, p<.05) (see Table 5). This finding can be interpreted that the NSKS (i.e., second-order factor NSKS) has a partially mediating role in the relationship between the SPS and SC.
The Moderating Role of the NSKS Subscales
Figure 5. The mediating role of the second-order factor NSKS
Note: Parameter estimations are standardized values. Bold/italic coefficient and dashed line are not statistically significant (p>.05); whereas solid lines are statistically significant (p<.05). SPS: Scientific Process Skills. DV: Defining Variables, OD: Operational Defining, FH: Formulating Hypotheses, DA: Data Analyses, and RD: Research Design. SC: Scientific Creativity. FLU: Fluency, FLX: Flexibility, ORG: Originality. NSKS: Nature of Scientific Knowledge Scale
Table 5. Summary of the second-order factor NSKS in SEM analysis Dependent
Variables
Independent
Variables Estimate S.E. C.R. p Sobel’s z
NSKS <--- SPS 1.54 .33 4.61 .48 ***
SC <--- NSKS .54 .19 2.79 .23 .005 2.38*
SC <--- SPS 3.70 .62 5.93 .49 ***
***p<.001;**p<.01;*p<.05
Note: SEM Analysis Table belongs to the Hypothesized Model 2. SPS: Scientific Process Skills. SC: Scientific Creativity. Creative, Testable, and Unified are NSKS’s subscales.
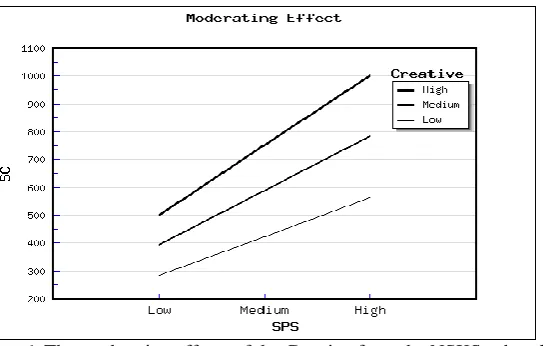
All of the items’ scores were converted to standard scores in order to examine the moderation effect of the NSKS subscales. The multiplications were performed between standard scores of the NSKS subscales and SPS. After that, the moderators obtained from these multiplications were included in the SEM analysis. All subscales of NSKS were tested in SEM analysis. In the results, only the Creative of NSKS subscales was significant (=.18, p<.001); whereas, the others were not significant and standardized parameter estimates ranged from -.08 to .08. Insignificant parameter estimations were .08 for Amoral, .08 for Developmental, .07 for Parsimonious, .05 for Testable, and .03 for Unified (ps>.05). After removing the insignificant subscales of NSKS from the SEM analysis, Goodness-of-fit measures were good fit (x2(1)=3.69, p>.05; x2/df=3.69; RMR=.09; RMSEA=.09;
Figure 6. The moderation effects of the Creative from the NSKS subscales
Note: SPS: Scientific Process Skills. SC: Scientific Creativity. Creative is one of the NSKS subscales. The figure was drawn by utilizing http://pavlov.psyc.vuw.ac.nz/paul-jose/modgraph/cont_fig1.php (Jose, 2013).
Table 6. Summary of moderators in SEM analysis Dependent
Variables
Independent
Variables Estimate S.E. C.R. p
ZSC <--- ZSPS .54 .05 11.18 .54 ***
ZSC <--- Moderator1 .09 .05 1.62 .08 .103
ZSC <--- Moderator2 .20 .06 3.45 .18 ***
ZSC <--- Moderator3 -.09 .06 1.59 -.08 .110
ZSC <--- Moderator4 .06 .04 1.45 .07 .147
ZSC <--- Moderator5 .05 .05 .94 .05 .344
ZSC <--- Moderator6 .03 .05 .67 .03 .501
***p< .001
Note: Moderators are NSKS subscales. Moderator1: Amoral; Moderator2: Creative; Moderator3: Developmental; Moderator4: Parsimonious; Moderator5: Testable; and Moderator6: Unified. ZSPS: Standard Scores of Scientific Process Skills. ZSC: Standard Scores of Scientific Creativity.
As shown in Figure 6, the three lines are not parallel to each other, which confirm the presence of the moderator effect. Because the lines are not intersecting, the interaction between SPS and Creative is sequential. An individual who has high SC also has high SPS and knows the important role of Creativity in science. Similarly, an individual who has poor SC is poor at SPS and unaware of the important role of Creativity in science. The results of the study indicate that beliefs about the Creativity have a moderating effect on the relationship between the SPS and SC.
Discussion
Today’s science education places more attention on innovative thinking, producing and acquiring new ideas, reasoning skills, cognitive development and positive attitudes to science because the current era demands scientifically literate and skilled individuals. In turn, recent literature highlights the role of creativity in science education (Barrow, 2010; Schmidt, 2010). In this context, the results of this study contribute to the literature that students’ SC can be developed by developing their SPS where NOS understanding has a partly mediating role between the two.
knowledge is constructed through repeated tests in light of valid observations and open to public examinations. It means that students who know that current scientifically-accepted knowledge can be questioned through ongoing tests and observations demonstrate better SC. By this means, students have the opportunity to reevaluate and interpret new observations and test results through imaginations and creative thinking.
On the other hand, Amoral, Developmental, Parsimonious, and Unified subscales are not mediated in the relationship between SPS and SC. Amoral subscale can be summarized with the role of moral judgments that scientific knowledge cannot be criticized as good or bad, but scientific applications (i.e., technology). Thus, the students’ perceptions on this issue naturally did not affect their SC. Developmental subscale emphases the changeable nature of scientific knowledge. Despite it is reasonable to expect that students who believe that scientific knowledge can be changed with new data, new methodological designs, and new interpretations of data…etc., SC of the students will be high. According to our results, Developmental subscale had interpretive power on SC, but it did not take on a mediating role. Parsimonious subscale focuses on the simplicity nature of scientific knowledge, which means similar observations in different situations are conceptualized in a small number of concepts. Also, theories explain the nature in a simple manner. This scale was not correlated to SC. Unified subscale sees close relationships between the laws, theories, and concepts of different disciplines of science. According to our findings, even though SPS had predictive power on the subscale, this subscale did not predict SC. This might be due to the students’ grade level, where students know a limited number of concepts from the different fields of science.
Another important result was that although only testable subscale of NSKS had a mediating role in relationship between SPS and SC, this relationship was mediated by second-order factor NSKS (one factor NSKS). This result implies that adequate NOS understanding is required to make a connection between SPS and SC. At this point, the researchers believe that all elements of NOS should be taught in science-related instructions, while students use their SPS in the inquiry activities. This type of learning environment helps students to develop their SC at the same time. Because the predictive power of SPS on SC both directly and indirectly through NOS’s dimensions (i.e., NSKS’s subscales) was increased in Hypothesized Model 1, we tested the interaction moderation effects of NSKS subscales on the relationship between SPS and SC. This test resulted in an important outcome; that Creative subscale of NSKS has a moderating role on the relationship between SPS and SC. This means that Creative subscale of NSKS regulates the relationship between SPS and SC. Students, who knows the important role of imagination and divergent-thinking in scientific knowledge constructions, possibly try out new methodologies, interpret data with new point-of-views, and go on to develop new solutions and ideas. Consequently, their SC gets higher. In terms of classroom practices, teachers not only put in efforts to develop students’ beliefs about NOS understanding focusing on creativity, but they also provide an open-inquiry environment and ill-structured scientific problems for the students in order that they can freely test and share their ideas. As Khishfe and Abd-El-Khalick (2002) stated, “attempts to teach about NOS should be contextualized and woven into inquiry activities and teaching about science content and process skills”. Our result indicated that this way of teaching fosters SC.
Limitations of the Study
The present study has four limitations that will guide further studies. Firstly, the sample consisted of two public middle schools’ students taking general main courses like mathematics, natural science, Turkish language, and social science; and so the results therefore cannot be generalized to other educational fields and levels. Other fields and levels of education such as vocational, theological, private, elementary, and high school education should also be included within samples for further research. A second limitation of the present study is that the data were obtained from two middle schools’ students. Although the school was highly representative of the Turkish science education system, further studies should be conducted based on a larger number of students recruited from different schools across different geographical regions in order to provide more comprehensive results. A third limitation is the cross-sectional nature of the data, with a fourth limitation being data based on self-report measures. The participants’ responses on the items of the NSKS’s subscales may reflect their hopes about the NOS instead of their actual intentions or knowledge. Consequently, possible effects of social desirability may need to be controlled as part of any future studies.
Conclusions
a mediator in relationships between SPS and SC. Third, because only the Testable dimension of NOS among the other dimensions has a mediating role in relationships between the SPS and SC, students who know that current scientifically-accepted knowledge and open-to-public examinations, can be questioned through ongoing tests and observations demonstrate high levels of SC. The fourth conclusion was that the knowledge and perceptions of the students about the role of creativity in science regulate the relationships between their SPS and SC. However, we know that developing SC is more complex and other ways can be tried to foster SC. “Creative problem solving”, “problem solving in the STS context”, “creative writing”, “creative science inquiry”, “creating analogies to understand phenomena and ideas”, “challenging students to find connections among apparently unrelated facts and ideas”, “mystery solving”, and “approaching the teaching and learning of science through the arts” are meaningful ways to improve students’ SC in classrooms (see Hadzigeorgiou et al., 2012).
References
Aktamıs, H., & Ergin, Ö. (2007). Investigating the relationship between science process skills and scientific creativity. Hacettepe University Journal of Education, 33, 11-23.
Aktamış, H., & Ergin, Ö. (2008). The effect of scientific process skills education on students’ scientific creativity, science attitudes and academic achievements. Asia-Pacific Forum on Science Learning and Teaching, 9(1), 1-21.
Alexander, P. A. (1992). Domain knowledge: Evolving themes and emerging concerns. Educational Psychology, 27, 33–51.
Amabile, T. M. (1996). Creativity in context: Update to the social psychology of creativity. Boulder, CO: Westview Press.
Amabile, T. M., Hennessey, B. A., & Grossman, B. S. (1986). Social influences on creativity: The effects of contracted-for reward. Journal of Personality and Social Psychology, 50(1), 14-23.
Antink Meyer, A., & Lederman, N. G. (2015). Creative cognition in secondary science: An exploration of divergent thinking in science among adolescents. International Journal of Science Education, 31(10), 1547-1563.
Ayverdi, L., Asker, E., Öz Aydın, S., & Sarıtaş, T. (2012). Determination of the relationship between elementary students’ scientific creativity and academic achievement in science and technology courses. Elementary Education Online, 11(3), 646-659.
Baer, J. (1991). Generality of creativity across performance domains. Creativity Research Journal, 4, 23-39. Baer, J. (2016). Creativity doesn’t develop in a vacuum. In B. Barbot (Ed.), Perspectives on creativity
development, New Directions for Child and Adolescent Development (pp. 9-20). http://dx.doi.org/ 10.1002/cad.20151
Baer, J., & Kaufman, J. C. (2006). Creativity research in English-speaking countries. In J. C. Kaufman, & R. J. Sternberg (Eds.), The international handbook of creativity. New York, NY: Cambridge University Press. Bakeman, R., & Robinson, B. F. (2014). Understanding statistics in the behavioral science. Mahwah, New
Jersey: Psychology Press.
Baron, R. M., & Kenny, D. A. (1986). The moderator-mediator variable distinction in social psychological research: conceptual, strategic, and statistical considerations. Journal of Personality and Social Psychology, 51(6), 1173-1182. http://dx.doi.org/10.1037/0022-3514.51.6.1173
Barron, F., & Harrington, D.M. (1981). Creativity, Intelligence, and Personality. Annual Review of Psychology, 32, 439-476.
Barrow, L. H. (2010). Encouraging creativity with scientific inquiry. Creative Education, 1, 1-6. Bentler, P. M. (2005). EQS 6 structural equations program manual. Encino, CA: Multivariate Software. Byrne, B. M. (2010). Structural equation modeling with AMOS: Basic concepts, applications, and programming
(2nd ed.). New York: Routledge, Taylor & Francis Group.
Carey, S., Evans, R., Honda, M., Jay, E., & Unger, C. (1989). An experiment is when you try it and see if it works: A study of grade 7 students’ understanding of the construction of scientific knowledge [Special issue]. International Journal of Science Education, 11, 514-529.
Comrey, A. L. (1988). Methodological contributions to clinical research. Factor-analytic methods of scale development in personality and clinical psychology. Journal of Consulting and Clinical Psychology, 56(5), 754-761.
Cropley, A. J. (1992). More ways than one: Fostering creativity. Norwood, NJ: Ablex Publishing Corporation. Cropley, A. J. (1997). Fostering creativity in the classroom: General principles. In M.A. Runco (Ed.), Creativity
Research Handbook, Vol. 1 (pp. 83-114). Cresskill, N. J.: Hampton Press.
Cropley, A. J., & Cropley, D. (2009). Fostering creativity: A diagnostic approach for higher education and organizations. Cresskill, NJ.: Hampton Press.
http://dx.doi.org/10.1037/1082-989X.2.3.292
Deniş Çeliker, H., & Balım, A. G. (2012). Adaptation of Scientific Creativity Test to Turkish and its Assessment Criteria. Uşak University Journal of Social Sciences, 5(2), 1-21.
Edmondson, K. M., & Novak, D. N. (1993). The interplay of scientific epistemological views, learning strategies, and attitudes of college students. Journal of Research in Science Teaching, 30, 547-559. Erdogdu, M. Y. (2006). Relationships between creativity, teacher behaviours and academic success [in Turkish].
Electronic Journal of Social Sciences, 5(17), 95-106.
Geban, Ö., Aşkar, P., & Özkan, İ. (1992). Effects of computer simulation and problem solving approaches on high school. Journal of Educational Research, 86 (1), 5-10.
Hadzigeorgiou, Y., Fokialis, P., & Kabouropoulou, M. (2012). Thinking about creativity in science education.
Creative Education, 3(5), 603-611. http://dx.doi.org/10.4236/ce.2012.35089.
Hair, J. F., Black, W. C., Babin, B. J., & Anderson, R. E. (2010). Multivariate data analysis (7th ed.). Upper Saddle River, New Jersey: Pearson Prentice Hall.
Han, K. S. (2003). Domain-specificity of creativity in young children: How quantitative and qualitative data support it. Journal of Creative Behavior, 37, 117-129.
Hennessey, B. A. (1995). Social, environmental, and developmental issues and creativity. Educational Psychology Review, 7(2), 163-183. http://dx.doi.org/10.1007/BF02212492
Hu, L. T., & Bentler, P. M. (1995). Evaluating model fit. In R. H. Hoyle (Ed.), Structural equation modeling: Concepts, issues, and applications (pp.76-99). Thousand Oaks, CA: Sage Publications.
Hu, W., & Adey, P. (2002). A scientific creativity test for secondary school students. International Journal of Science Education, 24(4), 389-403. http://dx.doi.org/10.1080/09500690110098912
Hu, W., Shi, Q. Z., Han, Q., Wang, X., & Adey, P. (2010). Creative scientific problem finding and its developmental trend. Creativity Research Journal, 22(1), 46-52.
Iacobucci, D., Saldanha, N., & Deng, X. (2007). A meditation on mediation: Evidence that structural equations models perform better than regressions. Journal of Consumer Psychology, 17(2), 139-153. http://dx.doi.org/10.1016
Isaksen, S. G., & Treffinger, D. J. (1985). Creative problem solving: The basic course. Buffalo, NY: Bearly Limited.
Jose, P. E. (2013).ModGraph-I: A programme to compute cell means for the graphical display of moderational analyses: The internet version, Version 3.0. Victoria University of Wellington, Wellington, New Zealand. Retrieved from http://pavlov.psyc.vuw.ac.nz/paul-jose/modgraph/
Kaufman, J. C., & Baer, J. (2008). Role of the domain in creative learning in USA. In A. R. Craft, T. Cremin, & P. Burnard (Eds.), Creative learning 3–11 and how we document it (pp. 27-34). Staffordshire, UK: Trentham Books.
Kaufman, J. C., & Beghetto, R. A. (2009). Beyond big and little: The four c model of creativity. Review of General Psychology, 13, 1-12. doi:10.1037/a0013688
Khishfe, R., & Abd-El-Khalick, F. (2002). The influence of explicit reflective versus implicit inquiry-oriented instruction on sixth grades’ views of nature of science. Journal of Research in Science Teaching, 39(7), 551-578.
Kılıç, K., Sungur, S., Çakıroğlu, J., & Tekkaya, C. (2005). Ninth grade students’ understanding of the nature of scientific knowledge. Hacettepe University Journal of Education, 28, 127-133.
Kim, K. H., & Bentler, P. M. (2006). Data modeling: Structural equation modeling. In J. L. Green, G. Camilli, & P. B. Elmore (Eds.), Handbook of complementary methods in education research (pp. 161-175). Mahwah, NJ: Lawrence Erlbaum.
Kleibeuker, S. W., De Dreu, C. K., & Crone, E. A. (2013). The development of creative cognition across adolescence: Distinct trajectories for insight and divergent thinking. Developmental Science, 16(1), 2-12. Kline, R. B. (2005). Principles and practice of structural equation modeling (2nd ed.). New York: Guilford
Press.
Lederman, N. G. (1992). Students’ and teachers’ conceptions of the nature of science: A review of the research.
Journal of Research in Science Teaching, 29(4), 331-359.
Lederman, N. G. (2004). Syntax of nature of science within inquiry and science instruction. In L. B. Flick, & N. G. Lederman (Eds.), Scientific Inquiry and Nature of Science. Netherlands: Kluwer Academic Publishers.
Lederman, N. G. (2007). Nature of science: Past, present and future. In S. K. Abell & N.G. Lederman (Eds.),
Handbook of research on science education (pp. 831-879). Mahwah, NJ: Lawrence.
Lederman, N. G. & Abd-El-Khalick, F. (1998). Avoiding de-natured science: Activities that promote understandings of the nature of science. In W. McComas (Ed.), The nature of science in science education: Rationales and strategies (pp. 83-126). Dordrecht, The Netherlands: Kluwer Academic. Lubart, T. I. (1994). Creativity. In R. J. Sternberg (Ed.), Thinking and problem solving (pp. 290-332). San
McComas, W. F., & Olson, J. K. (2002). The nature of science in international science education standards documents. In W. F. McComas (Ed.), The nature of science in science education (pp.41-52). Rotterdam: Springer.
Meador, K. (2003). Thinking creatively about science: Suggestions for primary teachers. Gifted Child Today, 26(1), 25-29.
Okey, J. R., Wise, K. C., & Burns, J. C. (1982). Integrated process skill test-2. Department of Science Education, University of Georgia, Athens, GA, 30602.
Osborn, A. F. (1953). Applied imagination: Principles and procedures of creative thinking. NY: Charles Scribner’s Sons.
Preacher, K. J., & Hayes, A. F. (2004). SPSS and SAS procedures for estimating indirect effects in simple mediation models. Behavior Research Methods, Instruments, & Computers, 36(4), 717-731. http://dx.doi.org/10.3758/BF03206553
Ren, F., Li, X., Zhang, H., & Wang, L. (2012). Progression of Chinese students’ creative imagination from elementary through high school. International Journal of Science Education, 34(13), 2043-2059.
Rubba, P. A., & Andersen, H. O. (1978). Development of an instrument to assess secondary school students’ understanding of the nature of scientific knowledge. Science Education 62(4), 449-458. http://dx.doi.org/10.1002/sce.3730620404
Runco, M., Nemiro, J., & Walberg, H. (1998). Personal explicit theories of creativity. Journal of Creative Behavior, 32(1), 1-17.
Ryan, A. G., & Aikenhead G. S. (1992). Students’ preconceptions about the epistemology of science. Science Education, 76, 559-580.
Schermelleh-Engel, K., Moosbrugger, H., & Müller, H. (2003). Evaluating the fit of structural equation models: Tests of significance and descriptive goodness-of-fit measures. Methods of Psychological Research Online, 8(2), 23-74.
Schmidt, A. L. (2010). The battle for creativity: Frontiers in science and science education. BioEssays, 32(12), 1016-1019.
Schumacker, R. E., & Lomax, R. G. (2004). Beginner’s guide to structural equation modeling (2nd ed.). New York: Psychology Press, Taylor & Francis Group.
Sobel, M. E. (1982). Asymptotic intervals for indirect effects in structural equations models. Sociological Methodology, 13, 290-312.
Sternberg, R. J., & Lubart, T. I. (1995). Defying the crowd: Cultivating creativity in a culture of conformity.
New York: Free Press.
Torrance, E. P. (1968). Education and the creative potential. Minneapolis: University of Minnesota Press. Torrance, E. P. (1995). Why fly? A philosophy of creativity. Norwood, N.J.: Ablex Publishing.
Author Information
Gokhan Ozdemir Ömer Halisdemir University 51240-Nigde, Turkey
Contact e-mail: [email protected]
Ayhan Dikici