ISSN: 2149-214X
www.jeseh.net
The Effect of Using Virtual Laboratory
on Grade 10 Students’ Conceptual
Understanding
and
their
Attitudes
towards Physics
Malak Abou Faour, Zalpha Ayoubi
Lebanese University
To cite this article:
Faour, M.A. & Ayoubi, Z. (2018). The effect of using virtual laboratory on grade 10
students’ conceptual understanding and their attitudes towards physics.
Journal of Education
in Science, Environment and Health (JESEH), 4
(1), 54-68. DOI:10.21891/jeseh.387482
This article may be used for research, teaching, and private study purposes.
Any substantial or systematic reproduction, redistribution, reselling, loan, sub-licensing,
systematic supply, or distribution in any form to anyone is expressly forbidden.
Authors alone are responsible for the contents of their articles. The journal owns the
copyright of the articles.
The Effect of Using Virtual Laboratory on Grade 10 Students’ Conceptual
Understanding and their Attitudes towards Physics
Malak Abou Faour, Zalpha Ayoubi
Article Info
Abstract
Article History
Received: 29 June 2017
This study investigated the effect of using (VL) on grade 10 students’ conceptual understanding of the direct current electric circuit and their attitudes towards physics. The research used a quantitative experimental approach. The sample of the study was formed of 50 students of the tenth grade, aged 14 to 16 years old, of an official secondary school in Mount Lebanon. Participants were randomly assigned into two groups of 25 students each. The experimental group was taught using VL, where experimental activities were conducted through Circuit Construction Kit developed by the PhET simulations. However, the control group was taught through interactive demonstrations using real laboratory equipment. Both groups were pre and post-tested by means of two instruments: ―Determining and Interpreting Resistive Electric current Concepts test‖ (DIRECT) and ―Physics Attitude Scale‖ (PAS). The data analysis of the DIRECT test scores showed that, after 10 weeks, the conceptual understanding of the direct current electric circuit had markedly improved in both groups. However, the mean score of the experimental group was significantly higher than that of the control group. On the other hand, there was no significant difference in students' attitudes towards physics between the two groups.
Accepted: 18 November 2017
Keywords
Physics teaching Conceptual understanding Virtual laboratory Interactive demonstrations Students’ attitudes
Introduction
Physics is the science of experimental evidence, criticism, and rational discussion where knowledge and understanding of its concepts depends on the perception of the physical phenomena. Among many researchers in Physics education, Halloun and Hestenes (1985) and McDermott (2001) have shown the ineffectiveness of traditional instructional methods, and shed the light on the lack of understanding science content and processes when students were subjected to conventional teaching of lecture and demonstrations. Resorting to laboratory experiments is one of the main efficient means to make the comprehension of difficult theories simpler and clearer (McDermott, 2001). Meaningful learning, can be achieved when laboratory activities become an integral part of the science curriculum (NSTA, 2007). According to Onyesolu (2009) learning science has been restrained by the deficiency or inadequacy of laboratory equipment in schools. From this standpoint, there is a need for a new unconventional alternative laboratory environment where students can conduct the different required experiments at any time and in safe conditions. One of the solutions that may help in overcoming these obstacles can be the use of virtual laboratories. According to Halloun (1996) resorting to progressively sophisticated software endorses a constructivist approach to learning. Pedagogical principles of inquiry-based learning, exploration, and genuine activities in science support the use of technology in an attempt to provide basic instruction mainly due to the increasing importance of enhancing students’ motivation and engagement in science instruction. Virtual laboratories offer students the opportunity to achieve the learning objectives, while overcoming the aforementioned constraints. Virtual laboratories have therefore arisen in schools and universities as being powerful efficient tools that may offer wide-range alternatives as learning environments that attract students’ interests and may be a great incentive to them (Onyesolu, 2009).
problems she has encountered during her experience in the secondary teaching were: The insufficiency or absence of laboratory facilities; the time factor in planning and performing experiments; and the inability to keep tracking of students’ performance during the activities. Based on this approach, and in order to solve the problems faced, experiments were conducted by replacing the real lab with a virtual lab. According to Aldrich (2005) virtual labs help students conduct experiments and explore phenomena that cannot be conducted in traditional laboratory surroundings, either because it is not feasible or because of the unavailability of essential laboratory equipment.
Virtual Laboratories
Virtual laboratories provide simulated versions of traditional laboratories referring to a learner-centered approach in which the learner is provided with objects that are virtual representations of real objects used in traditional laboratories. Virtual laboratories may contribute to teaching and learning processes by giving students the opportunity to learn by doing, providing them with intriguing and enjoyable activities urging them to discover, and guaranteeing an active classroom interaction by means of discussions and debates (Lkhagva, Ulambayar, & Enkhtsetseg, 2012). The use of virtual laboratories can offer students the opportunity to investigate situations that cannot be tested in real time by speeding up or slowing down time (Aldrich, 2005). They are also beneficial to study advanced concepts such as relativity and experimentation that would not be studied or realized in traditional laboratory settings (Aldrich, 2005, Reese, 2013, Scheckler, 2003). Virtual laboratories offer a visual context for numerous abstract concepts and provide notable visualization and graphical analysis abilities (Wieman & Perkins, 2005).
Virtual lab instruments are used to save space and time. They can be more easily assembled and more properly used than real laboratory equipment, and therefore are more time efficient than traditional hands-on laboratories (Reese, 2013). They may resolve the problem of crowded groups and help the non-visual or auditory learners to interact with their learning environment (Mestre, 2006). In addition, they are cost effective since up-to-date lab equipment and supplies, in addition to their shortage, can have high operational cost in traditional laboratories (Ma & Nickerson, 2006). Dangerous experiments can be safely conducted through virtual laboratories (Scheckler, 2003). Despite all advantages, some researchers highlighted certain disadvantages such the lack of students’ hands-on approach, the lack of lab partner which may facilitate peer-learning (Scheckler, 2003).
Review of Research Comparing Virtual and Traditional Laboratories
The latest modifications and progresses in educational delivery, especially in the field of technology have raised many questions concerning the effectiveness of the virtual laboratory as an instructional tool. One of the studies done in Lebanon in this domain is the one done by Zoubeir (2000). The researcher explored the impact of a constructivist approach through the use of computer projected simulations and interactive engagement approaches. The analysis of the data collected showed an improvement in the conceptual understanding of Newtonian mechanics exclusively in the experimental group that taught with the use of projected simulations. However, the research did not find a statistically significant difference between the two groups neither in students’ views about physics, nor in their performances in the exams (Zoubeir, 2000).
lab on the students’ achievements and attitudes were investigated. Results showed that students’ attitudes towards chemistry have varied according to teaching methods used in the study, and that virtual laboratory practice had a positive influence on students’ achievements and their attitudes toward chemistry when compared to traditional instruction method. Tüysüz (2010) argued that using computer in science teaching is appropriate and convenient, particularly when the content is well employed.
Similarly, Bozkurt and Ilik, carried out a research on 152 physics students at the University level aiming to assess the influence of the use of interactive computer simulations in teaching on students’ achievements and beliefs about physics. For this aim, lessons were taught according to traditional instruction methods for the control group and resorting to computer simulations prepared by PhET for the experimental group. Students were subjected to a pre and post success test, as well as a 5-point Likert scale test (CLASS) used to identify their beliefs on physics and learning physics. The results showed enhancements in the students’ beliefs before and after the treatment. In addition, it was noticed that groups who studied by means of computer simulations had better achievements than those who learned through traditional methods (Bozkurt & Ilik, 2010).
Shegog et al. (2012) conducted a randomized clinical control design study on a sample of 44 students from two high schools to evaluate the skills and knowledge about the molecular labs processes as well as students’ attitudes towards science and computers by using HEADS UP Virtual Molecular Biology Lab as an instructional tool. The Virtual Lab was found to lead to a significant development in students’ knowledge with time; however, the researcher did not notice any significant differences in science attitude scores. Similar results were found by Tsihouridis et al. (2014) who conducted a study in which students were able to use both real and virtual lab according to their educational needs. The results showed that the use of the virtual lab, as a mobile School-Lab, during teaching considerably enhanced the students’ conceptual understanding of certain physics concepts. Recently, Brinson (2015) presented a review 56 articles published in and after 2005 that emphasized on comparing learning achievements by using traditional and non-traditional lab participants as experimental groups. Results proposed that most of the reviewed studies (n=50, 89%) have shown that student learning outcomes were equal or higher in ―Non-traditional Lab‖ in comparison with ―Traditional Lab‖ concerning all learning outcome types (knowledge and understanding, practical skills, inquiry skills, perception, analytical skills, as well as social and scientific communication).
In contrast, Quinn, King, Roberts, Carey, and Mousley (2009) found that students in some conditions could reach a better understanding of topics after hands-on laboratories, when compared to virtual labs. They concluded that it was due to the fast distraction of students while working with simulations, whereas in hands-on laboratories, students were able to maintain focus throughout their involvement. Similarly, specialized establishments for science education, like the National Science Teachers Association, emphasized the roles of hands-on activities in improving students’ interest and acquisition of science skills (NSTA, 2007).
Tsihouridis, Vavougios, and Ioannidis (2013) compared the effectiveness of virtual lab and real school-labs in teaching electric circuits at Upper High-School. The analysis of the collected data showed that there was no significant difference between the two groups in their conceptual understanding of the basic concepts of electric circuits. However, some individual non-significant differences in favor of the real-lab group were observed in the 3 out of 12 teaching objectives. These results led to the conclusion that the two teaching approaches used would decisively help students to develop an investigative attitude relating to everything scientific, their cooperative skills, and their ability to express important queries with clarity and precision.
The review of literature lacks important studies on Arabic students in general and on Lebanese ones in particular, except those done by Zgheib (2013) and Zoubeir (2000). Lebanese students rarely used the virtual lab and the new technology in their learning process due to many barriers (Zgheib, 2013). This study was conducted on Lebanese secondary school students to investigate the effect of virtual physics labs on Lebanese learners.
Purpose of the Study
Based on the above, this study aimed to investigate the effect of using virtual laboratory on grade 10 students’ conceptual understanding of the direct current electric circuit and their attitudes towards physics in terms of students’ confidence, beliefs, and teacher perception.
Research Questions
By choosing the teaching method as an independent variable, and by choosing the students’ conceptual understanding and their attitudes towards physics as dependent variables, the following questions were raised:
1) Does the use of virtual laboratory affect the conceptual understanding of the direct current electric circuit of grade 10 students?
1.1) Is there any significant difference in students’ conceptual understanding as measured by the pre and post-test scores before and after the implementation of virtual laboratory?
1.2) Is there any significant difference in students’ conceptual understanding of direct current electric circuit as measured by the pre and post-test scores before and after the implementation of the interactive demonstrations using real laboratory equipment?
1.3) Is there any significant difference in students’ conceptual understanding, as measured by the post-test scores, between the group performing experiments using virtual laboratory and the other group taught by interactive demonstrations using real laboratory equipment?
2) Does the use of virtual laboratory produce positive attitudes towards Physics?
2.1) Does the use of virtual laboratory enhance the students’ confidence to learn and to perform well on physics tasks?
2.2) Does the use of virtual laboratory affect the students’ beliefs about the usefulness of physics and its relation to their future education?
2.3) Does the use of virtual laboratory enhance students’ perception of their teachers’ attitudes towards them, as learners?
Method
Design
This study used a quantitative experimental pre-test versus post-test control-group design (table 1) in which students were randomly assigned into experimental and control group. The two groups were pre-tested on the dependent variables before the implementation of the study and then post-tested after the treatment has been administered.
Table 1. The experimental design of the study
Control group O1 O2 T1 O3 O4
Experimental group O1 O2 T2 O3 O4
Variables
Sample
The sample of this study consisted of 50 students of grade 10 from the English department of a public secondary school in Mount-Lebanon, during the academic year 2015-2016. Among the participants of this study, 26 were females and 24 were males. The sample was randomly assigned, using random number generator from SPSS statistical software, into experimental group ―A‖ and control group ―B‖, of 25 students each (Table 2).
Table 2. Characteristics of the participants
Group Total Experimental
group A
Control group B
Number of students 50 25 25
Age average 15 years 4 months 15 years 6 months 15 years 3 months
Average of the previous year grades in physics 12.5 12.25 12.75 Standard deviation of the previous year grades in
Physics
4.725 4.95 4.5
Data Collection Instruments
The instruments used in this research included an electricity conceptual understanding test ―Determining and Interpreting Resistive Electric circuits Concepts Test‖ (DIRECT) and the Physics Attitude Scale (PAS).
Determining and Interpreting Resistive Electric Circuits Concepts Test (DIRECT version 1.0)
DIRECT is a diagnostic test developed by Paula Vetter Engelhardt (Engelhardt & Beichner, 2004). This test was used as pre-test and post-test in order to assess students’ conceptual understanding and to compare the efficiency of virtual lab and interactive demonstrations using real lab equipment. The test is based on 11 objectives as appears in table 3. For the purpose of this research, and because two of the objectives were beyond the scope of grade 10’s physics curriculum, only nine objectives were taken into consideration. The eliminated objectives were covered by four questions, which implied the omission of these questions from the test. However, this omission did not affect the validity of the test as these questions only covered the eliminated objectives and did not integrate with other objectives of the instrument. Moreover, one of the concepts that objective nine deals with is the electric field that is beyond the scope of grade 10 physics’ curriculum. Therefore, the question related to electric field concept was eliminated. Hence, only 24 questions were used from this test. To test the reliability of the test after eliminating the five questions, the researcher used Kuder- Richardson formula 20. The established reliability was 0.702. To test the content validity and to ensure that the test actually measures what is intended to measure, the researcher presented the test and the corresponding objectives to two physics teachers having long experiences in the secondary teaching. They asserted that the test was valid and adequate to grade 10 physics’ curriculum.
The Physics Attitude Scale (PAS)
Table 3. The objectives of the direct test used Objectives:
Physical Aspects of DC electric circuits (objectives 1-5):
1) Identify and explain a short circuit (more current follows the path of lesser resistance).
2) Understand the functional two-endedness of circuit elements (elements have two possible points with which to make a connection).
3) Identify a complete circuit and understand the necessity of a complete circuit for current to flow in the steady state (some charges are in motion but their velocities at any location are not changing and there is no accumulation of excess charge anywhere in the circuit).
Objectives 1-3 combined
4) Apply the concept of resistance (the hindrance to the flow of charges in a circuit) including that resistance is a property of the object (geometry of object and type of material with which the object is composed) and that in series the resistance increases as more elements are added and in parallel the resistance decreases as more elements are added.
5) Interpret pictures and diagrams of a variety of circuits including series, parallel, and combinations of the two.
Circuit layout (objectives 1-3, 5) Current (objectives 6-7)
6) Understand and apply conservation of current (conservation of charge in the steady state) to a variety of circuits.
7) Explain the microscopic aspects of current flow in a circuit through the use of electrostatic terms such as electric field, potential differences, and the interaction of forces on charged particles.
Potential difference (Voltage) (objectives 8-9)
8) Apply the knowledge that the amount of current is influenced by the potential difference maintained by the battery and resistance in the circuit.
9) Apply the concept of potential difference to a variety of circuits including the knowledge that the potential difference in a series circuit sums while in a parallel circuit it remains the same.
Current and voltage (objectives 6 and 9) Energy (Eliminated objectives)
Apply the concept of power (work done per unit time) to a variety of circuits.
Apply a conceptual understanding of conservation of energy including Kirchhoff’s loop rule (V=0 around a closed loop) and the battery as a source of energy.
Procedures
To achieve the goal of this research, the sample was randomly assigned into two equal groups of 25 students each. Group ―A‖ was chosen to be the experimental group while Group ―B‖ was chosen to be the control group. The first researcher taught both groups the same content over 10 weeks for three periods per week, of 55 minutes each. The two classes were videotaped, and a randomly selected sample of the videotapes was observed to insure authenticity of the treatment, and to make sure the teacher was implementing the activities as described in the lesson plans. At the beginning of the academic year 2015-2016, each student of each of the two groups completed as pre-tests the DIRECT and the PAS, during 40 minutes and 20 minutes respectively, to investigate their conceptual understanding and attitudes towards physics before the research started. A computer training session was conducted for all students of the experimental group during one period of 55 minutes in which the teacher introduced the PhET simulation software, which will be discussed in the next paragraph, and directed students to some sample laboratory activities.
traditional laboratory settings using real equipment. To carry out the required experiment in the control group, the researcher provided some of the unavailable equipment needed to conduct the experiments. The lack of laboratory equipment from one side and the students’ skills from the other side and many other reasons aforementioned in the rationale of this study obliged the teacher to carry out the experiments by herself. Finally, at the beginning of April, the researcher realized the post-tests. Students of both groups were retested, for 40 minutes, using the same DIRECT test. Also, both groups recompleted, during 20 minutes, the same PAS questionnaire.
PhET Simulation
Physics Education Technology (PhET), are one example of the virtual laboratories’ software and was established by the University of Colorado that covered the curriculum of introductory physics. All simulations are gratis, and can be accessed online or by downloading for off-line use (Finkelstein et al., 2006). PhET simulations create a highly-interactive atmosphere when it comes to user control, active feedback, and use of multiple representations (Podolefsky, Perkins, & Adams, 2010). The simulations are scientifically accurate, and offer highly illustrative, dynamic representations of principles of physics. At the same time, these simulations play a role in building links between students’ daily understanding of the real world and the underlying principles of physics, by making clear the physical models (Finkelstein et al., 2006). They also offer balanced challenges and embedded puzzles that are achievable according to the level of student, thus promoting students’ inquiry (Podolefsky et al., 2010). One of the PhET simulations is the Circuit Construction Kit (CCK). Perkins et al (2006) asserted that the use of the CCK may enable students to carry out experimentations in a similar way to real laboratories. Electric components have default parameters that can be regulated by the user to see the simultaneous changes produced. The CCK simulation’s model is based on Kirchhoff’s laws to accurately describe current and voltage in direct current circuits (Perkins et al., 2006). One of CCK’s most noticeable features is its explicit and clear visual illustration of current flow, which is symbolized by small blue spheres that model the behaviour of electrons. This visual model for current may allow the user to visualize and understand how current flows in a circuit just like experts think about the current flow (Perkins et al., 2006). Upon the features discussed above, the researcher used the PhET simulation to perform experiments in virtual laboratory. Special, CCK was used in this study to perform virtual experiments.
Results and Discussion
Results Related to Research Question One
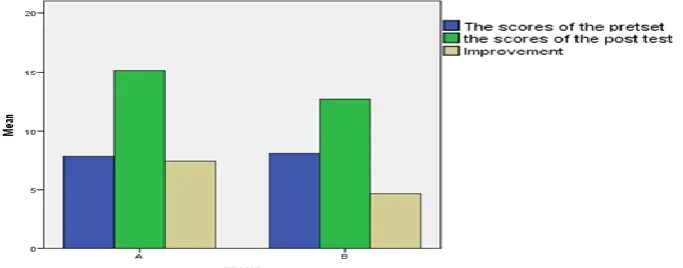
To answer the first research question, an independent T-test was conducted on the pre-test scores of DIRECT. The results of table 4 showed that there was no significant difference between the mean scores of the two groups (p = 0.750), revealing that the two groups do not differentiate at the beginning of the study. To test whether the contribution of virtual lab and interactive demonstrations using real lab equipment produces a conceptual understanding of the direct current electric circuit of grade 10 students, a comparison between the pre and the post-test score was done each group. Figure 1 displays the mean scores for each group (A and B) on the pre-test and the post-test, as well as the improvement score. In addition, the researcher conducted a paired T-test to compare the pre and the post-test scores of both groups. Table 5 shows that there was a significant difference in the scores of pre and post-test for the control group (p = 0.000) and for the experimental group (p = 0.000).
Table 4. Independent samples t-test comparing DIRECT pre-test scores Levene's Test for Equality of Variances
T-test for Equality of Means
F Sig
.
T df Sig.
(2-taile d) Mean Differen ce Std. Erro r Diff eren ce 95% Confidence Interval of the
Difference Lower Upper The scores of the pre-test Equal variances assumed 1.048 .31 1 -.321
-48 .750 -.240- .748
-1.743- 1.263 Equal variances not assumed -.321 -46.60
5 .750 -.240- .748
-1.744- 1.264
Table 5. Paired t-test conducted on DIRECT pre and post-test
Paired Differences t Df Sig.
(2-tailed) Mean Std. Devi ation Std. Error Mean
95% Confidence Interval of the Difference
Lower Upper
Pair 1
The scores of the experimental group "A" on the pre-test - The scores of the
experimental group "A" on the post-test
-7.280- 4.06
7 .813 -8.959-
5.601
-8.949- 24 .000
**
Pair 2
The scores of the control group "B" on the pre-test - The scores of the control group "B" on the post-test
-4.560- 3.87
4 .775 -6.159-
2.961
-5.886- 24 .000
**
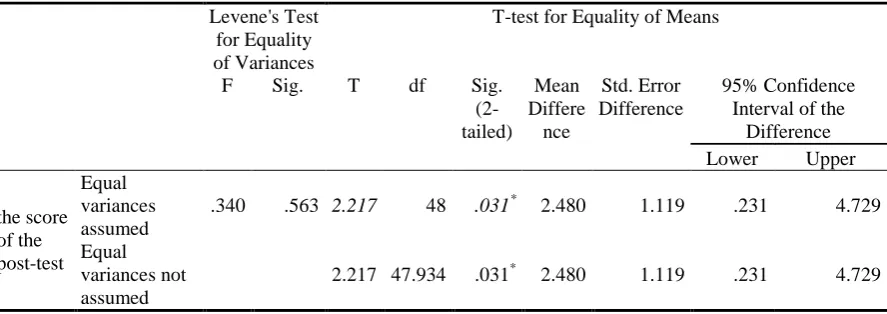
In the aim to compare the conceptual understanding of the direct current electric circuit of the students in the control group to that in the experimental group, the researcher conducted, an independent T-test on the scores of the DIRECT post-test. A significant difference was found between the scores of the two groups (p = 0.031) as appear in table 6.
Table 6. Independent samples t-test comparing groups’ DIRECT post-test scores Levene's Test
for Equality of Variances
T-test for Equality of Means
F Sig. T df Sig.
(2-tailed) Mean Differe nce Std. Error Difference 95% Confidence Interval of the
Difference Lower Upper
the score of the post-test Equal variances assumed
.340 .563 2.217 48 .031* 2.480 1.119 .231 4.729 Equal
variances not assumed
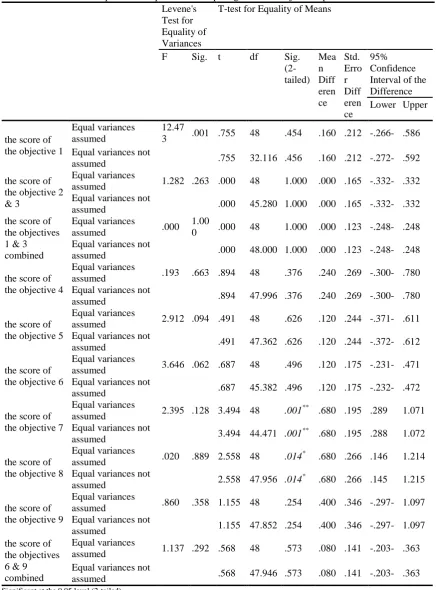
Further analysis on the scores of each objective was done. The score of each objective was calculated as the sum of the scores of the questions that covered it. The result of the independent T-test conducted on the scores of the objectives of the DIRECT post-test (Table 7), showed that there was a significant difference between the two groups only on the scores of the objective 7 (p = 0.001) and the scores of objective 8 (p = 0.014).
Table 7. Independent samples t-test comparing DIRECT objectives post-test scores Levene's
Test for Equality of Variances
T-test for Equality of Means
F Sig. t df Sig.
(2-tailed) Mea n Diff eren ce Std. Erro r Diff eren ce 95% Confidence Interval of the Difference Lower Upper
the score of the objective 1
Equal variances assumed
12.47
3 .001 .755 48 .454 .160 .212 -.266- .586 Equal variances not
assumed .755 32.116 .456 .160 .212 -.272- .592
the score of the objective 2 & 3
Equal variances
assumed 1.282 .263 .000 48 1.000 .000 .165 -.332- .332 Equal variances not
assumed .000 45.280 1.000 .000 .165 -.332- .332
the score of the objectives 1 & 3 combined
Equal variances
assumed .000
1.00
0 .000 48 1.000 .000 .123 -.248- .248 Equal variances not
assumed .000 48.000 1.000 .000 .123 -.248- .248
the score of the objective 4
Equal variances
assumed .193 .663 .894 48 .376 .240 .269 -.300- .780 Equal variances not
assumed .894 47.996 .376 .240 .269 -.300- .780
the score of the objective 5
Equal variances
assumed 2.912 .094 .491 48 .626 .120 .244 -.371- .611 Equal variances not
assumed .491 47.362 .626 .120 .244 -.372- .612
the score of the objective 6
Equal variances
assumed 3.646 .062 .687 48 .496 .120 .175 -.231- .471 Equal variances not
assumed .687 45.382 .496 .120 .175 -.232- .472
the score of the objective 7
Equal variances
assumed 2.395 .128 3.494 48 .001
**
.680 .195 .289 1.071 Equal variances not
assumed 3.494 44.471 .001
** .680 .195 .288 1.072
the score of the objective 8
Equal variances
assumed .020 .889 2.558 48 .014
*
.680 .266 .146 1.214 Equal variances not
assumed 2.558 47.956 .014
* .680 .266 .145 1.215
the score of the objective 9
Equal variances
assumed .860 .358 1.155 48 .254 .400 .346 -.297- 1.097 Equal variances not
assumed 1.155 47.852 .254 .400 .346 -.297- 1.097
the score of the objectives 6 & 9 combined
Equal variances
assumed 1.137 .292 .568 48 .573 .080 .141 -.203- .363 Equal variances not
assumed .568 47.946 .573 .080 .141 -.203- .363
Results Related to Research Question Two
First, an independent T-test was conducted to compare the PAS pre-test total scores and scores of the subscales, for the two groups. The results of the total score (p = 0.720), the confidence subscale score p = 0.879, the usefulness subscale score (p = 0.911), and the teacher perception subscale score (p = 0.409) did not present any significant difference between the two groups as shown in table 8. These results revealed that the two groups did not differentiate regarding the attitude before the implementation of the study.
In the aim of investigating whether the contribution of each teaching method (virtual lab versus interactive demonstrations using real lab) produced a better positive attitude towards physics, the researcher compared the means of the total score of PAS as well as the score of each of its subscales, before and after the implementation of the study, for both control and experimental group. Figure 2 displays, for each of the two groups, the mean of the total score of PAS of the pre-test and the post-test as well as the mean score of each subscale. Comparing the pre and the post-test scores of PAS, the result of the paired T-test (table 9) for the experimental group (p = 0.000) presented a significant difference. However, no significant difference was presented for the control group (p=0.238).
Table 8. Comparison between PAS and its subscales pre-test scores Levene's Test
for Equality of Variances
T-test for Equality of Means
F Sig. t df Sig.
(2-tailed)
Mean Differenc
e
Std. Error Differ ence
95% Confidence Interval of the
Difference Lower Upper the score of
the pre-test
Equal variances
assumed 1.124 .294 -.361- 48 .720 -1.920- 5.319 -12.614- 8.774
Equal variances
not assumed -.361- 45.079 .720 -1.920- 5.319 -12.632- 8.792
the total of subscale
Co
Equal variances
assumed 1.699 .199 -.153- 48 .879 -.400- 2.610 -5.649- 4.849
Equal variances
not assumed -.153- 46.561 .879 -.400- 2.610 -5.653- 4.853
the total of subscale U
Equal variances
assumed 1.688 .200 -.113- 48 .911 -.240- 2.126 -4.514- 4.034
Equal variances
not assumed -.113- 44.438 .911 -.240- 2.126 -4.523- 4.043
the total of subscale T
Equal variances
assumed .341 .562 -.833- 48 .409 -1.280- 1.537 -4.370- 1.810
Equal variances
not assumed -.833- 47.933 .409 -1.280- 1.537 -4.370- 1.810
Table 9. Paired t-test conducted on PAS pre and post-test
Paired Differences t df Sig. (2-tailed) Mean Std.
Deviati on
Std. Error Mean
95% Confidence Interval of the Difference Lower Upper
Pair 1
the total score of the pre-test of the group A - the total score of the post-test of the group A
-21.360- 23.668 4.734 -31.130- -11.590- -4.512- 24 .000**
Pair 2
the total score of the pre-test of the group B - the total score of the post-test of the group B
-5.920- 24.447 4.889 -16.011- 4.171 -1.211- 24 .238
**
. Significant at the 0.01 level (2-tailed).
In order to investigate whether the use of virtual laboratory produced positive attitudes towards Physics, the total scores and the subscales scores of the PAS post-test were analysed. The mean of the experimental group was slightly greater than the mean of the control group as appears in table 10. On the other hand, as shown in table 10, the mean scores of the subscales of the experimental groups were slightly higher than those of the control group. However, as shown in table 11, the result of the independent T-test conducted on the total scores of the PAS post-test did not present significant difference nor regarding students’ attitudes towards physics between the two groups, neither regarding the subscales, except in the teacher perception subscale (p = 0.046).
Table 10. Descriptive statistics of the PAS post-test scores
group N Mean Std. Deviation Std. Error Mean
the score of the PAS post-test A 25 121.00 31.278 6.256
B 25 107.48 34.328 6.866
the score of post-test of the subscale Co
A 25 38.88 10.948 2.190
B 25 36.08 12.430 2.486
the score of post-test of the subscale U
A 25 39.40 11.225 2.245
B 25 34.76 11.837 2.367
the score of post-test of the subscale T
A 25 42.72 10.188 2.038
B 25 36.64 10.743 2.149
Table 11. Comparison between PAS post-test and its subscales scores
Levene's Test for Equality of Variances
T-test for Equality of Means
F Sig. t df Sig. (2-tailed ) Mean Differ ence Std. Error Differ ence 95% Confidence Interval of the Difference Lower Upper the score of
post-test of PAS
Equal variances
assumed .535 .468 1.456 48 .152 13.520 9.288 -5.155- 32.195 Equal variances not
assumed 1.456 47.590 .152 13.520 9.288 -5.159- 32.199 the score of
post-test of the subscale Co
Equal variances not
assumed 1.456 47.590 .152 13.520 9.288 -5.159- 32.199 Equal variances not
assumed .845 47.247 .402 2.800 3.313 -3.863- 9.463 the score of
post-test of the subscale U
Equal variances
assumed .161 .690 1.422 48 .161 4.640 3.263 -1.920- 11.200 Equal variances not
assumed 1.422 47.865 .161 4.640 3.263 -1.920- 11.200 the score of
post-test of the subscale T
Equal variances
assumed .301 .586 2.053 48 .046
*
6.080 2.961 .126 12.034 Equal variances not
assumed 2.053 47.866 .046
*
6.080 2.961 .126 12.034
*
Discussion
Discussion Related to the First Research Question
Data collected from the DIRECT test were addressed to answer the first research question. The analysis of the DIRECT post-test results showed that students of the experimental group that used the virtual laboratory performed significantly better than those of the control group who were taught through interactive demonstrations using real lab equipment. In spite of the small size of the sample, testing by the DIRECT test showed clearly that the use of virtual laboratory induced a considerable change in students’ conceptual understanding of the direct current electric circuit. The significant difference between the two groups appeared mainly in the questions of the objective 7 and the objective 8 that are related to the microscopic aspect of the electric current and the relation between the current, the resistance in the circuit, and the potential difference applied. This result may be due to the property of the Circuit Construction Kit (CCK) simulation of PhET that explicitly explains the microscopic aspect of the direct current. The CCK represents the invisible electrons with blue spheres and shows their supposed motion inside the circuit, and how this motion can be affected with the resistance in the circuit of the potential difference of the source; therefore, it demonstrates how the light of the bulb changes and then how the amount of current changes with the previous mentioned factors. Such visualizations cannot be done by means of traditional real lab (Perkins et al., 2006). Therefore, the importance of virtual laboratories has lied in its ability to introduce the concepts by referring to the microscopic level in contrast to the real lab that only shows the macroscopic properties (Wieman & Perkins, 2005).
The findings of this research affirm the ones of previous studies such as Finkelstein et al. (2006), Shegog et al. (2012), Tüysüz (2010), Tsihouridis, Vavougios, and Ioannidis (2013), and Zoubeir (2000). However, the results of this research are not compatible with some previous researches such as those done by ACS (2011), NSTA (2007), Quinn et al. (2009), Tsihouridis et al. (2014), and Zacharia (2007). The inconsistency in this study’s findings with some earlier researches may be due to the type of the concepts taught, type of the virtual laboratory used, the intervention of extraneous variables, the size of the sample, the various designs used, the statistical analysis and many other reasons. Consequently, more researches are needed in this domain.
Discussion Related to the Second Research Question
To assess the effect of the use of virtual laboratory on students’ attitude towards physics, data collected from PAS were analysed. Results indicated that attitudes of the experimental group students towards physics significantly improved after the treatment in a general perspective, and in subscales perspective. However, except for the usefulness subscale, there was no significant improvement in the attitudes of the control group students in general, neither in the other two subscales. However, there were no significant differences between the experimental and the control group regarding students’ attitudes towards physics. This finding is similar to the results of some studies such as Shegog et al. (2012), and Zoubeir (2000). However, it contradicts the results of the study done by Bozkurt and Ilik (2010), and Tüysüz (2010), where attitudes of students towards chemistry have improved and positively influenced when compared to those of the traditional teaching. The lack of significant difference between the experimental group and the control group regarding students’ attitudes towards physics may be due to many reasons. One of these reasons can be attributed to language problems. It may be difficult for non-English speakers to understand the questions of PAS that are related to their confidence to learn physics, to their beliefs about usefulness of physics, and to students’ perception of their physics teachers and what their teachers think of the students’ physics levels.
Conclusion
The analysis of the gathered data clearly presents that after 10 weeks of treatment, students significantly improved in term of conceptual understanding of the direct current electric circuit in both experimental and control groups. Moreover, the mean score of the experimental group students was better and showed some difference compared to that of the control group. Regarding the attitudes towards physics, the collected data did not show any significant difference between the two groups except in the teacher perception subscale. These results led to the conclusion that:
The use of either teaching method (virtual laboratory or interactive demonstrations using real lab) enhances the conceptual understanding of students.
The use of virtual laboratory has a better effect than the interactive demonstrations using real lab equipment regarding the conceptual understanding of the direct current electric circuit.
the use of virtual laboratory does not influence the attitudes more than the real lab does.
the use of virtual laboratory promotes the students’ perception of their teachers’ attitudes towards them as learners.
Recommendations
The findings of this study may be a platform for further future researches.
First, three chapters of the electricity unit were the fertile fuel of this study. In order to be able to generalize the results it is important to investigate the effect of virtual laboratory on other domains like mechanics, waves, optics, or in the domains where experiments cannot be conducted in the school lab like relativity and radioactivity.
Second, the DIRECT post-test was administrated to the students directly after the implementation of the study. It is highly recommended to detect the degree of the retention this sample of students will still have after a long period of time by testing the long term retention of the gained concepts, for the same sample of students, at the end of the academic year or even at the beginning of their next academic year in grade 11.
Third, many researchers highlighted the point related to students’ practical laboratory skills that may be negatively affected by using virtual laboratory. It is necessary to guide a research that investigates how the use of virtual laboratory may affect these skills.
References
Alameh, S. K. (2013). The impact of using computers as cognitive tools on grade 10 Lebanese students’
attitudes and conceptual understanding in physics. Unpublished master thesis. American university of Beirut. Beirut, Lebanon.
Aldrich, C. (2005). Learning by doing: A comprehensive guide to simulations, computer games, and pedagogy
in e-Learning and other educational experiences. San Francisco, CA: Wiley, Pfeiffer.
American Chemical Society. (2011). Importance of hands-on laboratory activities. American Chemical Society
Public Policy Statement. Retrieved from:
https://www.acs.org/content/dam/acsorg/policy/publicpolicies/invest/computersimulations/hands-on-science.pdf Bozkurt, E., & Ilik, A., (2010). The effect of computer simulations over students’ beliefs on physics and physics
success. Procedia Social and Behavioral Sciences, 2(2), 4587–4591. doi:10.1016/j.sbspro.2010.03.735 Brinson, J. R. (2015). Learning outcome achievement in non-traditional (virtual and remote) versus traditional
(hands-on) laboratories: A review of the empirical research. Computers & Education, 87, 218-237. doi: 10.1016/j.compedu.2015.07.003
Centre for Educational Research and Development (CERD). (1995). New Lebanese educational ladder. Beirut, Lebanon: CERD.
Doepken, D., Ellen, L., & Linda , P. (n.d.). Modified fennema-sherman attitude scales. Retrieved from: http://www.stuckonscience.org/StuckonScience/Teachers_Only/Entries/2014/3/19_Fixed_vs._Growth_Mindset
__Awareness_comes_First!_(Part_1)_files/Math%20Attitude%20Self%20Survey.doc
Engelhardt, P., & Beichner, R., J. (2004). Students’ understanding of direct current resistive electrical circuits.
Finkelstein, N. D., Adams,W. K., Keller, C. J., Perkins, K. K., Wieman, C., &, the Physics Education Technology Project Team. (2006). High-tech tools for teaching physics: the physics education technology project. MERLOT Journal of Online Learning and Teaching, 2(3), 110-120. Retrieved from: http://jolt.merlot.org/vol2no3/finkelstein.pdf
Halloun, I. A. (1996). Schematic modeling for meaningful understanding of physics. Journal of research in science teaching, 33(9), 1019 -1041.
doi:10.1002/(SICI)1098-2736(199611)33:9<1019::AID-TEA4>3.0.CO;2-I
Halloun, I. A., & Hestenes, D. (1985). The initial knowledge state of college physics students. American
Journal of Physics, 53(11), 1043-1048. doi: 10.1119/1.14030
Keller, C. J., Finkelstein, N. D., Perkins, K. K. & Pollock, S. J. (2007). Assessing the Effectiveness of a Computer Simulation in Introductory Undergraduate Environments. In Proceedings of AIP
Conference, 883. doi: 10.1063/1.2508707
Lkhagva, O., Ulambayar, T., & Enkhtsetseg, P. (2012). Virtual laboratory for physics teaching. In Proceedings
of theInternational Conference on Management and Education Innovation, IPEDR, 37, Singapore (PP.
319-323). Retrieved from: http://www.ipedr.com/vol37/062-ICMEI2012-E10015.pdf
Ma, J., & Nickerson, J. V. (2006). Hands-on, simulated, and remote laboratories: a comparative literature review. ACM Computing Surveys, 38(3), 1-24. doi: 10.1145/1132960.1132961
Mallory, C. R., (2012). Evaluating learning outcomes in introductory chemistry using virtual laboratories to support inquiry based instruction (Doctoral dissertation). Retrieved from ProQuest Dissertations and Theses database. (UMI No.3522177)
McDermott, L. C. (2001). Oersted Medal Lecture 2001: ―Physics Education Research—The Key to Student Learning‖. American Journal of Physics, 69(11),1127-1137. doi: 10.1119/1.1389280
Mestre, L. (2006). Accommodating Diverse Learning Styles in an Online Environment. Reference & User Services Quarterly, 46(2), 27-32. Retrieved from: http://www.jstor.org/stable/20864644
National Science Teachers Association. (2007). NSTA Position Statement: The Integral Role of Laboratory
Investigations in Science Instruction. Retrieved from:
http://www.nsta.org/about/positions/laboratory.aspx
Onyesolu, M. O. (2009). Virtual Reality Laboratories: An Ideal Solution to the Problems Facing Laboratory Setup and Management. In Proceedings of the World Congress on Engineering and Computer Science
2009(WCECS 2009) I, San Francisco, USA. doi:10.1016/j.compedu.2016.02.002
Perkins, K., Adams, W., Dubson, M., Finkelstein, N., Reid, S., Wieman, C., &LeMaster, R. (2006). PhET: Interactive simulations for teaching and learning physics. The Physics Teacher, 44(1), 18-23. doi: 10.1119/1.2150754
Podolefsky, N. S., Perkins, K. K., and Adams, W. K., (2010). Factors promoting engaged exploration with computer simulations. The American Physical Society, (6)2, 020117/1-020117/11.
doi: 10.1103/PhysRevSTPER.6.020117
Quinn, J. G., King, K., Roberts, D., Carey, L., & Mousley, A. (2009). Computer-based learning packages have a role, but care needs to be given as to when they are delivered. Bioscience Education, 14(1). doi: 10.3108/beej.14.5
Reese, M. C. (2013). Comparison of student achievement among two science laboratory types: Traditional and virtual (Doctoral dissertation). Retrieved from ProQuest Dissertations and Theses database. (UMI No 3590234)
Scheckler, R. K. (2003). Virtual labs: a substitute for traditional labs? International Journal of Developmental Biology, 47, 231-236. Retrieved from:
http://www.ijdb.ehu.es/web/descarga/paper/12705675
Shegog, R., Lazarus, M. M., Murray, N. G., Diamond, P. M., Sessions, N., Zsigmond, E. (2012).Virtual transgenics: Using a molecular biology simulation to impact student academic achievement and attitudes.
Research in Science Education, 42(5), 875-890. doi:10.1007/s11165-011-9216-7
Tsihouridis Ch., Vavougios D., &Ioannidis G. S. (2013). The effectiveness of virtual laboratories as a contemporary teaching tool in the teaching of electric circuits in Upper High School as compared to that of real labs. In Auer M.E. (Eds.), In Proceedings of the 16th International Conference on Interactive
Collaborative Learning ICL 2013 & the 42nd International Conference on Engineering Pedagogy IGIP
2013, Kazan, Russia (pp. 816-820). doi: 10.1109/ICL.2013.6644714
Tsihouridis Ch., Vavougios D., Ioannidis G. S., Alexias A., Argyropoulos Ch., Poulios S. (2014). Using sensors and data-loggers in an integrated mobile school-lab setting to teach Light and Optics. In Auer M.E. (Eds.) Proceedings of 2014 International Conference on Interactive Collaborative Learning, (ICL2014), Dubai (pp. 439-445). doi: 10.1109/ICL.2014.7017813
junior high-school learners. In Proceedings of 2015 International Conference on Interactive
Collaborative Learning (ICL), Florence, Italy (pp. 643-649). DOI: 10.1109/ICL.2015.7318102
Tsihouridis Ch., Vavougios D., Ioannidis G. (2016, September). The effect of switching the order of experimental teaching in the study of simple gravity pendulum – A study with junior high-school learners. In Auer et al. (Eds.). In Proceedings of 19th International Conference on Interactive Collaborative
Learning (ICL2016), and 45th IGIP International Conference on Engineering Pedagogy, Belfast (pp. 877
– 890). doi: 10.1007/978-3-319-50337-0_47
Tüysüz C. (2010). The Effect of the virtual laboratory on students’ achievement and attitude in chemistry.
International Online Journal of Educational Sciences, 2(1), 37-53. Retrieved from: http://www.iojes.net//userfiles/Article/IOJES_167.pdf
Wieman, C., & Perkins, K. (2005). Transforming physics education. Physics Today, 58(11), 36-41. doi: 10.1063/1.2155756
Zacharia, Z. C. (2007). Comparing and combining real and virtual experimentation: an effort to enhance students' conceptual understanding of electric circuits. Journal of Computer Assisted Learning, 23(2), 120-132. doi: 10.1111/j.1365-2729.2006.00215.x
Zgheib R. S. (2013). Organizational support of technology integration in one school in Lebanon (Doctoral dissertation). Retrieved from ProQuest Dissertations and Theses database. (UMI No. 3596298)
Zoubeir, W. F. (2000). Grafting computer projected simulations and interactive engagement methods within a traditional classroom setting: the influence on secondary level students' understanding of Newtonian
mechanics and on attitudes towards physics (Doctoral dissertation). Retrieved from ProQuest
Dissertations and Theses database. (UMI No. 9988370)
Author Information
Malak Abou Faour
Lebanese University, Faculty of Education Beirut, Lebanon
Contact e-mail: [email protected]
Zalpha Ayoubi