Available online on 15.07.2017 athttp://jddtonline.info
Journal of Drug Delivery and Therapeutics
Open Access to Pharmaceutical and Medical Research
© 2011-17, publisher and licensee JDDT, This is an Open Access article which permits unrestricted noncommercial use, provided the original work is properly cited
Open
Access Research Article
DEVELOPMENT AND VALIDATION OF NEW SIMPLE, SENSITIVE AND
VALIDATED UV-SPECTROPHOTOMETRIC AND RP-HPLC METHOD
FOR THE SIMULTANEOUS ESTIMATION OF PARACETAMOL AND
ETODOLAC IN MARKETED FORMULATION
Ameen Shaikh
1*, Gurdeep Singh
1, Neetesh K Jain
1, M.K.Gupta
1Department of Pharmacy, Oriental University, Indore, India
ABSTRACT
A simple, precise and highly selective analytical method was developed for simultaneous estimation of Paracetamol and Etodolac in tablet formulation. Estimation was carried out by multicomponent mode of analysis at selected wavelength of 256 and 286 nm for Paracetamol (PCM) and Etodolac (ETD) respectively in methanol: water (60:40). The method was validated in terms of linearity, accuracy (% Recovery), Precision (Interday, intraday, and reproducibility) and robustness. Both methods were linear (R2 = 0.997- 0.999 for UV method and 0.998 for RPLC method) and accurate (% recovery was 98.39-101.17%). The method was also obtained precise (% RSD <2 %) and robust. The linearity was obtained in the concentration ranges of 5.25 μg/ml for Paracetamol and 3-16 μg/ml for Etodolac. The method was validated as per international conference of Harmonization (ICH) guidelines.
Keywords: Paracetamol, Etodolac, UV, RP-HPLC, ICH.
Article Info:Received 28 May, 2017; Review Completed 14 July, 2017; Accepted 14 July, 2017; Available online 15 July, 2017
Cite this article as:
Shaikh A, Singh G, Jain NK, Gupta MK, Development and validation of new simple, sensitive and validated UV-spectrophotometric and RP-HPLC method for the simultaneous estimation of Paracetamol and Etodolac in marketed formulation, Journal of Drug Delivery and Therapeutics. 2017; 7(4):120-124
DOI:http://dx.doi.org/10.22270/jddt.v7i4.1476
*Address for Correspondence
Ameen Shaikh, PG Research Scholar, Dept.of Pharmacy, Oriental University, Indore
Email.id: [email protected]
INTRODUCTION
Paracetamol is one of the most popular over the counter drugs. It has analgesic and anti-pyretic properties with weak anti-inflammatory activity and it is used in the symptomatic management of moderate pain and fever. It is available in different dosage froms: tablet, capsules, drops, elixirs, suspensions and suppositories1. The drug is official in Indian, BP, European and US pharmacopoeias2-5.
Paracetamol is chemically N-(N-hydroxyphenyl)
acetamide 6 (fig: 1) is a member of Non-Steroidal Anti-inflammatory Drugs (NSAIDs). Etodolac (ETD) is
Figure 1: Structure of Paracetamol
Figure 2: Structure of Etodolac
A comprehensive literature research reveals the lack of a spectrophotometric analytical method for simultaneous estimation of paracetamol 8-13 and etodolac 14-18 in pharmaceutical formulations. A successful attempt was made to develop accurate, precise and sensitive multi-component mode of analysis for estimation of both the drugs. The develop method is simple, rapid, selective, less expensive and less time consuming. The purpose of
present study was to develop and validate
spectrophotometric analytical methods for simultaneous estimation of paracetamol and etodolac in their combined tablet dosage from.
MATERIALS AND METHODS
Instrument: Instrument used was an UV-Visible double
beam spectrophotometer Systronics-108 with a
bandwidth of 1.5 nm and a pair of 1 cm matched quartz cells. The HPLC system consisted of a YL-9100 pump, a UV-visible detector, a Linhrocart C18 (250 x 4.60 nm), 5µm column, a Lichrocart, HPLC guard Cartridge and YL-Clarity software. All weighing was done on analytical balance (Denver instrument, Germany). A sonicator (Electroquip ultra sonicator, Texas) was used in the study. Calibrated glass wares were used throughout the work.
Chemicals: Chemicals used were methanol (Rankem
Laboratories) and water (Merck Ltd., India). Marketed formulation containing Paracetamol 500 mg and Etodolac 400 mg (ETOGESIC-P) was procured from Burgeon Pharmaceuticals PVT LTD. Puducherry.
METHOD
Determination of λmax of Drugs:-
Standard solution (10g/ml) of pure Paracetamol and Etodolac was prepared. The pure drug solutions were scanned on UV spectrophotometer, which showed maximum absorbance at 256.0 and 286.0 for Paracetamol and Etodolac respectively.
Preparation of Standard Stock Solution:
10 mg of standard PCM and ETD were weighed separately and transferred to 100 ml separate volumetric flasks and dissolved in diluent (methanol: water in proportion of 60:40 (v/v)). The flasks were shaken and volumes were made up to mark with diluent to give a solution containing 100 μg/ml each of PCM and ETD.
Methodology:
The working standard solutions of PCM and ETD were prepared separately in diluent (methanol: water in proportion of 60:40 (v/v)) having concentration of 10 μg/ml. They were scanned in the wavelength range of 200- 400 nm against diluent methanol: water (60:40 v/v) as blank. λmax of both the drugs were 256 nm and 286 nm for Paracetamol and Etodolac respectively. The absorption spectra thus obtained were derivatised from first to fourth order. First order derivative spectrum was selected for the analysis of both the drugs. From the overlain spectra of both the drugs wavelengths selected for quantitation were 224.28 nm (zero cross point for ETD) for PCM and 219.27 nm (zero cross point for PCM) for ETD.
Validation of the Proposed Method:
The proposed method was validated according to the International Conference on Harmonization (ICH) guidelines19.
Linearity (Calibration Curve):
Appropriate aliquots from the standard stock solutions of PCM and ETD were used to prepare two different sets of dilutions: Series A, and B as follows. Series A consisted of different concentration of PCM (5-25 μg/ml). Appropriate aliquot from the stock solution of PCM (100 μg/ml) was pipette out in to a series of 10 ml volumetric flask and diluted with diluent to get final concentration in range of 5-25 μg/ml.
Series B consisted of varying concentrations of ETD (3-16 μg/ml). Appropriate aliquot of the stock solution of ETD (100 μg/ml) was transferred into a series of 10 ml volumetric flask and the volume was adjusted to the mark with diluent to get final concentration in range of 3-16 μg/ml. The calibration curves were constructed by plotting drug concentration versus the absorbance values of first derivative spectrum at 224.28 nm for PCM and 219.27 nm for ETD. The concentration of individual drugs present in the mixture was determined from the calibration curves in quantitation mode.
Precision:
The reproducibility of the proposed method was determined by performing the assay for the same day (intraday assay precision) and on three different days (inter day precision). Precision studies were performed by preparing nine determinations covering the specified range for the procedure (3 x 3 replicates for each concentration). Low % RSD shows that the method has good precision. The results of intraday and inter day precision were expressed in % RSD.
Accuracy:
by applying obtained observation values to the respective regression line. The results of accuracy were expressed in % Recovery.
Limit of Detection and Limit of Quantification:
The LOD and LOQ were separately determined based on the standard calibration curve. The residual standard deviation of y-intercept of regression lines may be used to calculate LOD and LOQ using following equations.
LOD = 3.3 * D/S
LOQ = 10 * D/S
Where, D = Standard deviation of the intercepts of regression line
S = Slope of the calibration curve
Figure 3: Overlain of derivative spectrum (1st order) of PCM and ETD
Table 1: Statistical parameter of the calibration curve
Statistical Parameter PCM ETD
λmax 256nm 286nm
Linearity range 5-25μg/ml 3-16μg/ml
Linearity equation y = 0.0017X-0.0012 y = 0.0033X+0.0043
Slope 0.0017 0.0032
Intercept 0.0011 0.0044
Standard deviation of slope 0.00004 0.000055
Standard deviation of intercept 0.00017 0.00036
Correlation co-efficient 0.9994 0.9983
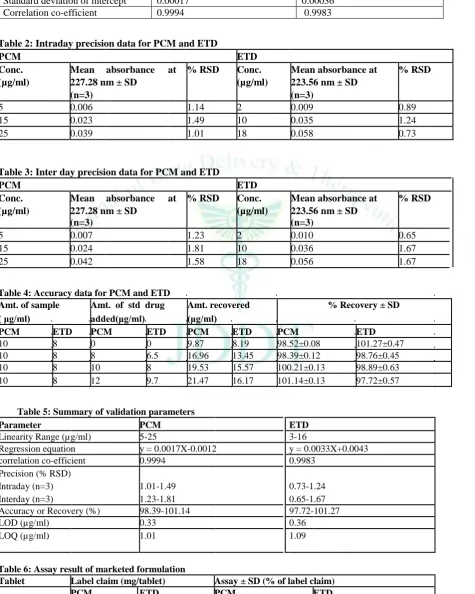
Table 2: Intraday precision data for PCM and ETD
PCM ETD
Conc. Mean absorbance at % RSD Conc. Mean absorbance at % RSD
(µg/ml) 227.28 nm ± SD (µg/ml) 223.56 nm ± SD
(n=3) (n=3)
5 0.006 1.14 2 0.009 0.89
15 0.023 1.49 10 0.035 1.24
25 0.039 1.01 18 0.058 0.73
Table 3: Inter day precision data for PCM and ETD
PCM ETD
Conc. Mean absorbance at % RSD Conc. Mean absorbance at % RSD
(µg/ml) 227.28 nm ± SD (µg/ml) 223.56 nm ± SD
(n=3) (n=3)
5 0.007 1.23 2 0.010 0.65
15 0.024 1.81 10 0.036 1.67
25 0.042 1.58 18 0.056 1.67
Table 4: Accuracy data for PCM and ETD
Amt. of sample Amt. of std drug Amt. recovered % Recovery ± SD
( μg/ml) added(μg/ml) (μg/ml)
PCM ETD PCM ETD PCM ETD PCM ETD
10 8 0 0 9.87 8.19 98.52±0.08 101.27±0.47
10 8 8 6.5 16.96 13.45 98.39±0.12 98.76±0.45
10 8 10 8 19.53 15.57 100.21±0.13 98.89±0.63
10 8 12 9.7 21.47 16.17 101.14±0.13 97.72±0.57
Table 5: Summary of validation parameters
Parameter PCM ETD
Linearity Range (µg/ml) 5-25 3-16
Regression equation y = 0.0017X-0.0012 y = 0.0033X+0.0043
correlation co-efficient 0.9994 0.9983
Precision (% RSD)
Intraday (n=3) 1.01-1.49 0.73-1.24
Interday (n=3) 1.23-1.81 0.65-1.67
Accuracy or Recovery (%) 98.39-101.14 97.72-101.27
LOD (µg/ml) 0.33 0.36
LOQ (µg/ml) 1.01 1.09
Table 6: Assay result of marketed formulation
Tablet Label claim (mg/tablet) Assay ± SD (% of label claim)
PCM ETD PCM ETD
The calibration curves were constructed by plotting drug concentration versus the absorbance values of first derivative spectrum at 227.28nm for PCM and 223.56 nm for ETD. Standard calibration curves for PCM and ETD were linear with Correlation coefficients (r2) values in the range of 0.9994 and 0.9983 respectively at the selected wavelengths and the values were average of five readings. The Statistical parameter of the calibration curve was shown in table 1.
LOD and LOQ were found to be 0.33 µg/ml and 1.01 µg/ml for PCM and 0.36μg/ml and 1.09 μg/ml for ETD. Precision study showed co-efficient of variance (% CV) values less than 2 % for both PCM and ETD respectively. Result for the intra-day and inter-day precision was shown in table 2 and 3.
RESULT AND DISCUSSION
The accuracy of the method was confirmed by recovery studies from tablet at three different levels of 80 %, 100
%, 120 % recovery in the range of 98.39 % – 101.27 % justifies the accuracy of method. The results obtained from the recoveries of both drugs shown in table 4. The overall summary of all validation parameter was shown in table 5 which was carried out as per ICH guidelines. The results of marketed pharmaceutical dosage forms analysis of the combinations are shown in table 6 which showed good agreement with the labeled claim. There was no interference was observed from the presence of excipients in the amounts, which are commonly present in tablet dosage forms. From all the present work we can conclude that the proposed UV spectrometric method for quantitative determination of PCM and ETD in combined dosage form was found to be simple, rapid, precise, accurate and sensitive. The excipients of the commercial sample analyzed did not interfere in the analysis, which proved the specificity of the method for these formulations. The developed method was found to be more reproducible and sensitive.
REFERENCES:
1. Sweetman S.C. Martindale: The Complete Drug Reference; (2002). (Electronic version The Pharmaceutical Press; Great Britain.
2. Indian Pharmacopoeia, 6th edition, published by The Indian Pharmacopoeia Commission, Ghaziabad, 2010, Volume-II, III, 1318,1321,1859,1861.
3. British Pharmacopoeia Published by British Pharmacopoeia Commission, London, 2010, Volume I, II, III, 847, 2677, 2967.
4. European Pharmacopoeia, 7th edition, published by the directorate for the quality of medicine and healthcare of European council, Volume II, 1981-1982,2667.
5. United State Pharmacopoeia, 34th edition NF 29, published by United State Pharmacopoeial Convention, Rockville, 2011, Volume-II, III, 2784,2786,1720,1723.
6. Klaus Florey, Analytical Profile of Drug Substances, published by Elsevier Science (USA), 3, 1-110.
7. Brittain Harry G., Analytical Profile of Drug Substances and Excipients, published by Elsevier Science (USA), Volume 29, 105-148.
8. Buddha R.S., Pradhananga R.R., Spectrophotometric Method for the Determination of Paracetamol, J. Nepal Chem. Soc., 2009, 24.
9. Roy J., Saha P., Sultana S., Kenyon A. S., Rapid screening of marketed paracetamol tablets: use of thinlayer chromatography and a semi quantitative spot test, Bulletin of the World Health Organization, 1997, 75 (1), 19-22.
10. Kirtawade R., Salve P., Seervi C., Kulkarni A., Dhabale P., Simultaneous UV Spectrophotometric Method for Estimation of Paracetamol and Nimesulide in Tablet Dosage Form, International Journal of ChemTech Research, 2010, 2(2), 818-821.
11. Saravanan V., Revathi R., Meera N. Method development and validation for the simultaneous estimation of lycopene and ubidecarenone by RP-HPLC in combined pharmaceutical dosage form. Journal Of Drug Delivery And Therapeutics, 2016; 6(5): 46-51. doi:10.22270/jddt.v6i5.1295.
12. Patel H.M, Suhagia B.N., Shah S.A, Marolia B.P., Bodiwala K.B., Prajapati P.B., Simultaneous Estimation of Etoricoxib
and Paracetamol in the Synthetic Mixtures and Pharmaceutical Dosage Forms by Derivative Spectrophotometry, Journal of Pharmacy Research, 2010, 3(8),1967-1970
13. Bhowmick M, Bhowmick P, Sengodan T, Thangavel S, Development and validation of bioanalytical RP HPLC method for the estimation of metoprolol tartrate in rabbit plasma after transdermal and oral administration: application in pharmacokinetic studies, Journal of Drug Delivery and Therapeutics. 2015; 5(4):43-53. Doi: 10.22270/jddt.v5i4.1118 14. Bhandari A., Solanki R., Nagori B. P, Nawal M., Bhandari M.,
UV Spectrophotometric determination of Etodolac in tablet dosage form, Journal of Pharmacy Research, 2011, 4(10), 3309-3311.
15. Ola A.S., Aida A.E., Hassan Y.A., Amr M., Rashed M.S., Development and Validation of Stability- Indicating High Performance Liquid Chromatographic (HPLC) and DD1-Spectrophotometric Assays for Etodolac in Bulk Form and in Pharmaceutical Dosage Form, Journal of Liquid Chromatography & Related Technologies, 2009, 32, 2584-2599.
16. Thankappan S., Parmar A., Sailor B., Vekariya K., Khasia V., Development and Validation of Spectroscopic method for Simultaneous Estimation of Etodolac and Thiocolchicoside in tablet formulation, Journal of Pharmacy Research, 2012, 5(6), 3004-3007.
17. Dhiware A.D., Gandhi S.V., Deshpande P.B., Bhavnani V.S., A simple and sensitive RP-HPLC method for simultaneous estimation of etodolac and thiocolchicoside in combined tablet dosage form, International journal of pharmacy and pharmaceutical sciences, 2012, 4 (4), 214-216.
18. Kulkarni V.G., Gandhi S.V., Deshpande P.B., Divekar P., High Performance Thin Layer Chromatographic Analysis of Paracetamol and Etodolac in Combined Tablet Dosage Form, Journal of Chemical and Pharmaceutical Research, 2012, 4(3), 1750-1755.