United Kingdom Vol. VI, Issue 3, March 2018
Licensed under Creative Common Page 145
http://ijecm.co.uk/
ISSN 2348 0386
THE EFFECT OF IMPORT QUANTITY PROCUREMENT PRICE
AND INTAKE FROM PUBLIC DISTRIBUTION ON IMPORT
PRICES OF RICE FOR FOOD SECURITY AND POVERTY
ALLEVIATION IN GUINEA ECONOMIC DEVELOPMENT
Diallo Mamadou Saliou Kokouma
College of Economic and Management, Anhui Agricultural University, Hefei, China
Luan Jingdong
College of Economic and Management, Anhui Agricultural University, Hefei, China
Diallo Mamdou Safaiou Diallo
College of Economic and Management, G.Lansana Conte University, Conakry, Guinea
Diallo Hawao
College of Hydrology and Water Resources, Hohai University, Nanjing, China
Abstract
World food crises over the past two centuries have triggered a standard debate each time: how
much can the market be relied on to provide food security and how much should the
government intervene on behalf of this objective? Rather asked how to deal with hunger and
starvation, the question may be how to escape their threat altogether. Then, when evaluating
the influence of changes in food prices on poverty, it is essential to consider food producers
(who can benefit from higher prices) and consumers (who lose for when the price increases),
with an effort on lowly consumers and producers. In the case of rice in Guinea, however, the
influence of a price change is not complex, because much of the rice consumed is imported,
while locally produced rice is used mainly for self-consumption. An increase in the price of rice
Licensed under Creative Common Page 146
this increase), while a reduction in price will reduce poverty. As well, since rice is an important
part of food consumption, a change in its price is probable to have a large influence on the
poverty.
Keywords: Import Quantity, Procurement Price, Public Distribution Import Prices of rice, Food
Security, Poverty Alleviation, Economic Development, Guinea
INTRODUCTION
Such as famine and food security are opposite ends of the spectrum. The author (Fogel, 1991),
reports that; It is only in modern times that all multinationalistes opposed to rewarded defenders
of these cartels, were able to escape chronic hunger and its constant threat. The success in
stopping the escape in many a country in the developing world, particularly in Africa and South
Asia, is still weak. In these countries, the judgment of the factors encouraging hunger and
vulnerability to famine, and the tools available to mitigate their impact, remain important
intellectual challenges (Sen, 1981; Ravallion, 1987, 1998, Dreze and Sen, 1989). As defined by
the FAO, the goal of food security is to assure to all human beings, at all times, physical and
economic access to adequate food. At the national level, food security is therefore a situation
whereby a country is able to cover the food requirements of its population on a continuous and
stable basis.
These requirements can be achieved by the combination of factors that are different
between the combination of domestic production through access to food or beyond domestic
production, and a combination of both. Rare, if any, countries that are able to meet their food
needs through domestic production simply, therefore; the most appropriate model is an open
economy that derives from the world market to meet the caloric needs of the population. As a
result, a country's level of rice import for food security is dependent upon a complex interaction
of domestic and global forces, and any assessment of food security at the national level must
take this into account. Food price fluctuations, which will be exacerbated by price change, make
Guinean food security even more tenuous. Despite; major developed countries' efforts to
improve the capacity to feed every right person. In addition, food security, can only be the ability
of all people to have adequate food to lead an active and healthy life, but alas the world food
crisis of 2009 continues to plague its damage on many areas; this challenge of lack of tangible
results for all depends on many reasons which are among other major issues of poverty,
Licensed under Creative Common Page 147 among others. In 2008, the Global Hunger Index found that West Africa is a region with some of
the most severe hunger in the world.
Agricultural mechanization very advanced, to contribute positively increase food
production in many parts of the world during the 21th century, due to the presence of improved
seeds, chemical fertilizers and pesticides have greatly improved productivity workers and crop
yields. This highly advanced industrialization system of production, combined with deeply
integrated shipping and transport networks, grain storage and conservation systems have
helped keep global food prices stable or declining since 1950, despite a massive increase in the
world population. Wherever Technological change has not reached most West African region
farmers, In that region, farms are small, primarily cultivated with hand tools, planted with seeds
with low yield potential, and use little or no chemical fertilizer. Consequently, most small farms
are only able to attain yields which are less than one-seventh (∼14%) of those regularly
achieved in industrialized systems (Taylor J et al. 2002 & Breman. H2003). In most of the region, purchasing food takes up 50% or more of most households’ income Jayne T.S et al.
(1995). As global demand for food doubles by 2050, the regions that are already food-insecure
today are likely to be put under further pressure as the price of food rises.
Food insecurity is otherwise alluding to the number of people in need and at the same
time a victim of this scourge, the total number exceeds a starving by mid-2009 (FAO, 2009)
billion. Each food crisis is a renewed activity to governments and donors to consider solutions
with respect to the increase in food production and glimpse how best security for poorer
populations. In the same vein, market forces (Supply-Demand) also respond, stifling demand
(as evidenced by a billion-people suffering from hunger) and leading investments in the high
agricultural technologies that play a relentless great for lower prices grasses base over the long
term.
Since 1900, the inflation adjusted price of rice has declined 1.37% per year, corn by
1.25% per year, and wheat by 1.05% per year. Wherever, higher food prices in West Africa will
affect not only urban populations, but also farmers, the majority of whom are net grain
purchasers.
The problem of food security remains a major concern for developing countries
especially sub-Saharan countries such as Guinea, and soaring food prices are likely to have a
negative impact on the poor (on the impact of the recent food price crisis, see eg Ivanic and
Martin, 2007, International Monetary Fund, 2008, Wodon and Zaman, 2008 and the World
Bank, 2008a and 2008b).
Licensed under Creative Common Page 148 safety nets and nutrition remains a key priority for the country. In part because rice production
has fallen substantially during the period of neighbor States (Sierra Leone, Liberia and Ivory
Cost) conflict, a large majority of the population today is a net buyer of food, with much of food
consumption coming from rice imports. There have been numerous accounts in the press over
the years related to the price of rice in the country, including on issues regarding the awarding
of import licenses for rice. The issues related to rice are not new in Guinea.
This paper explores the relationship of rice imports (price of rice) for assessing food
security at the national level in an effort to better understand how food imports reacts to and is
affected by the integration of domestic and global markets. To achieve this objective, a
conceptual model is first presented to provide a stylized framework for the supply, demand,
excess demand, procurement price, government stocks and intake from public distribution
system and market-based factors that affect the domestic food economy. From this point, an
empirical model will be presented in order to provide a more quantitative means of assessing
food security, and in particular to pinpoint specific variables that explain price of rice at the
national level. Both of these models will then be used to analyze the domestic food economy
and the price of rice situation in Guinea.
Since the 80s, the vacillation of prices on food specifically rice led to a strong blow on
some states. But all signs point to the future rice imports are likely to continue to increase even
more, with possible variations in commodity prices; rice consumers as also a major impact on
the poor.
West Africa and Food Prices
Rosegrant M.W et al (2001) argue that, West Africa is a semi-arid region with a rapidly growing
population and a very low gross domestic product. In contrast to South and East Asia, which
have seen a reduction in the number of food-insecure people in recent years, the number of
poor and food-insecure people in Africa is still rising and is likely to continue to rise because of
the lack of economic and agricultural growth that can feed the increasing population. A significant portion of the world’s extreme poor, who live on less than $0.50/day, reside in the
region. Many farming families have diversified their income sources, working in rural markets,
livestock production, crafts, and wage labor markets Abdulai, A. et al (2001). Although this has
increased cash income and to some extent has also improved the standard of living, it has also
driven most farmers in the region to be net purchasers of food from the market Bryyceson et al
(2002). In fact, despite its agricultural orientation, the entire West African region is a net food
buyer, importing even local food staples such as millet and corn FAO (2008). West African
Licensed under Creative Common Page 149 Price of local food products are examined by a difference of factors, including social unrest, the
macroeconomic policies of the Government, food and assistance often came from multiple
sources, the regional price variations in agricultural production, and demand and other market
factors. However, when weather reduces agricultural production over large areas, the resulting
widespread reductions in supply cause significant increases in local food prices Brown M.E et al
(2006). In addition to annual variation, prices of food staples also exhibit a distinct seasonal
pattern. The two main reasons for this are a lack of storage capacity and the limited access of
rural producers to export hannels. An inability to store forces farmers to sell most of their surplus
in the months after harvest (September-December), and to purchase imported grain during the “hungry season” (June-August) when their own stocks are depleted. Access to international
markets is a partial substitute for stockpiling, as food can be imported and exported in the same
way that stocks can be drawndown or built-up. But because of costly export procedures and low
total volumes potentially available for export, the sale of food on the world market is not an
option for farmers. (Storage and integration with other markets is the reason prices for basic
storable foods such as rice, wheat, cassava, beans, etc., show relatively little intra-annual
variation in developed countries.) The simultaneous influx of grain on local markets reduces the
prices that farmers receive at harvest, whereas the scarcity of food during summer translates to
high prices. Thus, preharvest grain prices are significantly greater than post-harvest prices.
Because Terpend, N. (2006) explain that, most poor and food insecure farmers in the region do
not invest in the agricultural technology needed to boost overall yields, production remains only
at subsistence levels. Many small farmers produce little more than they consume throughout the
year, and many are net buyers of the crops that they produce. Farmers in Burkina Faso, for
example, sell only 10-20%of the cereals produced, mainly after harvest, consuming the rest
within the household or exchanging them with other needy households for goods and services,
then purchasing food on the market if they run out of stocks. For the purpose of welfare analysis
related to food prices, it is important to distinguish sellers and buyers. In all markets, sellers
benefit from a price increase (all else equal), whereas buyers lose, and vice versa. In the
context of subsistence level farming households in West Africa without access to storage, the
differentiation into net sellers and net buyers is a little more complicated. On one hand are
consumers who buy all of their food on the market and producers who produce much more than
they consume and are able to sell grain year-round (provided they have storage facilities). The
former are clearly net buyers, whereas the latter are net sellers. However, most rural
households produce some grain, sell part of it, but then buy the same type of grain on the
Licensed under Creative Common Page 150
Rice production and consumption in Guinea: A brief review
Guinea’s agriculture can have three different production systems. First, there are large
plantations which focus on export crops (fruits, groundnut oil palm oil, coffee and cocoa).
Agricultural production in Guinea follows plantations that are most private property, but
also a number of smaller plantations owned operated by the Guinean Palm Products Corporation and peanut oil and Lebanese Coffee Corporation. A second component of Giunea’s
agriculture sector consists of privately owned commercial farms of medium size which also
focus on industrial crops for export and to a lesser extent on livestock for the local market.
Finally, the bulk of the population engaged in agriculture belongs to small household farms
which rely on traditional production techniques that generated low yields due among others to a
lack of inputs, and thereby focus on subsistence production.
In terms of consumption, rice is the main staple food, followed by cassava and other
food crops. But the inability of the country to produce enough rice and other cereals to feed the
population has led to massive imports and has been one of the many factors that have led to
high levels of food insecurity. The FAO typically describes food insecurity as a situation under
which some people lack access to enough food of good quality to meet their nutrition needs in
order to be able to lead an active and healthy life.
Relationship between local and global Markets
Rapidly expanding urban markets in Guinea rely on global commodities for affordable food.
Efficient global commodity markets have made rice imported from China, Malaysia, and
Indonesia extremely competitive with cassava, corn, millet, and sorghum grown locally, but this
is only the case for urban markets. Because there is a high cost to move grain from the interior
of the country to the urban cities and ports on the coast, local rice prices in rural areas tend to
be sensitive to climate variability.
When rural markets have a deficit and prices are high, grain is imported from the capital
city and thus local prices are affected by global fluctuations. In this sense rural markets are
integrated symmetrically into world markets: grain flows in from abroad when prices are high,
but not the other way around. This makes the world price (plus transportation costs) a
determinant for peak prices during the hungry season, but not for prices after harvest (unless
harvest is unusually low). As evidence for such an asymmetric integration note the fact that
Guinea only import but do not export grain, and the pronounced intra-annual variation of local
prices. Integration into world markets benefits net buyers as it lowers peak prices, while
decreasing the profits of net sellers. Because there are many more net buyers than net sellers,
Licensed under Creative Common Page 151 Guinea). Yet at the same time, the dependence of local prices on world prices makes local rice
prices vulnerable to shocks from the world markets. For example, the increase in global
economic and financial crisis in 2008 had a strong influence on the price of rice grain in the
rural, informal commodity markets in Guinea, despite their relative isolation. Wherever Wodon,
Q. et al (2008) argue that, the period of high global price had the immediate consequence of
sharply increasing the number of hungry people while boosting the income of only a few
relatively well-off farmers.
The government has been an active partner in the management of the country's food
economy. Government intervention in the foodgrain market can be viewed broadly from four
angles. First, there is a system of public procurement of foodgrain and support prices. Secondly,
the state manages food stocks for distribution and buffer stock operations. Thirdly, there is a
state guided system of delivery of cheap food through network of fair price shops (FPS) known
as public distribution system. Fourthly, government intervenes in trade both internal and
external viz., legal controls on hoarding and other aspects of internal trade and restrictions on
external trade. Let us examine the objectives and nature of government intervention in Guinea's
foodgrain sector.
In a situation of food shortages foodgrain prices rise. Since the purchasing power differs
across natural regions, there is every possibility of the grain moving from surplus to deficit
producing regions. High prices may prevail throughout the country, if private trade movements
are not regulated. This would result in distress to the vulnerable sections of population. Public
distribution of food grains to these vulnerable sections would assume prominence because
during the periods of scarcity, one is not sure that market mechanism and private trade would
function effectively in distributing the available supplies equally across the regions without excessive rise in prices. Thus, it is recognised that “poverty considerations” compelled Guinea
to sustain publicly sponsored foodgrain procurement, storage and distribution.
Trends in Rice Prices
Foodgrain prices in general and rice prices in particular have been increasing at a rate higher
than production. They exhibited a staircase type of movement remaining steady when
production is rising and increasing when production shortfalls occur. This is mainly because
"during years of good harvest the surpluses have gone into stock building and not been used for
bringing down prices in accordance with normal market functioning" (Krishnaji, 1988). This is
evident from the coefficient of variation of per capita production and availability of rice and
cereals. This demonstrates that the stocks have not been used in stabilising the fluctuations in
Licensed under Creative Common Page 152 market price goes up to enable the farmer to receive the weighted price for his total sales which
is not less than what he would have received in the absence of procurement.
Not only the open market prices, but also the procurement and issue prices exhibited
similar patterns. Movements in procurement prices exhibited a downward rigidity in the sense
that they have been either kept stable or revised upwards irrespective of production levels.
Since the procurement price has been an assured support price, market price movements
closely followed those of the former.
METHODOLOGY
Specification and Estimation of the Model
The price equation for agricultural commodities is determined as a reduced form of complete
commodity model where demand is specified as a declining function of price and supply is an
increasing function and a reduced form price equation is derived using the market clearing
mechanism. In the framework of excess demand, prices are functions of excess demand via,
demand-supply gap and equilibrium prices are attained when demand is equal to supply. In our
model of domestic price formulation, in addition to demand and supply equations, price equation
is explicitly specified in a dual market framework due to the interaction of the operations of the
government and the functioning of the open market.
The model used to analyses the domestic rice price movements takes into account (1) demand
equation for rice (2) the actual quantity of rice supplied to the open market (3) Price equation for
rice (4) Procurement equation for rice (5) intake from public distribution system for rice (6)
Change in private stocks for rice (7) Change in government stocks for rice.
Demand Equation:
On the demand side, economic theory suggests that demand for any commodity is a function of
income, price of the commodity, and prices of the other related commodities. We specified an
aggregate demand function, in which demand for rice is made to depend on real disposable
income, relative rice price, and relative price of cassava. The demand function for rice,
therefore, can be written as:
rt t
t a a Y a P
D 1 2 3 ………… (1); a
2>0;a3<0
Where, Dt = Per capita quantity of rice demanded in the open market
Yt = Per capita disposable income in current prices
Prt = wholesale rice price index
t =time
Licensed under Creative Common Page 153
Supply Equation:
Production is assumed to be exogenous. Quantity of rice actually supplied to the open market in period’t’ is the actual quantity of rice available in the open market in period’t’. Actual quantity of
rice available to the open market is:
IP
I
Q
Q
S
t
t
pt
t
…(2) and IP IPtIPt1St = Actual quantity of rice supplied to the open market in per capita
Qt = Per capita net rice production
Qpt = per capita quantum of rice procurement
It = per capita net rice imports
IPt= Closing stocks with the private traders in per capita
IPt-1=Opening stocks with the private traders in per capita
t =time
Net production 'Qt ' is obtained after deducting and wastage a proportion of net production is
taken away by the government for public distribution through compulsory procurement. Some
percentage of it would meet the domestic demand and some percentage as speculative stocks
of the traders. The actual quantity available to the open market in period t is thus equal to the
left-out part of the current production plus stocks with the private traders.
Price equation:
Our hypothesis here is that government procurement prices set floor to the open market price
and any positive deviations from this floor can be attributed to excess demand pressures in the
economy.
gt t
rt
X
P
P
1
2
3…………(3)
The above hypothesis in terms of the model is:
t gt gt rt X P P P 2 1
S
D1
D1
D
D
S
P
r
i
c
e
Licensed under Creative Common Page 154 if Xt<0
=0 if Xt > 0
Xt=(St-Dt)………… (4)
if St-Dt=0, Prt = Pgt
Hence β3=1
Where,
Prt = price of rice in the open market
Xt= excess demand
Pgt = Procurement price of rice
t = time
βl, β2 and β3 are parameters;
Procurement Equation:
Quantum of procurement depends on the availability, prices and administrative regulations
imposed by the government. Availability related to the marketable surplus with the farmers, a
close proxy to which can be the level of output. Higher the output higher is likely to be the
volume of procurement and vice versa. Since traders have to contribute some proportion of their
output both to the central pool as well as to the state, government is the deciding authority to set
procurement target which is generally based on the expected output. Government accepts grain
from, the traders over and above this target and it depends on the trader’s choice whether to
sell to the government which intern based on the procurement price relative to the open market
price of rice. This ratio is likely to capture the 'substitution effect on volume of procurement.
rt gt
t
pt
Q
P
P
Q
1
2
3
4 …………(5)
2>0,
3>0,
4<0Where,
Qpt = Quantum of procurement
t = time
1
,
2,
3, and
4are parametersStock Equation:
This equation is private demand for speculative stocks. It is presumed that such speculative
private demand is dampened by stocks of rice with the government.
IG
IP
Licensed under Creative Common Page 155 Where,
IG
is change in stocks with the government
<0 because whenever the stocks withthe government increase, the stocks with the private traders decrease with the expectation that
prices are going to fall in future. This is valid only when there is excess demand or inflationary
situation and may not be valid when there is excess supply and farmers are not willing to supply
at low prices.
Government Stocks:
The government replenishes or depletes its stocks in order to provide stability to market prices.
Change in government stocks is equal to quantum of procurement minus sales from public
distribution minus net imports.
t t
pt PDS I
Q
IG
…………(7)
Intake from Public Distribution System (PDS):
As discussed earlier, in order to protect the poor who, suffer the most due to price rise
government distributes foodgrains a fixed quota per consumer at concessional prices through
the fair price shops. How much government can sell through fair price shops depends on the
difference between the issue price public distribution sales and the open market price. Higher
the issue price in relation to open market price higher would be the intake. From PDS is made to
depend on disposable income, issue price and open market price.
t gt st
t P P Y
PDS
1
2
3
4…………(8)
Where, PDS, and Pst, are quantum of intake from public distribution system and issue price of
rice respectively.
2
<0,
3>0,
4>0Substituting equations (l), (2), (4), (5), (6), (7) and (8) in equation (3) we obtain a reduced form
price equation as:
t t st gt
t
rt Q P P I Y
P
1
2
3
4
5
6
2<0,
3>0,
4>0,
5>0,
6>0As shown below by Faostat database (2008), are data for per capita Guinean net rice imports(I),
imports value (Pr), Per capita net rice production (Q) and Per capita disposable income(Y),
procurement price of rice(Pg) and Intake from public distribution system (Ps) in current prices on
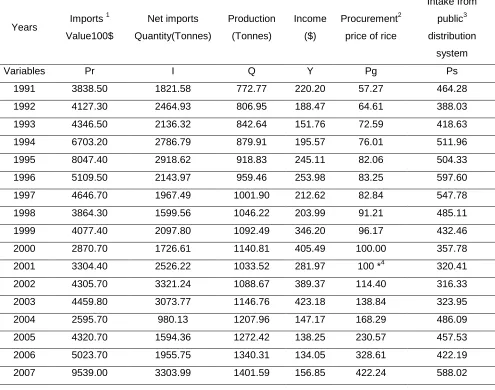
Licensed under Creative Common Page 156 Table 1: Imports value of rice and factors from 1991 – 2007
Years Imports
1
Value100$
Net imports Quantity(Tonnes)
Production (Tonnes)
Income ($)
Procurement2 price of rice
Intake from public3 distribution
system
Variables Pr I Q Y Pg Ps
1991 3838.50 1821.58 772.77 220.20 57.27 464.28 1992 4127.30 2464.93 806.95 188.47 64.61 388.03 1993 4346.50 2136.32 842.64 151.76 72.59 418.63 1994 6703.20 2786.79 879.91 195.57 76.01 511.96 1995 8047.40 2918.62 918.83 245.11 82.06 504.33 1996 5109.50 2143.97 959.46 253.98 83.25 597.60 1997 4646.70 1967.49 1001.90 212.62 82.84 547.78 1998 3864.30 1599.56 1046.22 203.99 91.21 485.11 1999 4077.40 2097.80 1092.49 346.20 96.17 432.46 2000 2870.70 1726.61 1140.81 405.49 100.00 357.78 2001 3304.40 2526.22 1033.52 281.97 100 *4 320.41 2002 4305.70 3321.24 1088.67 389.37 114.40 316.33 2003 4459.80 3073.77 1146.76 423.18 138.84 323.95 2004 2595.70 980.13 1207.96 147.17 168.29 486.09 2005 4320.70 1594.36 1272.42 138.25 230.57 457.53 2006 5023.70 1955.75 1340.31 134.05 328.61 422.19 2007 9539.00 3303.99 1401.59 156.85 422.24 588.02
1
The data for Import value, Net imports quantity, Net rice Production, producer price which is Income of the farmers are sourced from FAO Estimated data using trading partners database www.faostat.fao.org.
2
The data for Procurement price (consumer prices) and intake from public distribution (Retail price of rice) is source from International Labor Organization Geneva Laborsta Labor statistics database: www.laborsta.ilo.org copyright International Labor organization 1998-2010 selection years: 1991-2007.
3
The Intake from public distribution system value data (Retail price of rice) for 1991 was used for 1992 to1995 and the 1997 Intake from public distribution system value was used for 1998 and 1999 because there was no available data for 1992 to 1995 and 1998 to 1999. And with the official exchange rate we convert all the values on USD/Tonne. Exchange rate sourced: 1961-2000: IMF, 2005.International financial statistics: database and browser May 2005.Washington DC USA. 2001- 2008: CIA Fact book
4
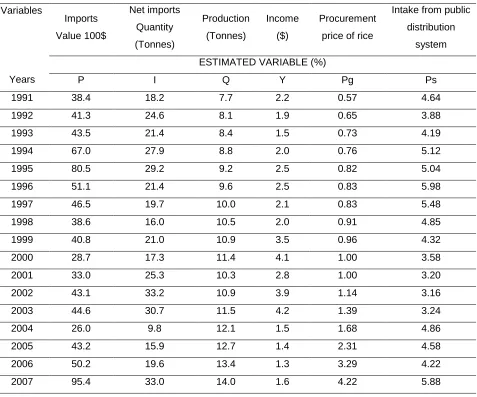
Licensed under Creative Common Page 157 Table 2: Estimated variables on percent (%)
Variables
Years
Imports Value 100$
Net imports Quantity (Tonnes)
Production (Tonnes)
Income ($)
Procurement price of rice
Intake from public distribution
system ESTIMATED VARIABLE (%)
P I Q Y Pg Ps
1991 38.4 18.2 7.7 2.2 0.57 4.64
1992 41.3 24.6 8.1 1.9 0.65 3.88
1993 43.5 21.4 8.4 1.5 0.73 4.19
1994 67.0 27.9 8.8 2.0 0.76 5.12
1995 80.5 29.2 9.2 2.5 0.82 5.04
1996 51.1 21.4 9.6 2.5 0.83 5.98
1997 46.5 19.7 10.0 2.1 0.83 5.48
1998 38.6 16.0 10.5 2.0 0.91 4.85
1999 40.8 21.0 10.9 3.5 0.96 4.32
2000 28.7 17.3 11.4 4.1 1.00 3.58
2001 33.0 25.3 10.3 2.8 1.00 3.20
2002 43.1 33.2 10.9 3.9 1.14 3.16
2003 44.6 30.7 11.5 4.2 1.39 3.24
2004 26.0 9.8 12.1 1.5 1.68 4.86
2005 43.2 15.9 12.7 1.4 2.31 4.58
2006 50.2 19.6 13.4 1.3 3.29 4.22
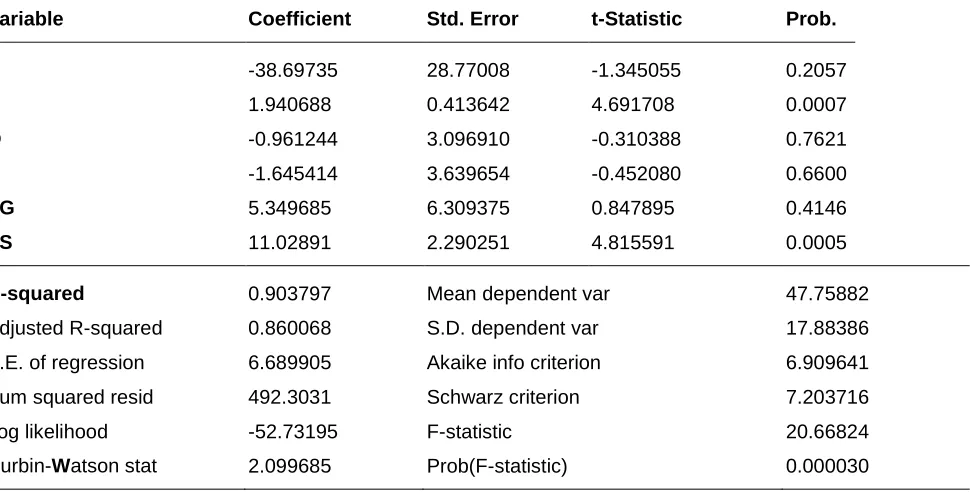
Licensed under Creative Common Page 158 Table 3: Estimates of reduced form rice price Equation
Dependent Variable: P Method: Least Squares
Date: 07/08/2014 Time: 19:54 Sample: 1 17
Included observations: 17
Variable Coefficient Std. Error t-Statistic Prob.
C -38.69735 28.77008 -1.345055 0.2057
I 1.940688 0.413642 4.691708 0.0007
Q -0.961244 3.096910 -0.310388 0.7621
Y -1.645414 3.639654 -0.452080 0.6600
PG 5.349685 6.309375 0.847895 0.4146
PS 11.02891 2.290251 4.815591 0.0005
R-squared 0.903797 Mean dependent var 47.75882
Adjusted R-squared 0.860068 S.D. dependent var 17.88386 S.E. of regression 6.689905 Akaike info criterion 6.909641 Sum squared resid 492.3031 Schwarz criterion 7.203716
Log likelihood -52.73195 F-statistic 20.66824
Durbin-Watson stat 2.099685 Prob(F-statistic) 0.000030
RESULTS AND CONCLUSION
Estimation is carried out for the period 1991 to 2007 using ordinary least squares estimation; the
data are obtained from FAO web site www.faostat.fao.org, International Labour Organization
Geneva Laborsta Labor statistics database www.laborsta.ilo.org and International financial
statistics.
From the regression analysis results, the coefficient of determination R2 shows that the
explanatory variables per capita Guinean Net rice imports (I), Per capita net rice production (Q),
Per capita disposable income(Y), Procurement price of rice (Pg) and Intake from public
distribution system (Ps), explained 90.4 % of the total variables in P which is Import Price The
implication is that the variables in the equation are useful for explaining the Import price
between 1991 to 2007 in Guinea. R2 value of 0,904 indicates a good fit for the model. The F-
statistic value is found to be 20.67. Thus, the F- statistic is significant at the 5% level. The
Durbin Watson (D.W) statistic of 2.0997 indicates that there is no problem of serial correlation in
the regression model. The Constant C value of -38.697 implies that if all the explanatory
Licensed under Creative Common Page 159 38. 697.The Import Price of rice is positively related to Net rice imports (I). This implies that at
higher quantity rice imports (I), import price will increase by 1.940688.
The Net rice production (Q) value – 0.961244, implies that if all the explanatory variables
are held constant the dependent variable P which is the Import price will decrease by 0. 961244.
Per capita disposable income(Y), value -1.645414, implies that if all the explanatory variables
are held constant the dependent variable P which is the Import price will decrease by 1.645414.
The Import Price of rice is positively related both to the Procurement price (Pg) and Intake from
public distribution system (Ps). This implies that at higher Procurement price and intake from
public distribution system, Import price will increase respectively by 5.349685 and 11.
02891.Results on import price of rice equation demonstrate that except Net rice production (Q)
and disposable income(Y), all other coefficients are found to be significant and have the
expected signs. Furthermore, import price are found to have significant impact on the quantity of
rice import though the elasticity turned up, that might be because Guinea is one of a vulnerable
country in West Africa, where the production, harvest and yield are low fertilizer (N, P, K) use is
limited. Finally, the above interpretation shows that, in Guinea, rice is the main food of
consumption, that mean rice imports became very important and the solution for effective food
security and poverty alleviation on the perfect economic development.
RECOMMENDATIONS ON FUTURE RESEARCH
Based on the conclusions above, this study suggests further research structured around the
following areas: Further research is needed to help formulate appropriate policies to ensure
sustainable urban food security and to build resilience against future shocks. In particular, more
knowledge is needed about the nature of employment and labor markets in urban areas of
developing countries, so that policies can help foster economic security. Comprehensive and
systematic studies are needed on the value of urban agriculture, and so far, knowledge is
limited on how to scale up successes in this field. In addition, rural-urban links remain poorly
understood; in particular, additional studies are needed on how the food price crisis affected
migration patterns between towns and the countryside, and what the impacts of the current
recession are on those same patterns. Finally, further studies are needed on when higher urban
food prices are likely to spark a violent reaction, and who is likely to participate in protests and
violence. Such studies would help policymakers understand how best to design policies and
Licensed under Creative Common Page 160
REFERENCES
Abdulai, A.; CroleRees, A. Determinants of income diversification amongst rural households in southern Mali. 2001, Breman, H. West Africa’s Subsistence Farming; Food and Agriculture Organization: Rome, 2003.
Brown, M. E.; Pinzon, J. E.; Prince, S. D. The sensitivity of millet prices to vegetation dynamics in the informal markets of Mali, Burkina Faso and Niger. Clim. Change 2006,
Bryceson, D. F. The scramble in Africa: Reorienting rural livelihoods. World Dev. 2002, 30, 725–739.
D.S. Kokouma, L. JingDong, D. Hawaou, Anhui Agricultural University, Hefei, China.Vol. V, Issue 5, May 2017, “Analysis of Impact a Change in the Price of Rice on Poverty Line in Urban and Rural Areas of Guinea Conakry “International Journal of Economics, Commerce and Management. Rochester, U.K/ http://ijecm.co.uk/
Diallo. M.S.Kokuma, Luan Jingdong and Diallo Hawaou May 2017 “Analysis of Impact a Change in the Price of Rice on Poverty in Urban and Rural Areas of Guinea, International Journal of Economics, Commerce and Management, United Kingdom, Vol.V, Issue 5, Page 171, http://ijecm.co.uk/
Dreze, J., Sen, A., 1989. Hunger and Public Action. Clarendon Press, Oxford.
Eicher, C.K., Staatz, J.M. (Eds.), 1998. International Agricultural Development, 3rd ed. Johns Hopkins University Press, Baltimore, MD.
Exchange rate sourced: 1961-2000: IMF, 2005.International financial statistics: database and browser May 2005. Washington DC USA. 20001 2008: CIA Fact book
FAO statistic database 2010 http://faostat.fao.org/site/339/default.aspx.
FAO. FAO Statistical Database; Food and Agricultural Organization of the United Nations (FAO): Rome, 2008; Vol. 2008.
FAO. FAO Statistical Database; Food and Agricultural Organization of the United Nations (FAO): Rome, 2008; Vol.2008.
Fogel, R.W., 1991. The conquest of high mortality and hunger in Europe and America: timing and mechanisms In Higonnet, P., Landes, D.S., Rosovsky, H. (Eds.), Favorites of Fortune: Technology Growth, and Economic Development since the Industrial Revolution. Harvard University Press, Cambridge, MA.
Grebmer, K. v.; Fritschel, H.; Nestorova, B.; Olofinbiyi, T.; Pandya Lorch, R.; Yohannes, Y. M. The Challenge of Hunger 2008: Global Hunger Index; International Food Policy Research Institute: Washington, DC, 2008.
International Monetary Fund (2008) Food and Fuel Prices: Recent Developments, Macroeconomic Impact, and Policy Responses, Washington, DC.
Ivanic, M., and W. Martin, 2007 “Implications of Higher Global Food Prices for Poverty in Low-Income Countries” Policy Research Working paper 4594, World Bank, Washington, DC.
Ivanic, M., and W. Martin, 2007 “Implications of Higher Global food Prices for Poverty in Low-Income Countries”
Jayne, T. S.; Rubey, L.; Tschirley, D.; Mukumbu, M.; Chisvo, M.; Santos, A. P.; Weber, M. T.; Diskin, P. Effects of Market Reform on Access to Food by Low-Income Households: Evidence from Four Countries in Eastern and Southern Africa; USAID: Washington, DC, 1995.
NTERNATIONAL LABOUR ORGANIZATION Geneva LABORSTA Labor statistics database. www.laborsta.ilo.org copyright International Labor organization 1998-2010 selection years: 1991-2007.
Ravallion, M., 1987. Markets and Famines. Clarendon Press, Oxford.
Ravallion, M., 1998. Economics and famines. Journal of Economic Literature.
Rosegrant, M. W.; Paisner, M. S.; Meijer, S.; Witcover, J. 2020 Global Food Outlook: Trends, Alternatives and Choices; International Food Policy Research Institite: Washington, DC, 2001
Sen, A., 1981. Poverty and Famines. Oxford University Press, Oxford.
Taylor, J. E.; Lambin, E. F.; Stephenne, N.; Harding, R. J.; Essery R. L. H. The influence of land use change on climate in the Sahel. J. Climate 2002,
Terpend, N. An Assessment of Knowledge about Trade and Markets Related to Food Security in West Africa; USAID Famine Early Warning Systems Network: Washington, DC, 2006
Licensed under Creative Common Page 161 Wodon, Q.; Tsimpo, C.; Backiny-Yetna, P.; Joseph, G.; Adoho, F.; Coulombe, H. Potential Impact of Higher Food Prices on Poverty: Summary Estimates for a Dozen Westand Central African Countries; The World Bank: Washington, DC, 2008.
World Bank (2008a) “Addressing the Food Crisis: The Need for Rapid and Coordinated Action” Background paper for the Finance Ministers Meetings of the Group of Eight, Poverty Reduction and Economic Management Network, Washington, DC.