Volume 66 157 Number 6, 2018
WI‑FI INDOOR LOCALISATION: A DEEPER
INSIGHT INTO PATTERNS
IN THE FINGERPRINT MAP DATA
Mikuláš Muroň
1, David Procházka
11 Department of Informatics, Faculty of Business and Economics, Mendel University in Brno, Zemědělská 1, 613 00 Brno, Czech Republic
To cite this article: MUROŇ MIKULÁŠ, PROCHÁZKA DAVID. 2018. Wi‑Fi Indoor Localisation: a Deeper Insight Into Patterns in the Fingerprint Map Data. Acta Universitatis Agriculturae et Silviculturae Mendelianae Brunensis, 66(6): 1565 – 1571.
To link to this article: https: / / doi.org / 10.11118 / actaun201866061565
Abstract
Localisation via Wi‑Fi networks is one of the possible techniques which can be used for positioning inside buildings or in other places without the GPS signal. The accurate indoor positioning system can help users with localisation or navigation within unfamiliar places. Almost all buildings are covered with the Wi‑Fi signal. Using the currently existing infrastructure will minimise cost for construction other types of indoor positioning systems. Among other reasons, usage of Wi‑Fi for positioning is also convenient because almost every mobile device has a Wi‑Fi capability and therefore the system can be easily used by everyone. However, an important factor is the precision of such a solution. The article is focused on the evaluation of Wi‑Fi localisation precision within the university grounds.
Keywords: Wi‑Fi indoor localization, Wi‑Fi navigation
INTRODUCTION
Localization via Wi‑Fi networks is one of the possible techniques which can be used for positioning inside buildings or in other places without the GPS signal. The accurate indoor positioning system can help users with navigation and a finding position in unfamiliar places.
Almost all buildings are covered with the Wi‑Fi signal. Using the currently existing infrastructure will minimize cost for construction of the positioning systems, which is an immense advantage compared to other types of positioning systems such as systems based on QR codes or Bluetooth beacons which all require building a new infrastructure. Another advantage compared to QR code location systems is the independence of a camera system, Wi‑Fi‑based systems can, therefore, work in absence of light (in a user’s pocket, etc.) Using Wi‑Fi for positioning is also convenient, because almost every mobile device
has a Wi‑Fi capability nowadays and, therefore, no additional hardware is required.
A lot of research has been done in the field of Wi‑Fi positioning. Almost every research group has developed its own version of a positioning system [e.g. Bahl (2000) or Bolliger (2008)]. However, not that much work has been done to provide insight into the measured data and their analysis. Nor there is an attempt to search for some regularity, patterns or relationships within the measured data. Hence, one of the key intentions of this paper is to provide an insight into the measured data with the focus on the identification of regularities or patterns.
Overview of approaches used in Wi‑Fi positioning
by characteristics in an unknown location and knowledge of transmitter position. (So et al., 2013). Wireless sensor networks usually use three types of physical values to determine user position. Namely (Rahman, 2008):
• DOA (Direction of Arrival), • TDOA (Time Delay of Arrival),
• RSSI (Received Signal Strength Indicator).
For most of the Model‑based methods, it is extremely important to measure the signal strength with a high precision. Even small inaccuracy will lead to incorrect estimation of the position. Unfortunately, any barriers (e.g. walls) in the signal path cause inhomogeneous signal loss which implies inhomogeneous distribution of RSSI values.
Fingerprint‑based methods are in principle very resistant to in homogeneous distribution of RSSI values. However, it is necessary to measure and store fingerprints data for all regions where the positioning will be performed. This is usually time‑consuming and the data need to be measured whenever any change in the environment occurs (Zanca et al., 2008) (Muron, 2014). Following paper aims to point to specific issues which would allow precision improvements of fingerprint‑based methods.
MATERIALS AND METHODS
Long‑time signal measurementAs previously published in Zanca et al. (2008) a So et al. (2013), signal strength differs in a particular location during a long‑time period. One of the aims of measurements presented in this paper is to determine the amount of signal fluctuation during a long‑time period and also try to find some correlation with other variables which might influence signal strength. This information can help with finding better algorithms and also provide insight into variables which are influencing signal strength.
Experiment conditions
An experiment was performed by the author of this paper and took place in the corridor of the dormitory building (Raatuse 22, Tartu, Estonia). Three datasets were captured (each with approximately 11 000 samples). Each dataset then contains measured data for roughly one day. Data collection itself was performed with a simple bash script using utility iwlist for obtaining signal strength (RSSI and dBm). The mean interval between
Raspberry Piwas used as a hardware platform, together with an external Wi‑Fi adapter connected to USB port (Ralink). For movement detection in the measured area, a motion sensor was installed and motion data were captured together and in sync with Wi‑Fi signal strength data.
Signal fluctuation over time
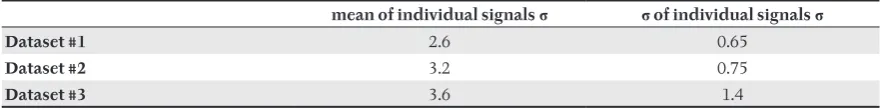
Knowing the exact variance of a signal is important for estimating theoretical positioning precision over a long‑time period. Tab. I shows Mean of the standard deviation of signals over a long‑time period. These values are calculated for every dataset. Fig. 2 shows the aggregated signal strength of all APs in the given dataset. Fig. 3 shows the distribution of signal for every stable AP in the dataset.
Distribution of stable APs over time
For further analysis, only APs with high occurrence rate should be used. APs emerging only for a short period of time are considered unstable and are excluded from further analysis. These APs are typically broadcaster by mobile hotspots or similar devices.
The number of stable APs obviously strongly depends on the environment. However, measurements performed (by the author) in other places showed that for all tested public places (school, library, dormitory, restaurant) the proportion between stable and unstable follows Pareto principle. For the purposes of this article, a signal with occurrence rate higher than 90 % is considered as stable.
Determining variables influencing signal strength
As the data in the Tab. Ishow, signal strength is very variable. It would be very helpful if we knew which environment variables are correlated with the signal and influence the signal strength. This would allow us to build a prediction model and therefore enhance the precision of the fingerprint map. For this purpose, three environmental variables were chosen to test whether there is a correlation between them and network signal strength:
• Sunlight (W / m2) – yellow in figures
• Motion (in approx. 8 m radius) – green in figures • Temperature (°C) – blue in figures
These variables were captured together in sync with signal strength and results are shown in the Fig. 3and Fig. 4. It is evident from the figures that any of these variables correlate with signal strength
I: Standard deviation of signals over a long‑time period
mean of individual signalsσ σ of individual signalsσ
Dataset #1 2.6 0.65
Dataset #2 3.2 0.75
1: Aggregated signal. Dataset #1
2: Signal strength distribution for every stable signal. Dataset #1
find some other environmental variables which are more directly connected to the signal strength could be the topic of an additional research.
Relationship between signal strength and signal variance
Despite all of the failures while trying to find environmental variables influencing signal strength, there is one interesting finding in the relationship between signal strength and corresponding signal variability. As shown in the Fig. 5, there is a very strong correlation between signal strength and variability in all measured datasets.
The question remains on how to use this knowledge to improve the precision. One possibility is to set lower weight for high‑level signals, but further research needs to be done in this aspect to cover all possible outcomes.
Signal variance during the day
The hypothesis is that signal strength varies during the day in regular patterns (for example – during the mornings signal has a different strength than during the evenings). If so, we can measure different fingerprint maps for different times of the day and later use corresponding fingerprint map measured in the same part of the day.
For that purpose, the whole dataset containing long‑term data was divided into pieces (one piece contains data per 6 hours) and mean for every signal in the subgroup is displayed. If our hypothesis holds, we expected is a clear difference
Therefore, the hypothesis assuming a relationship between signal strength and period of the day is rejected in this case.
Finding optimal grid size
Another interesting question is finding an optimal distance between points in the fingerprint map. If the distance between points is too large, the positioning system is unnecessary losing precision. On the other hand, if the distance is too small, a lot of false positive matches are introduced because samples from one point are overlapping with samples from nearby point(s).
Experiment conditions
Data were captured twice (with the same conditions as described in chapter Long‑time signal measurement) on tree distinct locations which were 1 m and 0.5 m apart from each other. Every measurement contains 40 unique samples. This process leads to the creation of two different datasets with 120 data samples in each of them. For performing the measurement, a simple Android application was developed.
Signal distance between places
The distribution of the strongest signal for spots with distance 1 m and 0.5 m from each other is shown in the Fig. 7 and Fig.8. Each colour represents one spot in the area. For Fig. 7 (the distance 1 m between spots), it is very easy to distinguish each location compared to Fig. 8 where the data from a location
5: Signal level to signal std. Dataset #2
are frequently merged together and classifying them into the right spot would be very difficult.
Mean value of distances between all stable APs together with maximal measured signal distance is shown in the Tab. II and Tab. III.
In this case, the optimal distance between measured points is around 1 m. However, this value is valid only for a building with a relatively high Wi‑Fi coverage (7 stable APs and more). It possible that in buildings with a lower Wi‑Fi coverage or
7: Distribution of the strongest signal for 1 m spot distance (each colour represent one place)
8: Distribution of the strongest signal for 1 m spot distance (each colour represent one place) II: Signal distance between places – spot distance 1 m
distance between spots mean signal distance maximal signal distance
1 – 2 4.51 11.34
2 – 3 4.68 13.34
III: Signal distance between places – spot distance 0.5 m
distance between spots mean signal distance maximal signal distance
1 – 2 3.97 8.79
different floor plan, this value may vary. Due to this uncertainty, it is not feasible to apply any of the optimization methods at this point. This issue can be a topic for a further examination.
It is important to keep in mind that the value of optimal grid size has been calculated from short‑term data (60 samples per location) and precision considering long‑term signal fluctuation is way worse. (see chapter Short‑term vs. long‑term signal distribution)
Short‑term vs. long‑term signal distribution
Signal strength distribution for a short‑term measurement may be different compared to long‑term distribution. As illustrated in the Fig.
9 and Fig. 10 (green line represents short time measurement and red line long‑term). For a given time‑frame, the signal can be temporarily shifted compared to long‑term distribution at a given place. Amount of the shift is related to the number of samples. To illustrate this effect, see Fig. 10 which compares 15 samples captured in specific location vs. long‑term signal distribution Data in this figure. is shifted more than in the Fig. 9 which compares 30 samples. This effect can reduce system precision for moving users because the mean of the data with only a few samples is often shifted compared to measurements with more samples. This will lead to the inaccurate estimate of position.
10: Short‑term vs long‑term – 15 samples
CONCLUSION
Measured signal characteristics presented in this paper can be used as a basis for performance‑enhancing of fingerprint locations algorithms. They also provide an insight into less known issues of Wi‑Fi signal variability which contributes to errors and inaccuracies in location algorithms. According to our measurements, we are proposing a few guidelines and suggestions to keep in mind when designing a new fingerprint‑based location system or algorithm:
1) When designing parameters of the fingerprint map, it’s important to consider the amount of long‑term signal fluctuation as shown in the chapter Signal fluctuation over time. Based on these findings, we suggest constructing a fingerprint map not only by one set of measurements but rather as an average of more measurements performed in different conditions.
2) To achieve higher location accuracy, we recommend focusing on the signal difference between neighboring spots in the fingerprint map. Based on measurements performed in the specific location, set optimal grid size with regard to the environment complexity and used location algorithm. In our use case (selected set of public places, 7 stable APs), the optimal distance between spots was around 1 m.
3) An even higher accuracy can be achieved by weighting signals on the RSSI basis as described in the chapter Relationship between signal strength and signal variance, however, this finding needs to be embedded into the location algorithm.
4) For the positioning of moving objects (e.g. people), it is also advisable to keep in mind the difference between short‑ and long‑term signal characteristics, whereas this phenomenon may introduce an additional source of inaccuracy as described in the chapter Short‑term vs. long‑term signal distribution. It is therefore important to set attributes of the system with respect to the expected mobility of the tracked objects.
5) We also suggest to deploy Wi‑Fi location services in areas with a high AP density and stability, depending on the complexity of the environment, 3 APs is the bare minimum (with a high error rate), every additional AP will reduce an amount of positioning error.
Acknowledgements
REFERENCES
BAHL, P. and PADMANABHAN, V. N. 2000. RADAR: an in‑building RF‑based user location and tracking system. In: Proceedings IEEE INFOCOM 2000. Conference on Computer Communications. 26 – 30 March 2000, Tel Aviv, Israel, pp. 775–784.
BOLLIGER, P. 2008. Redpin ‑ Adaptive, Zero‑configuration Indoor Localization Through User Collaboration. In: Proceedings of the First ACM International Workshop on Mobile Entity Localization and Tracking in GPS‑less Environments (MELT ’08). San Francisco, California, USA — September 19, 2008, pp. 55–60.
MURON, M. 2014. Building Wi‑Fi based indoor geolocation system for Android. In: PEFnet ‑ European scientific conference of doctoral students. Mendel University in Brno.
RAHMAN, M., HABIBI, D. and AHMAD, I. 2008. Source localisation in wireless sensor networks based on optimised maximum likelihood. In: Telecommunication Networks and Applications Conference. ATNAC 2008. Adelaide, Australia: IEEE Press, pp. 235–239.
SO, J. 2013. An improved location estimation method for wifi fingerprint‑based indoor localization. International Journal of Software Engineering and Its Applications, 7(3): 77–86.
ZANCA, G., ZORZI, F., ZANELLA, A. and ZORZI, M. 2008. Experimental Comparison of RSSI‑based Localization Algorithms for Indoor Wireless Sensor Networks. In: Proceedings of the Workshop on Real‑world Wireless Sensor Networks (REALWSN ’08). ACM, New York, NY, USA, pp. 1–5.
ZHU, X. and FENG, Y. 2013. RSSI‑based Algorithm for Indoor Localization. Communications and Network. 5.02: 37.