The Analysis Of Economic Structure Based On
Shift Share Approach In East Java Province
(Study In Minapolitan Area)
Endah Kurnia Lestari, Siti Komariyah, Siti Nurafiah
Abstract: Minapolitan area is a part of the region that functioning as a center for production, processing, marketing of fishery commodities, services, and / or other supporting activities. Based on its progress, not all the districts included in the Minapolitan Area have a better growth rate than other district. The purpose of this study is to determine the potential competitiveness of the fisheries sub-sector in the future in each district / city that is included in the Minapolitan Area. The analytical tool used is Classic Shift Share and Esteban Marquillas. The analysis shows that the performance of the district / city fisheries sub-sector in the Minapolitan Region experienced positive growth. The district that has the highest average level of specialization is Lamongan Regency (Specialization 3,444,251). While the highest competitive advantage is Tuban District (Competitive Advantage 3.006382).
Index Terms: The Transform, Competitiveness, Leading Sub Sector, Shift Share, Minapolitan Area,
—————————— ——————————
1. INTRODUCTION
The economic development can be interpreted as a series of businesses in the economic field through the development of economic activities that aimed at creating equitable levels of income, employment opportunities, and prosperity of the community. The development strategy adopted by the government depends on the basic conditions, structure and level of interdependence between primary, secondary and tertiary sectors. Primary sectors include the Agriculture, Forestry and Fisheries Sectors. For some developing countries, especially Indonesia, the primary sector has a high level of contribution in economic development. The high level of contribution is due to the large potential of the primary sector. Indonesia is a country that has the largest diversity of flora and fauna in the world (megabiodiversity), which is supported by vast areas of agriculture and waters. East Java is one of the provinces in Indonesia which has the highest area on the island of Java with a coastline of 3,498.12 km. In an effort to develop the regional economy, especially for the primary sector, the government has made various efforts to increase economic development. One of the efforts made by the government is the development of the Minapolitan Area. The Minapolitan area is part of an area that functioning as a center for production, processing, marketing of fishery commodities, services and other supporters that have two main concepts. First, as a development concept of the marine and fisheries sub-sector. Second, as an economic region that has superior marine and fisheries products. The formation of the Minapolitan Area in East Java Province was decided by the Minister of Maritime Affairs and Fisheries RI Number 35 / KEPMEN-KP / 2013 concerning the determination of the Minapolitan Area. There are 14 district / cities that are the development areas, namely: Blitar, Trenggalek, Lamongan, Gresik, Malang, Tulungagung, Sidoarjo, Pasuruan, Probolinggo, Banyuwangi, Pacitan, Tuban, Sumenep, and Probolinggo Cities.
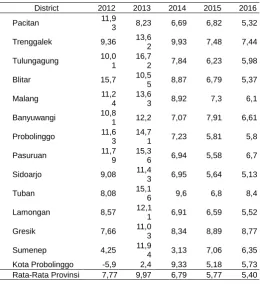
Tabel 1.
GRDP Growth Rate of Fisheries Sub Sector in East Java Province Minapolitan Area 2012-2016
District 2012 2013 2014 2015 2016
Pacitan 11,9
3 8,23 6,69 6,82 5,32
Trenggalek 9,36 13,6
2 9,93 7,48 7,44
Tulungagung 10,0 1
16,7
2 7,84 6,23 5,98
Blitar 15,7 10,5
5 8,87 6,79 5,37
Malang 11,2
4 13,6
3 8,92 7,3 6,1
Banyuwangi 10,8
1 12,2 7,07 7,91 6,61
Probolinggo 11,6 3
14,7
1 7,23 5,81 5,8
Pasuruan 11,7
9 15,3
6 6,94 5,58 6,7
Sidoarjo 9,08 11,4
3 6,95 5,64 5,13
Tuban 8,08 15,1
6 9,6 6,8 8,4
Lamongan 8,57 12,1
1 6,91 6,59 5,52
Gresik 7,66 11,0
3 8,34 8,89 8,77
Sumenep 4,25 11,9
4 3,13 7,06 6,35 Kota Probolinggo -5,9 2,4 9,33 5,18 5,73 Rata-Rata Provinsi 7,77 9,97 6,79 5,77 5,40
Source: Statistics Indonesia, 2017
In its development, the GRDP growth rate of the Fisheries sub-sector by Regency and City of East Java Province in 2012-2016 shows that not all Minapolitan areas experienced high or increasing growth rates. The low growth rate is due to the lack of potential development of the fisheries sub-sector, so that the sub-sector is only concentrated in a few districts. The magnitude of the growth rate can be seen in table 1. Based on this background, the formulation of the problem to be achieved is how the potential competitiveness of the fisheries sub-sector in the future. The purpose of this study is to determine the potential competitiveness of the fisheries sub-sector in the future in the Minapolitan area of East Java. ————————————————
Endah Kurnia Lestari, Faculty of Economic and Business, University of Jember, Indonesia (email: endahkurnia51@gmail);
Siti Komariyah, Faculty of Economic and Business, University of Jember, Indonesia (email: [email protected]);
1448
2 LITERATURE REVIEW
Competitiveness is the ability of an economic sector based on comparison can be more beneficial for the development of an area compared to other regional averages in a wider area. Theories that related to competitiveness are the theory of absolute advantage and comparative advantage theory.
2.1 The Theory of Absolute Advantage
The first absolute advantage theory was presented by Adam Smith who stated that each country would benefit from international trade because it specializes in products and exports goods if the country or region has absolute advantage, and imports if the region does not have an absolute advantage. An area is said to have an absolute advantage if the region is able to produce goods at a lower cost than other regions.
2.2 The Theory of Comparative Advantage
The theory of comparative advantage was presented by David Richardo in 1917. This theory suggests that if there are two countries that trade each other and each country has a comparative advantage then both countries will benefit. This theory also applies to regional economies. An area is said to have a comparative advantage if it has a commodity which is considered relatively superior compared to other commodities in its area.
3
RESEARCH
METHOD
This research use a quantitative descriptive approach with quantitative and qualitative methods. The unit of analysis that used in the study are all fisheries sub-sectors in the Minapolitan Area of East Java Province. The type of data used is secondary data sourced from the Central Statistics Agency of districts / cities in East Java, Department of Maritime Affairs and Fisheries, or data sourced from other agencies and the internet. The analytical method used in this research is Shift Share with the Classical approach and Esteban Marquillas. Shift Share Analysis is used to determine the shift in the structure of activity in a location compared to a wider area. The results of the analysis describe the performance of the fisheries sub-sector in an area and compare it with the performance in the total region. The Shift Share equation is as the below :
Dij = Nij + Mij +Cij (1)
Dij is GRDP Changes in the district / city fisheries sub-sector, Nij is Changes in the GRDP fisheries sub-sector in the districts / city areas that are affected by economic growth in East Java Province, Mij is Changes in the GRDP fisheries sub-sector in districts / cities that are affected by the growth of the Provincial sub-sector East Java, and Cij are competitive advantage components that explain changes in the GDP of the fisheries sub-sector in an area due to the competitive advantage of the fisheries sub-sector in East Java Province. Each component can be calculated calculated using the formula:
Nij = Eij.rn (2)
Mij = Eij (rin-rn) (3)
Cij = Eij (rij-rin) (4)
Eij is the district/ city fisheries sub-sector GRDP at the beginning of the analysis year, rn is the growth rate of East Java Province's GRDP, rin is the growth rate of the East Java
Province's fisheries sub-sector, and rij is the growth rate of the district / city fisheries sub-sector.
Esteban Marquillas modified the Shift Share analysis to be able to detect sectors that have competitive advantages and specialization in a district. Modifications are to redefine competitive advantage into a third component and create a fourth component, namely the effect of allocation (Aij). In its modification, Esteban Marquillas added E * ij as a new element as a district variable (Eij). E * ij can be formulated:
E*ij = Eij (Ein-En) (5)
Ein is the provincial GDP sub-sector of fisheries at the beginning of the analysis year and En is the provincial GRDP at the beginning of the analysis year. Through the following equation, the equation can be changed to:
Cij = Eij (rij-rin) atau E*ij (rij-rin) (6)
Aij shows the specialization and competitive advantage in the fisheries sub-sector in the district / city. Aij components can be calculated using the formula:
Aij = (Eij-E*ij)(rij-rin) (7)
(Eij-E * ij) shows the level of specialization and (rij-rin) shows the level of competitive advantage in the district / city fisheries sub-sector. So that the modified Shift Share Esteban Marquillas can be formulated:
Dij = Nij + Mij + C*ij + Aij (8)
4 RESULT
that the growth of district / city fisheries sub-sector is higher than the growth of sub-sectors in East Java Province. The highest sub-sector growth occurred in Lamongan Regency by 4,222.48. The high growth rate is supported by the potential in the abundant field of aquaculture and capture fisheries. In
addition, this regency is located in a very strategic area, namely on the North Coast route that connects regencies / cities in the northern region with a coastline length of 47 km and there are several cultivation centers spread across seven districts.
Tabel 2. Classical and Esteban Marquillas Shift Share Analysis of Fisheries Sub-Sector in District Regency / City of Minapolitan Region East Java Province 2012-2016
SS - Klasik SS - Esteban Marquillas
Districts (Dij) (Nij) (Mij) (Cij) (Aij) rij-rin Eij-E*ij Code 1. Pacitan 4.561 3841,618 831,95 -112,784 -145,757 -0,21862 666,7188 3 2. Trenggalek 6.545 3937,962 818,90 1788,589 1802,328 2,633882 684,2861 1 3. Tulungagung 5.199 3341,096 695,63 1162,35 1282,577 2,208882 580,6456 1 4. Blitar 6.680 4877,868 1.035,78 766,0861 772,0326 0,911382 847,1014 1 5. Malang 7.649 4949,701 1.035,35 1664,122 1723,25 2,003882 859,9561 1 6. Banyuwangi 28.850 19645,89 4.160,60 5043,204 4994,363 1,463882 3411,726 1 7. Probolinggo 6.682 4668,286 984,04 1029,699 1138,563 1,403882 811,0109 1 8. Pasuruan 3.055 2069,099 435,86 549,9218 597,2323 1,661382 359,4793 1 9. Sidoarjo 10.384 8251,889 1.766,67 365,3151 435,4218 0,303882 1432,867 1 10. Tuban 14.883 8646,556 1.794,48 4441,719 4517,687 3,006382 1502,699 1 11. Lamongan 26.665 19833,76 4.222,48 2608,945 2751,549 0,798882 3444,251 1 12. Gresik 25.924 15891,62 3.352,91 6679,672 6275,351 2,273882 2759,753 1 13. Sumenep 18.169 14684,36 3.177,68 306,9311 347,5867 0,136382 2548,634 1 14. Kota Probolinggo 1.260 1252,83 276,80 -269,794 -287,637 -1,32362 217,311 3
Source: East Java Central Statistics Agency, processed
The next component is the competitive advantage component (Cij). Based on Table 2, some regions experienced positive growth and some of them experienced a negative shift. A number that shows a positive value can be interpreted that the sub-sector has a competitive advantage. While negative numbers can be interpreted that the sub-sector does not have a competitive advantage. The area with the highest competitive advantage is Gresik Regency with an advantage of 6679,672. This condition is supported by the use of technology and the availability of infrastructure. Based on data from the Department of Fisheries and Maritime Affairs in Gresik Regency in 2017, the number of motorboats was 397 units, outboard motorboats were 4,065 units, motorboats were 28 units, fish auction places were located at several points, and there was the support of the largest aquaculture ponds in Java East. Esteban Marquillas perfected the classic Shift Share analysis by modifying competitive advantage and adding allocation effects (Aij) to determine the effects of allocation and specialization in a sector. The allocation effect shows whether a sub sector in an area can be specialized with the existing economic sector or vice versa. The greater the value of the allocation effect, the better the income and employment opportunities that are distributed. In Table 2, the effect value of fisheries sub-sector allocation in several districts / cities shows positive values. The impact of allocation effects can be divided into 4 categories. The first category is the Fisheries Sector has a competitive and specialized advantage. The second category has a competitive advantage but is not specialized. The third category has no competitive advantage but is specialized. The fourth category of sub-sectors has no competitive advantage and is not specialized. The analysis shows that almost all districts / cities have competitive advantages. Regions that do not have a competitive advantage in the fisheries sub-sector are Pacitan Regency and Probolinggo City. The lack of facilities and
infrastructure, natural damage both natural disasters and climate change, as well as the geographical conditions that are less supportive cause the area still does not have a competitive advantage in the fisheries sub-sector. The regency / city that has the highest average competitive advantage is Tuban, which is 3.006. Regencies / cities that have the highest level of specialization are Lamongan Regency with 3,444,251. The development of fisheries sub-sector in each district / city is influenced by several supporting factors and inhibiting factors, among others;
1. The Distrits of Pacitan The Supporting factors include:
1) An increase of production both capture and cultivation every year,
2) The existence of government assistance in the form of capital for businesses, through the Environmental-Based Partnership Program (PKBL) of PT. Social Security, Food and Energy Security Credit (KKPE), Anti Poverty Program (APV), which in its implementation collaborates with banks, cooperatives, and private parties,
3) The activities that support the reduction of violations such as sea security patrols,
4) Improving the capabilities of hard skills and soft skills for fishermen, cultivators, processors, and marketers groups conducted by the district, provincial and central fisheries services.
Inhibiting factors, including:
1) Mountainous geographical conditions that cause limited water resources for cultivation,
2) Limited capital also science and technology so that production and processed products cannot be optimally marketed,
3) Inadequate fishing facilities and infrastructure, processing and marketing,
1450 change,
5) The existence of fisheries resource utilization activities in coastal and coastal areas that do not pay attention to environmental preservation
2. The Districts of Trenggalek Supporting factors include:
1) The existence of the Nusantara Fisheries Port (PPN) established in the Prigi Bay area.
2) Potential of the area of ponds owned is ± 1,000 Ha, marine cultivation ± 3,500 Ha, potential of ponds ± 100 Ha, potential public waters of 26,746 Ha for reservoirs, and rivers along 297,506 km and coastline length of 96 km. 3) The fishing communities that carry out fishing business are
generally joined in a Joint Business Group consisting of more than 100 groups.
3. The Districts of Tulungagung Supporting factors include:
1) There is a coastline of 61,470 km and a potential of 504.5 ha of public waters consisting of reservoirs, lakes, swamps and rivers.
2) Application of fisheries development priorities in rural people's fisheries development with the aim of improving the welfare of fish farmers and fishermen.
3) Provision of two Fish Auction Market namely Popoh and Sine , and two Fish Seed Centers namely Jepun and Bolorejo
4. The Districts of Blitar Supporting factors include:
1) Potential fisheries and aquaculture commodities because the area is directly adjacent to the Indonesian South Ocean.
2) Blitar Regency is known as one of the centers of koi fish in Indonesia.
Inhibiting factors, including:
1) There is no specific marketing agency that functioning to stabilize the prices.
2) There is no standardization of prices. The price determined depends on the aesthetic value of koi fish and the agreement between the seller and the buyer.
5. The District of Malang Supporting factors include:
1) Potential of capture fisheries and aquaculture in sea which are spread in 6 districts located in coastal areas, namely; Sumbermanjing, Bantur, Gedangan, Ampelgading, Donomulyo, and Tirtoyudo Districts.
2) There are 19 villages that stretch along the coastline along 92, 244 km.
3) Some supporting facilities such as; fish auction places, ships, boats, ice factories, and ports
Inhibiting factors, including:
1) The small amount of land that can be used for cultivation activities is due to the increase in residential areas.
2) A decline in household business. In 2003 there were 16,905 agricultural household businesses. However, in the 2013 census, there were 6,058 agricultural household businesses.
6. The District of Banyuwangi Supporting Factors include:
1) There is guidance for the community in an effort to increase knowledge and expertise in the field of fisheries carried out by the Banyuwangi Government.
2) Banyuwangi also has advantages in the field of fish exports.
Inhibiting factors, including:
1) The facilities and infrastructure that are less supportive or are still in a bad condition for use at some point.
7. The District of Probolinggo Supporting factors include:
1) The Regency area is crossed by 25 rivers, including the longest river is the Rondoningo River with a length of 95.2 km.
2) Probolinggo also has a lake called Ranu Segaran, Ranu Petak, and Ranu Agung.
8. The District of Pasuruan Supporting factors include:
1) Carrying capacity as a beach with a length of 48 km. 2) Implement sustainable rehabilitation of marine ecosystems
in one way by rejuvenating coral reefs along the coastline and increasing mangrove tree planting, building fish houses placed on the coastline aimed at increasing fish populations.
3) Application of technology, facilities and infrastructure, improvement of human resources and several programs that are implemented in potential areas.
4) Procurement of modern fish processing training, the establishment of central institutions that involve stakeholders, strengthening cooperation with financial institutions, increasing the availability of fish processing raw materials, and increasing packaging, marketing of processed fish products, and the role of the government as regulator.
Inhibiting factors, including:
1) Increasing the number of industries that affect the amount of agricultural land and aquaculture.
9. The District of Sidoarjo Supporting factors include:
1) The area is bordered by the Madura Strait so that it has a variety of potential both aquaculture and capture fisheries with shrimp and milkfish which are the main fishery commodities with a wide area of ponds stretching from north to south along the east coast.
2) Fisheries area development is found in six districts, namely; Candi, Sidoarjo, Waru, Sedati, Buduran and Jabon Districts.
Inhibiting factors, including:
1) The reduction in aquaculture ponds caused by the Lapindo mudflow disaster that occurred in 2006.
2) Quality and carrying capacity of inadequate infrastructure such as hatcheries and production roads.
3) The number of large and medium industries continues to increase.
10. The District of Tuban Supporting factors, including:
1) The total sea area is 22,608 km2 or 92.47 percent of the total land and sea area.
2) The potential of marine aquaculture in Tuban is coral reefs, seaweed, seagrass beds, mangrove nurseries.
3) Potential for aquatic aquaculture are ponds, cages, ponds, floating nets and paddy ponds.
4) Along the coastal area of Tuban has a lot of infrastructure and activity centers, such as the northern coast road connecting East Java with West Java, warehousing, ports, settlements and tourism areas.
Inhibiting factors, including:
unable to withstand waves of sea water which cause damage to ponds.
11.The Districts of Lamongan Supporting factors include:
1) Lamongan has abundant potential in the field of aquaculture and capture fisheries. This district is located in a very strategic area, namely on the North Coast line that connects regencies / cities in the North with a coastline length of 47 km.
2) The aquaculture centers that are scattered in seven districts, namely: districts of Deket, Glagah Karangbinangun, Lamongan, Turi, Kalitengah, and Karanggeneng. Whereas capture fisheries are supported by the existence of the Fish Landing Center (PPI) Lohgung, Labuhan, Blimbing, Weru, and Kranji.
12. The District of Gresik Supporting Factors include:
1) The use of technology and the availability of facilities and infrastructure.
2) The availability of several fish auction places, which are in the villages of Campurejo, Tanjung, Lumpur, Bawean and Bayuurip.
3) Gresik has a pond area of 30,904.5 ha out of 51,609 ha utilized in East Java.
4) Fishponds and ponds that produce superior commodities are vaname shrimp, milk fish, tawes, snapper, tilapia, crabs, catfish, and catfish.
5) Coastal areas which include Panceng, Bungah, Ujung Pangkah, Sangkapura, and Tambak (Bawean) Districts are aquaculture with superior commodities of grouper, and green mussels.
13. The District of Sumenep Supporting factors include:
1) The water area of around 50,000 km2.
2) Potential for marine cultivation is 287,324.75 ha, brackish cultivation 4,315 ha, fresh cultivation is 24.50 ha. While the potential for fisheries ecosystems include; mangrove forests covering an area of 11,844.40 ha, seagrass beds covering 803.27 ha, and coral reefs covering an area of 23,297.59 ha.
Inhibiting factors, including:
1) Human resources are still very limited in ability and expertise.
2) There is no support in terms of capital and the lack of capture and cultivation equipment used.
3) Lack of law enforcement facilities and infrastructure results in frequent illegal fishing and clashes between fishermen. 14. The City of Probolinggo
Supporting factors include:
1) The development of facilities and infrastructure in this area is quite significant as evidenced by the existence of various facilities and infrastructure facilities such as; the coastal fishery port, the development of the Port of Tanjung Tembaga which became the Nusantara Port, the fish seed hall and Aquabis development, the provision of a fishing fleet, and the area of cultivation land covering an area of 164.5 ha.
2) Inhibiting factors, including:
1) Probolinggo City has an area of 56.67 km2 or only 3.23 percent of the total area of Probolinggo Regency and City. 2) Probolinggo City is located on the north of the island of Java bordering the Madura Strait with a coastline length of 7 km.
5 CONCLUSION
Esteban Marquillas Shift Share analysis results show that throughout 2012-2016, the fisheries sub sector has a level of specialization in each district / city. The region that has the highest level of specialization is Lamongan Regency with 3,444,251. Regency / city which has the highest average competitive advantage is Tuban Regency with 3,006. While districts / cities that do not have an average competitive advantage are Pacitan and Probolinggo.
6
REFERENCES
[1] Decree of the Minister of Maritime Affairs and Fisheries of the Republic of Indonesia Number 35/ KEPMEN-KP/2013,”Penetapan Kawasan Minapolitan,”2013.
[2] Development Planning Agency at Sub-National Level,”Dokumentasi Hasil Pelaksanaan Pembangunan Kabupaten/Kota se-Jawa Timur Tahun 2018,”2018.
[3] Gustiano, R., I.I. Kusmini, and M.H.F. Ath-thar,” Mengenal Sumber Daya Genetik Ikan Spesifik Lokal Air Tawar Indonesia untuk Pengembangan Budidaya,”2015.
[4] Hardaningrum, F., ”Pengembangan Jalan Produksi Perikanan di Kabupaten Sidoarjo,”,e-Journal Spirit Pro Patria, vil.1, no. 1, pp. 9-18, 2015.
[5] Kurniawan, A., Budiman, and R. Darma, ”Arahan Pengembangan Sentra Pengolahan dan PemasaranIkan di Kecamatan Lekok, Kabupaten Pasuruan,”.
[6] Maritime Affairs and Fisheries Office of East Java Province,”Kompleksitas Zona Kawasan Konservasi Kabupaten Malang,”, 2018.
[7] Nurhadi, and Sumarsono, ”Analisis Dampak Pelabuhan Ikan-PPN Prigi terhadap Peningkatan Pendapatan Wilayah Kecamatan Watulimo, Kabupaten Trenggalek dengan metode Input-Output Analisis,”Trunojoyo, vol. 10, no. 2, pp. 185-191, 2017.
[8] Pacitan Regency Fisheries Service, ”Revisi Rencana Strategis Tahun 2016-2021,”2018.
[9] Paena, M., Utojo, and E. Ratnawati,”Penentuan Potensi Lahan dan Profil Budidaya Tambak di Kabupaten Gresik Provinsi Jawa Timur,”,Prosiding Indoaqua-Forum Inovasi Teknologi Akuakultur, 2012.
[10] Prahastuti, T., ”Kemendag Nilai Produk Perikanan Banyuwangi Tembus Pasar Global,”, Merdeka.com, 2016.
[11] Probolinggo City Government,”Potensi Daerah,”,2016.
[12] Soleh, A., “Kontribusi dan Daya Saing Ekspor Sektor Unggulan dalam Perekonomian Jawa Tengah,” Faculty Economics and business, 2012. [13] Sukirno, S. “Ekonomi Pembangunan,”2006. [14] Sulistiyanti and Wahyudi,” Pengembangan
Ekonomi Wilayah Berbasis Sektor Perikanan di Provinsi Jawa Timur,”Media Trend, vol. 10, no. 2, pp. 140-164, 2015.
[15] Sumenep Regency Fisheries Service,” Laporan Kinerja Instansi Pemerintah (LKjlP),”,2017.
1452 Mewujudkan Pembangunan Berkelanjutan,”,Jurnal
Teknik Waktu, vol. 10, no. 02, pp. 45-53, 2012 [17] Suprapti, Y., A. Sudianto,” Analisis Dampak
Fungsional Keberadaan Hutan Mangrove di Kabupaten Tuban,”, PENA akuantika, vol. 18, no. 1, pp. 63-70, 2019.
[18] Tarigan, R., “Ekonomi Regional,” Bumi Aksara, 2005
[19] Triyanti, R., and M. Yulisti,”Rantai Pemasaran Ikan Koi (Cyprinus carpio) di Kabupaten Blitar, Jawa Timur,”2012.