Scale-up of affinity separation based on magnetic
support particles
By
Kamran Zulqarnain
A thesis submitted to The University of London for the
degree of Doctor of Philosophy
Department of Biochemical Engineering
1999
All rights reserved
INFORMATION TO ALL U SE R S
The quality of this reproduction is d ep en d en t upon the quality of the copy subm itted.
In the unlikely even t that the author did not sen d a com plete manuscript
and there are m issing p a g e s, th e se will be noted. Also, if material had to be rem oved, a note will indicate the deletion.
uest.
ProQ uest U 6 43633
Published by ProQ uest LLC(2016). Copyright of the Dissertation is held by the Author.
All rights reserved.
This work is protected against unauthorized copying under Title 17, United S ta tes C ode. Microform Edition © ProQ uest LLC.
ProQ uest LLC
789 East E isenhow er Parkway P.O. Box 1346
I would like to acknowledge the following people.
Professor Peter Dunnill for his guidance and encouragement throughout my studies.
Dr Owen Thomas for his support and advice despite being far away.
Dr Quentin Pankhurst and Quang Tuong Bui for helping me to understand magnetics.
And finally, I would like to thank my family and friends, both past and present, who
There is an incentive to introduce affinity separation techniques earlier in downstream
processing due to their superior selectivity and recovery capabilities. However, as most
conventional affinity separations tend to use porous adsorbents they are susceptible to
fouling from colloidal matter present in early stage feedstocks. There is evidence to
suggest that non-porous matrices are more resistant to fouling and therefore potentially
more suitable for particulate and foulant feedstreams. To obtain a comparable surface
area to typical porous supports for ligand immobilisation, the dimensions of a non-
porous particle have to be much smaller, and their separation from cell debris again
presents a problem. Magnetic separation allows the recovery of such small particles in
the presence of biological matter with relative ease.
This thesis describes the preparation and characterisation of sub-micron magnetic
particles using simple chemical precipitation techniques amenable to scale up, to
produce suitable iron oxide matrices for the manufacture of affinity supports. These
adsorbents were subsequently used in laboratory scale experiments for the selective
recovery of proteins from crude liquors. Preparative scale recovery of magnetic
adsorbents was then carried out using high gradient magnetic separation (HGMS)
technology.
An optimal ratio of Fe^'^/Fe^'^, 1:2, was identified to produce non-porous
superparamagnetic crystals (~ 12 nm in diameter) with a specific surface area of 110 m^
g '\ a saturation magnetism of -40 emu g'^ combined with low residual magnetism.
These particles were silanised and subsequently coated with polyglutaraldehyde, epoxy
activated, capped with ammonium groups and coupled with Cibacron Blue. The
selectivity and interaction of these supports were assessed by using enzymes (lactate,
malate and alcohol dehydrogenases) that are known to have an affinity for Cibacron
Blue. High binding capacities (> 110 mg g'') and affinities (kd < 1.2 |xM) were obtained.
Furthermore, the presence of suspended solids in the homogenate appeared to have no
negative affect on the performance of the adsorbents in the recovery of the target
molecule. In a separate study lysozyme magnetic particles (LMP) were prepared from
the polyglutaraldehyde coated supports and successfully used to recover Fv fragments
from clarified E. coli lysate. On a preparative scale using HGMS, Fv fragments of high
purity (98 %) were eluted in a single step with a purification factor of 54.1. A parallel use
of the LMP was to release periplasmic a-amylase from E. coli cells. This technique
Title p age... 1
D edication... 2
A cknow ledgem ents... 3
Abstract... 4
Table o f C ontents... 5
List o f Figures... 10
List o f T ab les... 12
A bbreviations...13
1. IN T R O D U C T IO N ...14
1.1 Re s e a r c h in t od o w n s t r e a mp r o c e s s in g... 14
1.2 Pr o t e inpu r if ic a t io ns t r a t e g y... 15
1.3 Pr o c e s s e sf o rd o w n s t r e a mp r o c e s s i n g...16
1.3.1 Cell disruption...17
1.3.2 Cell recovery and clarification processes...79
1.3.3 Primary separation operations...27
1.3.4 Secondary purification...22
1.4 Sin g l est e pp u r ific a t io nu s in ga ffin itys e p a r a t i o n... 25
1.4.1 Batch adsorption...26
1.4.2 Packed bed adsorption...2 7 1.4.3 Fluidised bed adsorption...2 7 1.4.4 Expanded bed adsorption...28
1.4.5 Magnetic separation...28
1.5 A f f i n i t y MATRICES... 28
7.5 .7 Choice o f affinity ligand...2 9 1.6 Dy e-l ig a n dc h r o m a t o g r a p h y...30
1.6.1 Interactions o f reactive dyes with proteins...32
1.6.2 Principles o f dye-ligand chrom atography...32
1.6.3 Spacer arm...34
1.6.4 Ligand concentration...34
1.6.5 Coupling o f dyes to support...34
1.6.6 Dye leakage...34
1.6.7 Buffer conditions...35
1.6.8 Regeneration o f dye ligands...36
1.6.9 Large-scale applications o f dye-ligand chrom atography...36
1.7 Eq u il ib r iu mp a r a m e t e r s...38
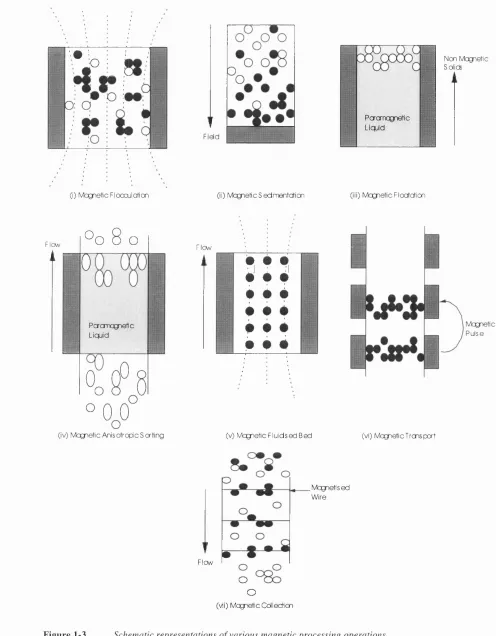
1.8.1 Magnetic separation techniques...40
1.9 Highg r a d ie n tm a g n e t icc o l l e c t io n... 4 4 1.9.1 HGMS concept...46
1.9.2 Magnetic separation th eory...48
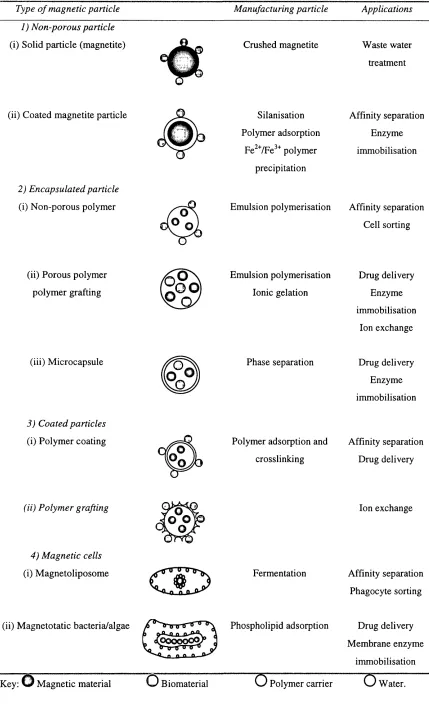
1.1 0 Ma g n e t icc a r r ie rp a r t ic l e sa n dth eirp r o c e ssa p p l ic a t io n s... 51
1.10.1 Non-porous supports...53
1.10.2 Encapsulated magnetic supports...53
1.10.3 Coated p a rtic les...54
1.10.4 Magnetic c e lls...54
1.11 USES OF m a g n e t ic SUPPORT PARTICLES IN BIOLOGICAL OPERATIONS... 5 4 1.11.1 Immunoassay...54
1.11.2 Enzyme and cell immobilisation...55
1.11.3 Affinity separation...55
1.11.4 Cell fractionation...56
1.11.5 Effiuent processing...56
1.11.6 Drug d e liv ery... 5 7 1.12 Ai m s... 57
2. M ATERIALS & A N A L Y S E S ...59
2.1 Mic r o-o r g a n i s m s... -... 59
2 .2 Cu l t u r e Me d i a...5 9 2 .3 Pr o t e i n s...5 9 2 .4 Ch e m i c a l s... 59
2.5 Pa r t ic l es e p a r a t i o n... 6 0 2 .6 An a l y s e s & As s a y s... 6 0 2.6.1 Alcohol dehydrogenase a ssa y...60
2.6.2 Amine group a ssa y...60
2.6.3 Amylase a ssa y...60
2.6.4 Cibacron Blue a ssa y...61
2.6.5 ELISA a ssa y...61
2.6.6 Glutaraldehyde detection...62
2.6.7 Iron assay...62
2.6.8 Lactate dehydrogenase assay...62
2.6.9 Lysozyme assay (Standard)...62
2.6.10 Lysozyme assay (M odified)...63
2.6.11 Malate dehydrogenase a ssa y...63
2.6.12 Polyacrylamide gel electrophoresis...63
2.6.13 Protein assay...64
M AG NETIC P A R T IC L E S... 65
3.1 In t r o d u c t io n...65
3 .2 Ex p e r im e n t a l PROCEDURE... 67
3.2.1 Preparation o f superparamagnetic iron oxide particles...67
3.2.2 Preparation o f amine terminated p articles...67
3.3 Re s u l t s a n d Di s c u s s i o n... 68
3.3 .1 Preliminary experiments...68
3.3.2 Magnetic and physical characterisation...69
3.3.3 Amine terminated p a rticle s...76
3.3.4 Physical and magnetic properties o f the amine terminated p a rticles...79
3 .4 Co n c l u s i o n... 81
4. COLLECTION OF M AGNETIC PARTICLES USING HIGH GRADIENT M AGNETIC SEPARATIO N (H G M S)... 82
4.1 In t r o d u c t io n... 82
4 .2 Ex p e r im e n t a l Pr o c e d u r e... 85
4.2.1 High Gradient Magnetic Separation (HGMS)...85
4.2.2 M atrices...86
4.2.3 Collection o f magnetic supports using HGMS...86
4 .3 Re s u l t s a n d Di s c u s s i o n... 89
4.3.1 Matrix screening and optimisation stu dies...89
4.3.2 Paramagnetic Knitmesh matrix...90
4.3.3 Ferromagnetic Knitmesh m atrix...90
4.3.4 Ferromagnetic woven p a d... 92
4.3.5 Effect o f viscosity and solid matter on particle capture using the ferromagnetic Knitmesh matrix...96
4 .4 Co n c l u s i o n...98
5. RECOVERY OF DEHYDROGENASE ENZYMES USING M AGNETIC DYE A D S O R B E N T S ... 99
5.1 In t r o d u c t io n...99
5 .2 Ex p e r im e n t a l Pr o c e d u r e...101
5.2.1 Binding studies using dye adsorbents...103
5.2.2 Recovery and elution o f dehydrogenase enzymes using dye adsorbents...103
5.2.3 Recovery o f dehydrogenases from yeast homogenate (1-20 % w /v )...104
5.2.4 Preparative scale recovery o f dehydrogenase enzymes using H G M S...104
5 .3 Re s u l t sa n d Di s c u s s i o n...106
5.3.1 Equilibrium adsorption isotherms...106
5.3.2 Binding kinetics...109
5.3.5 Recovery o f LDH in yeast homogenate...112
5.3.6 Binding kinetics in unclarified yeast homogenate...118
5.3.7 Recovery o f dehydrogenase enzymes in viscous homogenates...119
5.3.8 Purification o f dehydrogenase enzymes from yeast homogenate using H G M S...122
5.3.9 Comparison between the laboratory and preparative scale purification o f yeast dehydrogenase...129
5 .4 Co n c l u s i o n... 130
6. PREPARATION OF LYSOZYM E COATED M AGNETIC PARTICLES (L M P )... 132
6.1 In t r o d u c t io n... 132
6 .2 Ex p e r im e n t a l Pr o c e d u r e... 134
6.2.1 Adsorption studies using lysozyme...134
6.2.2 Preparation o f LM P...134
6 .3 Re s u l t sa n d d is c u s s i o n... 135
6.3.1 Preparation o f LM P...135
6.3.2 Assay developm ent...136
6.3.3 Immobilised activity o f LMP in a agitated environment...137
6.3.4 Comparison o f immobilised lysozyme activity in a stationary and agitated environment 138 6.3.5 Stability o f LM P...140
6.4 Co n c l u s i o n...141
7. RELEASE OF PERIPLASM IC a-A M Y LA SE FROM E. CO LI CELLS USING L M P ... 142
7.1 In t r o d u c t io n... 142
7 .2 EXPERIMENTAL PROCEDURE... 144
7 .2.1 Strains and plasm ids...144
7.2.2 Growth media...144
7.2.3 M icrobial cultivation...144
7.2.4 Determination o f a-am ylase location...145
7.2.5 lysozyme treatm ent...145
7.2.6 Regeneration o f L M P...147
7 .3 Re s u l t sa n dd i s c u s s i o n... 148
7.3.1 Amylase release using free lysozyme and LMP...148
7.3.2 Time dependence o f periplasm ic lysis using L M P...150
7.3.3 Effect o f agitation on periplasmic release o f a-am ylase...151
7.3.4 Effect o f lysozyme concentration on periplasm ic a-amylase release...153
7.3.5 Use ofN aC l to increase lysozyme recovery...154
7.3.6 LMP regeneration...156
7.3.7 Large scale release o f periplasmic a-amylase and recovery using H G M S...159
8.1 In t r o d u c t io n... 165
8 .2 Ex p e r im e n t a l Pr o c e d u r e... 167
8.2. ] Preparation o f lysozyme coated magnetic particles (LM P)...167
8.2.2 Binding studies...167
8.2.3 Recovery o f Fv fragments using LMP and HGMS...167
8.3 Re s u l t sa n d Di s c u s s i o n... 169
8.3.1 Binding studies using L M P...169
8.3.2 Influence o f contaminating protein on LMP binding ca p a c ity...171
8.3.3 Reuse characteristics o f L M P...7 72 8.3.4 Recovery o f Fv fragments from clarified lysate using LM P...173
8.3.5 Binding kinetics o f LMP...174
8.3.6 Purification o f Fv fragments from clarified E. coli lysate using LMP and HGM S...181
8.3.7 Comparison between laboratory and preparative scale purification o f Fv fragments ...186
8.4 Co n c l u s i o n...187
9. SUM M ARY, CONCLUSION AND FUTURE W O R K ... 188
9.1 Su m m a r y...188
9.1.1 Preparation o f magnetic adsorbents...188
9.1.2 High gradient magnetic collection...189
9.1.3 Recovery o f dehydrogenase enzymes from yeast homogenate using dye magnetic adsorbents...190
9.1.4 Preparation o f Lysozyme Magnetic Particles (LMP)...191
9.1.5 Periplasmic release o f a~amylase from E. coli using LMP...192
9.1.6 Recovery o f antibody Fv fragments from clarified E. coli lysate using LMP...194
9.1.7 Discussion on scale-up strategy...195
9 .2 Co n c l u s i o n... 196
9 .3 Fu t u r e Wo r k... 196
List o f sym bols
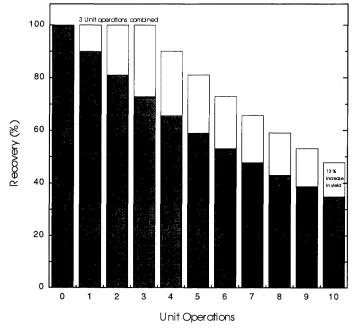
Figure 1-1 The relationship between the number o f downstream unit operations and product
recovery...15
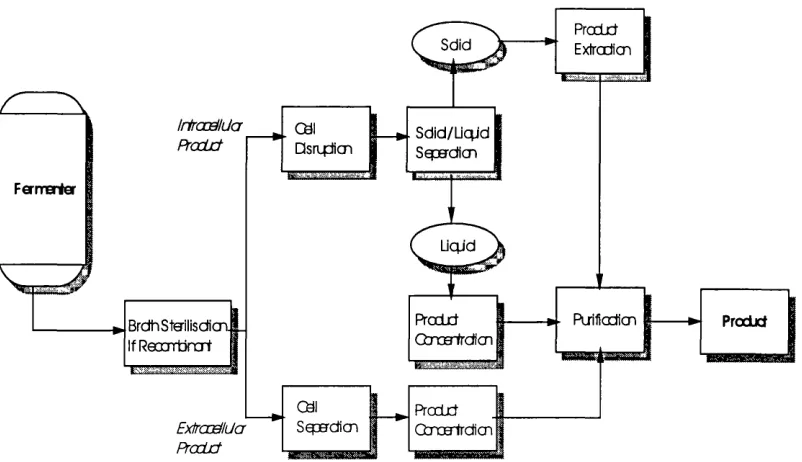
Figure 1-2 Typical unit operations in downstream processing...16
Figure 1-3 Schematic representations o f various magnetic processing operations...43
Figure 1-4 Vertical section through High Gradient magnetic Separator (HGMS) fo r fine paramagnetic materials...44
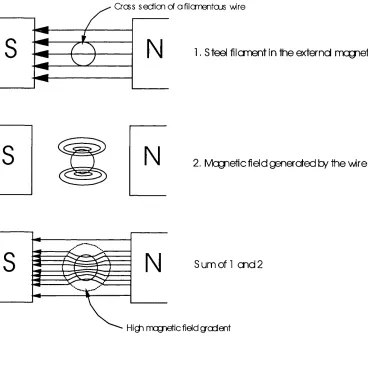
Figure 1-5 Concept o f HGMS based on a single filam en t....47
Figure 1-6 Simplified representation o f the trajectory o f a magnetic particle about a magnetised wire in the transverse configuration and the forces acting on the particle...50
Figure 3-1 Vibrating Sample Magnetometer (VSM) profiles o f precipitated iron oxide particles...70
Figure 3-2 Magnetic and physical properties o f the iron oxide particles...71
Figure 3-3 Atomic Force M icroscope (AFM) image o f iron oxide particles (Fe^'*'/Fe^'^, 1:2) deposited on a glass slide...73
Figure 3-4 X-ray diffraction profile o f magnetite/maghemite complexes...74
Figure 3-5 M ossbauer spectrums o f iron oxide particles with a Fe^'^/Fe^^ ratio o f 1:2 (sample 4)...75
Figure 3-6 Coating o f magnetic particles with 3-aminopropyltriethoxysilane (3-APTS)...77
Figure 3-7 Temperature profile ofsilane coating at a curing temperature o f 110°C....78
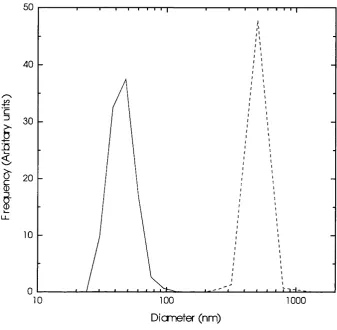
Figure 3-8 Particle size distributions before and after silane coating...80
Figure 4-1 Breakthrough curves fo r determination o f dynamic capacity...83
Figure 4-2 Side and top view o f the collection canister. (Diagram is not drawn to scale)...85
Figure 4-3 VSM profiles o f matrices used in HGMS trials...87
Figure 4-4 Equipment layout fo r HGMS experiments. (Not drawn to scale)...88
Figure 4-5 A typical breakthrough profile o f magnetic adsorbents during HGMS...89
Figure 4-6 Performance o f expanded metal and wool matrices in HGMS trials...93
Figure 4-7 Variations in yield and productivity with respect to linear flow rate fo r particle capture using paramagnetic and ferromagnetic matrices...94
Figure 4-8 Construction and orientation o f the Knitmesh and woven p a d m atrices...95
Figure 4-9 The effect o f yeast homogenate concentration on particle capture using the ferromagnetic woven p a d matrix...9 7 Figure 5-1 Scheme fo r preparation o f non-porous magnetic dye adsorbents...102
Figure 5-2 Adsorption isotherm (a) and scatchard p lot (b) binding o f LDH, MDH and ADH to magnetic dye particles...107
Figure 5-3 Batch uptake profiles o f LDH and MDH from binding buffer using magnetic dye adsorbents...109
Figure 5-4 Effect o f concentration o f dye adsorbents upon uptake o f L D H ....112
Figure 5-5 Batch uptake profiles o f LDH and MDH from yeast homogenate...118
Figure 5-6 Selective adsorption o f dehydrogenases from crude yeast homogenates using magnetic dye particles...120
Figure 5-7 Selectivity o f endogenous dehydrogenase adsorption from crude (a) unclarified and (b) centrifugally-clarified yeast homogenates...121
affinity particles and HGMS technology...124
Figure 5-9 Operation o f recycle loop...125
Figure 5-10 Analysis by SDS gel electrophoresis o f the purification o f LDH and MDH from yeast homogenate using magnetic dye adsorbents and HGMS technology...128
Figure 6-1 Isotherms fo r the adsorption o f lysozyme onto polyglutaraldehyde particles...135
Figure 6-2 Lysozyme standard curve obtained in stationary and agitated conditions...137
Figure 6-3 Variation in immobilised lysozyme activity with agitation...138
Figure 6-4 Stability o f LMP over a period o f 3 months...140
Figure 7-1 The effect o f varying lysis mixture ingredients on the titre and purity o f a-amylase released from E. coli JM107 pQR126 cells...149
Figure 7-2 Effect o f lysis time on periplasmic release and purity o f a-am ylase from E. coli cells...151
Figure 7-3 Effect o f agitation on the titre and purity o f periplasmic a-am ylase from E. coli cells. ...152
Figure 7-4 Effect o f lysozyme concentration on the release and purity o f periplasmic a-am ylase from E. coli cells...154
Figure 7-5 Effect ofN aC l on the release and purity o f periplasmic a-am ylase fo r E. coli cells...155
Figure 7-6 Periplasmic a-am ylase release from E. coli cells using regenerated LMP...158
Figure 7-7 Profdes o f amylase release after lysis using LMP and HGMS...162
Figure 8-1 Diagram o f antibody fragments...165
Figure 8-2 Isotherm fo r the adsorption o f pure Fv fragments...170
Figure 8-3 Isotherm fo r the adsorption o f pure Fv fragments in the presence ofB SA...171
Figure 8-4 Batch uptake profdes fo r the adsorption o f Fv fragments in Tris buffer and clarified E. coli lysate...175
Figure 8-5 Variation in binding capacity {Q*) with the fraction o f Fv fragments (C*/Co) remaining in the clarified E. coli lysate...176
Figure 8-6 Complete protein recovery from the lysate using cycles o f batch adsorption...177
Figure 8-7 Analysis o f Fv fragment purification by SDS gel electrophoresis...180
Figure 8-8 Profile o f Fv fragments recovery from clarified E. coli lysate using LMP and HGMS. ...183
Figure 8-9 Analyses by SDS gel electrophoresis o f the purification o f Fv fragm ents from clarified E. coli lysate using LMP and HGMS technology...185
Table 1-1 Modes o f operation o f affinity adsorption and their suitability fo r one step purification...26
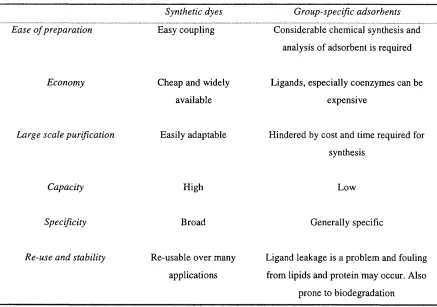
Table 1-2 Comparison o f immobilised triazine dyes with group-specific adsorbents...31
Table 1-3 Characteristics o f high gradient magnetic filters...45
Table 1-4 Comparisons o f HGMS and other effluent filtration devices...46
Table 1-5 Classifications o f the types o f magnetic materials...52
Table 3-1 Preliminary experiments to indicate fineness o f iron oxide precipitate...68
Table 3-2 Estimates o f iron oxide crystal size from BET surface area measurements...72
Table 3-3 The relationship between curing temperature and surface amine groups...79
Table 3-4 Summary o f physical and magnetic properties o f iron oxide particles before and after silane coating...80
Table 4-1 Summary o f magnetic and physical data o f the matrices used fo r the HGMS studies 86 Table 5-1 Adsorption equilibrium characteristics fo r dehydrogenase recovery using magnetic dye adsorbents...108
Table 5-2 Recovery o f LDH from dye adsorbents using NaCl and P E L...I l l Table 5-3 Recovery o f ‘a d d ed ’ LDH and endogenous MDH from a clarified and unclarified sample o f yeast homogenate using dye adsorbents...115
Table 5-4 Recovery o f dehydrogenase enzymes from yeast homogenate using magnetic dye adsorbents (2"‘^ cycle)...116
Table 5-5 Recovery o f dehydrogenase enzymes from yeast homogenate using magnetic dye adsorbents (3'^‘‘ cycle)...117
Table 5-6 Particle flushing data from purification o f yeast dehydrogenase using HGMS...126
Table 5-7 Purification table o f the recovery o f LDH and MDH from crude yeast homogenate using dye adsorbents and HGMS...127
Table 5-8 Comparison o f laboratory and preparative scale purification o f LDH and M D H ....130
Table 6-1 Immobilised activity o f LMP in a stationary and agitated environment...139
Table 7-1 Comparison o f regeneration buffers on the activity and physical state o f spent LMP 156 Table 7-2 Activity o f LMP after regeneration using sodium hydroxide and diethylamine in combination with Triton XlOO...157
Table 7-3 Summary o f release o f periplasmic a-am ylase using the standard and control buffers. .159 Table 7-4 Particle flushing data from the lysis o f E. coli cells and subsequent recovery using HGMS...163
Table 8-1 Binding param eters o f LMP fo r Fv fragm ents...170
Table 8-2 Recovery o f Fv fragments from a buffered system using LMP...173
Table 8-3 Recovery o f Fv fragments from E. coli lysate using LMP...174
Table 8-4 Purification o f Fv fragments from clarified E. coli lysate...179
Table 8-5 Particle flushing data from purification o f Fv fragments using HGMS...182
Table 8-6 Purification table o f recovery o f Fv fragments from clarified E. coli lysate using LMP and HGMS...184
Table 8-7 Comparison o f laboratory and preparative scale purification o f Fv fragm ents...187
A ... ampere
 ... angstrom (1  = 10'^^ m)
ADH... alcohol dehydrogenase
3-APTS... 3-aminopropyltriethoxysilane
BET... Bninauer, Emmett and Teller
BSA...bovine serum albumin
kDa... kilo dalton
EOT A ...ethylenedi aminetetraacetate
em u...electromagnetic unit
E. c o li...Escherichia coli Fe^"^...ferric chloride
Fe^^... ferrous chloride
g, |Xg, mg, kg...gram, 10 ^ 10'\l0^
h ... hour
HGMS... high gradient magnetic separation
L, |iL, mL... litre, 10'^, 10'^
LDH... lactate dehydrogenase
LMP...lysozyme magnetic particle
m, nm, pm, mm, cm ...metre, 10'^, 10'^, 10'^, 10’^
M, pM, mM ... molar, 10'^, 10'^
m in...minute
MDH...malate dehydrogenase
MSFB... magnetically stabilised fluidised bed
N ...newton
Oe...oestad (10,000 Oe = IT)
rpm ...revolutions per minute
PEG...polyethyleneglycol
scFV... single chain antibody particles
s... second
T ... tesla
TNBS... 2,4,6-trinitrobenzenesulphonic
U ...unit of enzyme activity
VSM... vibrating scanning magnetometry
w /v... weight / volume
1. Introduction
1.1 Research into downstream processing
Biotechnological innovations have made their mark in a number of different areas
including pharmaceuticals, biomedical, agrochemical, and food processing industries.
Whilst these innovations are mainly associated with advances in recombinant DNA and
cell culture technologies, none would have been possible without advances in protein
purification technologies. Nowhere is the need for protein purification methods as great
as the pharmaceutical industries where many of the new products are proteins such as
vaccines, blood proteins, and hormones (Boyer and Hsu, 1993).
The purity of therapeutic proteins for human or animal consumption has to be very high
in order to meet the requirements set down by the Food and Drugs Administration
(FDA). Biological molecules isolated from natural sources, or expressed from
recombinant DNA systems, must be shown to have acceptably low levels of biologically
active contaminants such as DNA, viruses, pyrogens and ‘leachates’ from the separation
media. This presents a major challenge to the process engineer and is achieved by
rigorous quality control of manufacturing practices (O’Brien, 1996). Therefore, it is not
surprising that downstream processing can represent the majority of the cost of a new
therapeutic protein. Gupta and Mattiasson (1994), estimated this to be between 50-80 %
of the total production costs.
In manufacturing a therapeutic protein there are three key issues to address: time to
market, regulatory aspects, and process economy. Manufacturers are also facing rising
costs, tougher competition and political pressure to reduce expenditure on healthcare.
As a result, many biopharmaceutical manufacturers are trying to lower the costs
associated with downstream purification processes, and to reduce the time taken to
market the product without making any compromises. Decreasing the number of
manufacturing steps to produce a purified protein can lead to a significant reduction in
running costs, capital expenditure and increase the overall yield as the product is
exposed to fewer unit operations. For example if three operations can be combined into
one, the gain in yield is over 13% (assuming that each step is 90% efficient; Figure 1-1).
Spalding (1991) stated that the ideal purification process should have between three to
six stages which are at least 90% efficient and able to purify a protein to at least 99.9%.
100
I
cn
3 Unit operations combned
1 3 %
Unit Operations
Figure 1-1 The relationship between the number o f downstream unit operations and product recovery.
If three unit operations are eliminated, then the gain in overall yield will be 13 % (assuming each purification step is 90 % efficient).
1.2 Protein purification strategy
Howell (1985) emphasised that large-scale purification processes should be designed to
minimise the number of steps while maintaining high yields, product purity, quality and
activity. The engineer needs to structure the process so that it is as simple as possible,
recovering the product of interest and carried out with the smallest number of items of
equipment. Improvements and simplifications can also be made if greater emphasis is
placed on the integration of downstream processing with upstream operations (such as
molecular biology) early on in product development. Skilful improvement of
fermentation processes through the selection of high-yielding organisms coupled with
optimum media compositions and operating conditions can lead to a 1000-fold increase
in production (Wheelwright, 1989).
1.3 Processes for downstream processing
Downstream processing is a series of steps which leads to a purified protein product.
Figure 1-2 illustrates the general stages involved in the recovery of recombinant protein.
Downstream processing of proteins may be divided into two stages, primary recovery
stages and high-resolution stages (Datar, 1986). For extracellular proteins, the primary
recovery stages involve the removal of cells from spent medium. For intracellular
proteins, the primary recovery stages include: (i) recovery of cells; (ii) disruption of cells
to release the target protein; and (iii) removal of cellular debris. This is followed by
primary purification stages that utilise techniques such as precipitation, adsorption and
liquid-liquid extraction to remove contaminants. Secondary purification steps are used
to concentrate the product using high-resolution chromatographic techniques. The final
polishing stages are used to remove pyrogens, aggregates, degradation products and to
achieve the final concentration of product (Kaul & Mattiasson, 1992). In the following
sections the various stages involved in downstream processing will be discussed in more
detail.
Prodjd Extrodicn
Inraalua Prodrt
Cël □ sn x tio n
S d id /u cp d Sqæ-dicn
Puifiodicn
P r o d D Procucf
BrdhSta'ilisdicn
IfRecrrrtHXrt GdrBTrdicn
E xtra^lU a ProcLct
Cël P rodjd 1
S d o g d ia i G tn æ rtrd iœ
I
Figure 1-2 Typical unit operations in downstream processing.
1.3.1 Cell disruption
The majority of recombinant proteins produced in cells either remains in the cytoplasm
or is secreted into the periplasm and requires cell disruption for complete release.
Traditionally either mechanical, chemical and biological disruption techniques have
been used on a laboratory scale (Kula and Shutte, 1987). Mechanical processes such as
homogenisation or bead milling are more commonly used on a pilot or industrial level
(Engler, 1985; Chisti and Moo-Young, 1986). In general, disruption may be categorised
into mechanical and non-mechanical processes.
1.3.1.1 Mechanical disruption
Disruption of cells by mechanical means results in the release of the total contents of the
cell with the target protein. On a small scale sonication can be used for cell disruption.
However, this method can lead to enzyme degradation (Coakley et ai, 1974) and is
unsuitable for large scale processing due to difficulties in providing adequate cooling
and high power input (Lilly and Dunnill, 1969). Homogenisation is more suitable for
large-scale disruption. Gram negative bacteria are easily disrupted by one or two passes
through these devices (Lee, 1989). Breakage of gram positive bacteria, high cell
concentrations or cells at their stationary phase of growth may require multiple passes or
continuous recycling of the suspension (Charm & Matteo, 1971). Bead milling is more
efficient than homogenisation at disrupting more resilient and highly filamentous
organisms (Darbyshire, 1981). Agitation at high rates provides a grinding motion, which
disrupts the cells due to the impact and shear forces. Efficiency is dependent on the
concentration of wet cells. The optimum being between 30-60 % wet cells (Bjurstrom,
1985).
Several disadvantages are associated with mechanical release methods. The processes
are energy intensive and generate heat which may require costly and efficient cooling
systems to prevent protein degradation. High release of contaminating protein leads to
low specific activities and the risk of proteolytic degradation. The release of nucleic
acids often increases the viscosity of the suspension making subsequent downstream
processing stages less efficient.
1.3.1.2 Chemical disruption
Chemical release methods are advantageous as they are able to selectively release
proteins from the periplasm. This reduces contamination from the release of nucleic
acids and debris. The outer cellular wall can be disrupted or permeabilised by a variety
of chemical treatments including antibiotics, chelating agents, chaotropes, detergents,
solvents and by alkaline lysis (Pierce, 1996). However, scale-up may prove to be more
difficult due to the large volume requirements. This can be expensive and hazardous
especially when using toxic solvents. Once used, the solvent has to be completely
removed from the process stream, particularly if the product is required for human or
animal consumption.
1.3.1.3 Physical disruption
Proteins can be released from cells by a number of physical means including
temperature induced lysis (heating or freezing) and osmotic shock (Johnson & Hecht,
1994; Neu & Heppel, 1965). Freeze-thaw methods have been successful in releasing 50-
90 % of the periplasmic protein, although, this may prove to be difficult to scale-up
(Johnson & Hecht, 1994). Thermolysis at temperatures approaching 55 °C has been
used to release periplasmic proteins in E. coli cells. However, this method may denature
proteins, activate proteases and release large amounts of lipids, all of which can affect
subsequent downstream processing (Pierce, 1996).
1.3.1.4 Biological disruption
It is possible to disrupt cell walls by using lytic agents, either foreign or host derived.
Common reagents include lysozyme which catalyses the degradation of the (3(1-4)
glycosidic bonds within the peptoglycan layer in gram negative bacteria (Neu & Heppel,
1965), or by peptides which cleave the peptide bonds that crosslink glycan chains
(Shockman & Hdlje, 1994). Lysozyme is often used in combination with EDTA (to
destabilise the outer membrane) and osmotic shock to release periplasmic proteins
(Witholt et al, 1976; Beacham, 1979). Biological disruption methods are described in
further detail in chapter 7.0.
1.3.2 Cell recovery and clarification processes
The type of organism and clarification procedure depends upon the sensitivity of
subsequent downstream processing stages to the presence of colloidal matter. Common
methods to remove solid particles include cross-flow filtration (Gabier, 1985) and
centrifugation (Axelsson, 1985). Rotary vacuum filtration is more suitable for
processing large volumes (Belter, 1985).
1.3.2.1 Centrifugation
Centrifugation allows for the recovery of whole cells or for the removal of solid matter
(e.g. organelles, particulate matter or cellular debris) from dirty liquors. On a laboratory
scale batch centrifuges are commonly used, but they can only process small volumes.
On an industrial scale, larger centrifuges such as the tubular bowl, multichamber bowl,
disc stack, scroll and basket centrifuges which have a higher processing capacity are
used (Bell et al, 1983). These devices tend to be less efficient when compared to
laboratory devices because of the lower g forces and residence times (O’Brien, 1996).
The major factor that affects centrifuge capacity and running costs is the particle size.
High viscosity streams, small particle size or a low-density difference between the
particle and surroundings all reduce the efficiency of the process, as predicted by Stokes
law:
K -— (Equation 1-1)
Where: Vs = settling velocity, d - particle diameter, Ap - density difference between the
medium and the particle, \l - dynamic viscosity of the fluid, co - angular velocity, rx -
radial distance of the particle from the axis of rotation.
A comparison between laboratory and industrial centrifuges can be made by comparing
Q/Z, where Q is the flow rate and Z is the effective settling area. Q/Z relates the
efficiency of the centrifuge to the cross sectional area of a gravity-settling tank with the
same clarifying capacity (Ambler, 1952, Trowbridge, 1962).
Q = 2m^Z (Equation 1-2)
Where:
^P ^s8
M. -— (Equation 1-3)
Where Q = volumetric flow of liquid through the centrifuge, Us - terminal velocity of
the solid particle settling under gravity through the liquid, S - sigma value of the
centrifuge, g - gravitational acceleration.
Centrifugation suffers from inherent scale-up problems associated with designing
equipment capable of handling large quantities of liquid suspension at high centrifugal
forces. The design of centrifuges with high rotational speed ensures shorter residence
times but limits their use to cells capable of handling high shear forces. Also the heat
generated, aerosols, noise, and high cost may reduce its appeal (O’Brien, 1996).
1.3.2.2 Filtration
Filtration separates components on the basis of size rather than density and involves
physically retaining particles behind a filter. Common devices in use include
microfiltration and ultrafiltration. Microfiltration is used for clarification of
fermentation broths and cell homogenates while ultrafiltration is used for concentration
of dilute protein solutions. Both devices are prone to blockages due to the build up of
fouling layers comprising of cellular materials (Ogez et al, 1989). Filtration can be
divided into two subcategories: dead-end filtration where the feed stream flows
perpendicular to the filter surface, and cross flow (or tangential) filtration where the feed
stream flows parallel to the filter, and the fluid diffuses across.
1 .3 .2 .2 .1 D e a d - e n d filtration
Rotary vacuum drum filter and plate and frame filters are the most common types in use.
The rotary drum filter comprises of a drum covered with a filter medium. The filtrate is
drawn through by an internal vacuum and is covered by solids as it rotates. A knife or
scraper then removes the solids. The main problem with this type of system is that it
cannot be sterilised and is difficult to operate aseptically. Filter press operates on a batch
mode where the liquor flow is continuous, but requires constant cleaning due to the
rapid accumulation of solids. They often require long preparation times and have small
solid holding capacities, which reduces the efficiency of the process. Filter aids such as
diatomaceous earth have been used to increase the filtration efficiency by preventing
blockages occurring in the filter (Martin, 1993).
1 .3 .2 .2 .2 C r o s s -flo w m icrofiltration
Cross-flow microfiltration is a process where the fluid containing the product flows in
parallel to the membrane surface (with pore sizes varying from 0.1-0.2 |L im ). A pressure
drop drives the medium through the membrane. Solid particles that are unable to pass
through the membrane are driven away by incoming fluid preventing filter blockages
associated with conventional dead-end filtration. In practice the membrane still fouls
resulting in a decline in flux and protein transmission. Either backflushing or reverse
flow can restrict fouling effects (Kim & Chang, 1991).
1.3.3 Primary separation operations
Before secondary purification techniques such as chromatography can be employed it is
necessary to reduce the process volume to more manageable quantities and to eliminate
some of the contamination. A variety of techniques can be used for this purpose, and are
summarised in the following sub-sections.
1.3.3.1 Ultrafiltration and diaflltration
Ultrafiltration is a separation process using membranes, with pore sizes varying from 2-
50 nm. The pores are also small enough to allow easy passage of proteins, salt ions,
buffers and water. Membranes are classified by their molecular weight cut-off range (5-
500 kDa). Fouling problems occur due to the settling of proteins and polysaccharides on
the membrane. This forms a gel like layer that reduces transmission. At scale this can be
controlled by a cross-flow system. A variation of ultrafiltration is diafiltration, which
involves an exchange of buffers only. Protein flocculation, non-specific binding to
filters and dénaturation can all lead to reduced efficiency.
1.3.3.2 Precipitation
Precipitation is a method of concentrating and purifying proteins. Precipitation occurs
when the solubility of the protein is reduced to a critical value. This can be achieved by
salting out, salting in, by adding organic solvents or by adjusting the pH or temperature
(Bell gf a/., 1983).
1.3.3.3 Extraction
It is possible to purify or concentrate proteins or to separate proteins from cellular debris
by using aqueous two phase partitioning. Extraction exploits the varying solubility of
proteins between two non-miscible water based phases by using either PEG with
dextran or salt. These systems tend to be gentler and do not denature proteins in the
same way as non-polar solvents, because of the low interfacial surface tensions
(Andrews and Asenjo, 1987).
1.3.4 Secondary purification
Secondary purification is the final stage of downstream processing and involves
recovery of the protein from the crude biological liquor using adsorptive recovery
techniques, before the final polishing stages.
Chromatographic methods are one of the most popular secondary purification methods
in downstream processing. Together with membrane separations, they account for 90 %
of the $2 billion global market for downstream processing equipment (Spalding, 1991).
Chromatographic systems exploit some facet of the target proteins unique
physiochemical property such as size (gel filtration), charge (ion exchange),
hydrophobicity or biospecific affinity. These techniques are summarised in the
following sub-sections.
1.3.4.1 Ion exchange chromatography
Ion exchange is the most popular chromatographic method, and has been reported to be
used in up to 75 % of all laboratory protein purifications (Bonnerjea et al, 1986).
Proteins bind to the surface of the ion-exchange resin by displacing counter ions located
on the surface (e.g. metal ions or anions). Elution can be achieved in an aqueous
solution of higher ionic strength, displacement with another protein/multivalent polymer
or by changing the charge on the protein (Torres et al, 1984). Due to their simplicity of
operation, they can easily process and concentrate large volumes of clarified lysate.
Practical processes, small or large, require adsorbents that are sufficiently hydrophilic to
prevent protein dénaturation, have high loading capacities, fast binding kinetics and
resist compression to allow high throughputs. They can be regenerated for repeated use
with little or no loss in capacity (Sofer & Nystrdm, 1989).
1.3.4.2 Hydrophobic interaction chromatography
Hydrophobic interaction chromatography (HIC) and reverse phase chromatography
(RPC) separation methods are based upon the attraction between the hydrophobic
regions of the target molecule and the hydrophobic matrix. In HIC the sample is applied
under conditions of high salt concentration and eluted under conditions of low salt
concentration. RPC differs in that the matrix is highly hydrophobic (Fausnaugh et al,
1984). The sample is applied in an aqueous buffer and has to be eluted in an organic
buffer. The matrix for both of these systems is constructed of a hydrophobic polymer
such as styrene cross-linked with divinulbenzene, or alternatively it can be made from a
hydrophilic polymer such as agarose and made hydrophobic by attaching hydrocarbon
chains.
Generally, HIC columns are not as efficient as either ion exchange or affinity
chromatography. The elution conditions also presents a problem as they tend to be fairly
harsh and may increase the likelihood of protein dénaturation (Osterman, 1986).
However, HIC can be used for a wide range of purifications and is suitable for purifying
unstable proteins as it may be performed in the presence of ammonium sulphate, which
is known to stabilise proteins.
1.3.4.3 Affinity chromatography
Affinity chromatography relies on the specific interaction between the affinity adsorbent
and particular proteins. This allows purification from a contaminating feed of over a
thousand-fold within a single step, and reduces processing times and costs over less
selective procedures. Packed-bed affinity chromatography are typically composed of a
porous support constructed of agarose and linked to the affinity ligand via a spacer arm.
The choice of ligand depends upon the operational requirements and can be general or
high affinity and bio- or pseudo-specific. Ligands such as proteins and antibodies are
highly specific but unable to withstand high temperatures or harsh elution conditions.
Also, binding between the adsorbent and species may be too tight making elution
difficult (Scopes, 1994). Synthetic ligands such as dyes or metal chelates are less
specific but more durable and less susceptible to dénaturation (Narayanan, 1994).
Affinity separations and ligands are discussed in sections 1.4 and 1.5 respectively.
There are a number of affinity systems that are not based on chromatographic
technology. Affinity ligands have been immobilised on the surface of membranes to
combine specificity with physical separation (Kaul and Mattiasson, 1992). With this
type of system fouling may be a problem due to physical entrapment of solid debris. A
combination of affinity membrane system and cross-flow filtration has been used to
create an affinity cross-flow filtration system (Labrou and Clonis, 1994). Affinity
precipitation is a method of improving the selectivity of precipitation. The idea is to
make complexes too large to be soluble (Van Dam et al, 1989) and to induce
precipitation of the affinity complex by alteration of a group not involved in affinity
interaction (Kaul and Mattiason, 1992). Other variation such as perfusion affinity
chromatography, affinity repulsion chromatography and affinity centrifugal
chromatography also exist (Labrou and Clonis, 1994). Each one differs in purifying
ability, economy, processing ability and operational capacity.
1.3.4.4 Gel filtration chromatography
Separation of proteins is on the basis of size and shape. Small molecules are able to
move through the pores of the adsorbent and will have a larger space in which to diffuse
through the column. Thus, molecules are separated in space and time depending on their
physical size (Fischer, 1980). By varying the degree of cross-linking, gels of varying
porosities can be produced which are then able to recover proteins of different molecular
sizes. Gel filtration chromatography has also been used for buffer exchange, desalting,
separation of product from contaminants of various sizes and for molecular weight
determinations. However, this technique is not suitable for the recovery of recombinant
proteins from fermentation broths, where the target molecule is present in low
concentrations. Load volumes must not exceed 10 %, which makes large-scale use
impractical due to the sheer volume of liquor.
1.4 Single step purification using affinity separation
A traditional purification process involves a number of unit operations, which
progressively enriches the product by reducing the number of contaminants. These unit
operations can be poorly selective, harsh, complex and labour intensive all of which is
reflected in the high operating costs and low product yields. As a consequence, demand
exists for a one step purification system that is able to selectively adsorb the target
protein directly from crude feedstocks containing solid fouling matter, whilst being
stable and reasonably affordable. Jones (1991) compared a typical purification method
involving precipitation, ion exchange, dialysis, gel filtration, hydrophobic interaction
and three ion exchange polishing steps with a single affinity chromatography
purification. The yield and purification of the single affinity chromatography step was
found to be significantly greater than the multistep purification.
Affinity adsorption is probably the only technique capable of performing an
economically viable one step purification on a manufacturing level. In order to
maximise purification it is best to use the technique as early as possible in downstream
processing. Therefore, the challenge is to perform affinity separation in the presence of
solids and fouling components such as, cells, particulate matter, lipids and cellular
debris found in early stage liquors.
Affinity separation can take place in a number of ways. The choice depends on the mode
of operation (batch or continuous), economics of the process and the nature of the
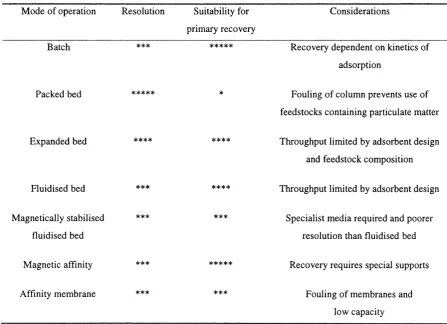
feedstock. Table 1-1 illustrates the variety of modes of operation of affinity adsorption
and gives an indication of their suitability for use at large scale and applicability as a
method for direct recovery or one step.
Table 1-1 Modes o f operation o f affinity adsorption and their suitability fo r one step purification.
M ode o f operation Resolution Suitability for
primary recovery
Considerations
Batch
Packed bed
Expanded bed
Fluidised bed ***
M agnetically stabilised ***
fluidised bed
M agnetic affinity ***
Affinity membrane ***
Recovery dependent on kinetics o f
adsorption
Fouling o f column prevents use o f
feedstocks containing particulate matter
Throughput limited by adsorbent design
and feedstock com position
Throughput limited by adsorbent design
Specialist media required and poorer
resolution than fluidised bed
Recovery requires special supports
Fouling o f membranes and
low capacity
1.4.1 Batch adsorption
Probably, the simplest approach is to use batch adsorption (Chase 1988). The affinity
supports are added to the feed stream and contacted in a stirred vessel. Following
adsorption the supports are recovered and packed into a column and the bound species
are eluted. In order to obtain good yields (80-90 %) the partition coefficient (fraction of
soluble protein adsorbed at any one time) needs to be greater than 0.98 (Scopes, 1988).
In such cases, batch adsorption holds great advantages over other separation techniques.
A potential problem that deters the widespread use of batch separation techniques is
associated with the recovery of loaded adsorbent from the suspension. Centrifugation
and filtration are commonly used. However, a large size or density difference must exist
between adsorbent and suspended solids to ensure clean recovery. Recently the use of
magnetic collection technology has shown considerable promise and will be discussed
in section 1.9.
1.4.2 Packed bed adsorption
In packed bed adsorption the liquor is applied to a column containing affinity supports.
Because of the high density of adsorbents there are numerous chances of the protein
interacting with the ligand. Resolution is therefore excellent explaining the wide spread
use in a variety of applications (Kaul and Mattisson, 1992).
A significant drawback in the use of these columns is the susceptibility to foul and block
from processing liquors containing debris, particulate matter, lipids and various other
suspended solids. Furthermore, In order to provide a large surface area for protein
capture, the adsorbents used are porous, which are easily fouled leading to potential
blockages at the inlet. This increases back pressure, which can damage the adsorbent
and limit throughput. For this reason packed beds are rarely used in processing ‘dirty’
feedstreams encountered in the early stages of downstream processing. Clarification by
centrifugation or filtration alleviates the problem but increases costs and leads to a
reduction in yield.
1.4.3 Fluidised bed adsorption
Passing a liquid stream up through a packed bed with sufficient velocity so that the
particles are suspended in the fluid stream forms a fluidised bed. The design of the
adsorbent is critical and has been the focus of much research (Bums and Lyddiatt,
1995). Typically densified particles are used to increase the terminal velocity (point at
which the adsorbents are transported out of the column) allowing high throughputs to be
achieved. To date, densified cellulose (Gilchrist and Lyddiatt, 1995), densified agarose
(Chang and Chase, 1994) and perflurocarbon affinity emulsions have all been used with
varying degrees of success.
The main advantage of a fluidised bed is its ability to handle feedstocks containing
particulate matter and other fouling components, and thus is suitable for the early stages
in downstream processing. The fluidised bed allows passage of solid components,
provided the terminal velocity of the adsorbent is greater than that of the solid matter
(Draeger and Chase, 1991). Higher throughput is also possible, given that the pressure
drop across the bed is lower than an equivalent packed bed column, which leads to
economic savings. Disadvantages are associated with the poor resolution as the contact
between adsorbent and feedstream is analogous to batch adsorption rather than a packed
bed (Sadana and Raju, 1990). Large amounts of solvent are also required to create the
right mixture for fluidisation, and excessive dilution may occur during elution unless the
flow is reversed and desorption carried out as a packed bed.
1.4.4 Expanded bed adsorption
A disadvantage associated with fluidised beds is that back mixing reduces the efficiency
of the separation. An improvement can be made if the environment is more similar to a
packed bed where the adsorbents are stationary and movement is plug flow. The most
common method to stabilise a bed is to use a lower flowrate until the particles are
fluidised but gross movement within the bed is minimised, the resulting bed is said to be
stabilised and is termed an expanded bed. The operation is carried out in a column
similar to a conventional packed bed column. The bottom end plate is designed to
ensure that flow distribution through the bed is uniform thus eliminating channelling
and other flow irregularities which destabilise the bed (DeLuca et al, 1994). The top
plate needs to be movable in order to expand during start up and contract during
shutdown (Chase, 1994). Other methods of stabilising the bed are by generating a
uniform magnetic field to create a magnetically stabilised fluidised bed; details are given
in a later section (1.9.1.5).
If the bed is expanded beyond twice the settled bed height, then the separation efficiency
of adsorption decreases. The viscosity of feedstock, presence of cellular debris, lipids
and other suspended solids may also affect the bed height at a given flow rate (DeLuca
et al, 1994). A change in condition of the feedstream also requires a period of time
before the bed stabilises, thus productivity and cycle times will be affected (Thommes et
al, 1994).
1.4.5 Magnetic separation
The use of magnetic separation technology for one step purification will be discussed in
section 1.9.
1.5 Affinity matrices
Affinity ligands are usually immobilised to a solid matrix via one or more covalent
bonds. A typical matrix for affinity chromatography for proteins is hydrophilic but
insoluble in water, chemically modifiable to allow attachment of ligands, microporous
but rigid, resistant to micro-organisms and possess a large surface area for protein
capture (O’Brien, 1996).
Suitable support matrices for affinity chromatography tend to be macroporous beaded
particles bearing free hydroxyl groups for the attachment of ligands. Such supports have
been made from natural polymers (e.g. agarose, dextran and cellulose), synthetic
polymers (e.g. perfluorocarbons, plastics and latex), inorganic compounds (e.g. silica
and glass) and composite materials (e.g. silica-polysaccharides and polyacrylamide-
agarose).
1.5.1 Choice of affinity ligand
Attributes to consider when choosing a ligand for protein purification are specificity,
stability, reversibility, size and affinity (O’Brien, 1996). Affinity ligands may be divided
into two categories: high affinity ligands with dissociation constant (kd) values ranging
from 10'^ to 10'^^ M, and general affinity ligands with kd values of ICf^ to 10'^ M
(Labrou and Clonis, 1994). Affinity ligands can also be classified as biospecific or
pseudo specific. Biospecific ligands are biological in nature and bind specific proteins
for which they have a binding site. Pseudo specific ligands may bind other proteins in
addition to specific proteins.
1.5.1.1 High affinity ligands.
Antibodies are a class of specific ligands that are able to distinguish between very
similar antigens. They are resistant to proteolytic attack and are cleaved quite selectively
by a limited number of enzymes (Hill et al, 1989). High costs, low capacity upon
immobilisation, ligand leaching, poor selectivity for closely related molecules, and
excessively strong binding for their antigens are some of the difficulties which arise
from using antibodies (Lowe et al, 1990). Many of these problems can be circumvented
by using ‘pseudo-’ or ‘biomimetic’ ligands in place of their natural ligand for
chromatography (see sections 1.6.2 and 1.7 for further details).
Other forms of highly specific ligands include receptor and avidin/streptavidin-biotin
complexes (streptavidin is the bacterial analogue to avidin). Receptors and receptor-
binding substances are highly specific affinity systems for isolating receptor-binding