61
UNDERSTANDING QUALITY OF WINE PRODUCTS USING
SUPPORT VECTOR MACHINE IN DATA MINING
Sandeep Bhattacharjee
Assistant Professor, Amity Business School, Amity University, Kolkata, India. Email: [email protected]
Manodip Ray Chaudhuri
PhD, Associate Professor III, Amity Business School, Amity University, Kolkata, India. Email: [email protected]
ABSTRACT
The wine market is related with human civilization since a long period of time and the volumes of trade exits between different individuals, groups or organization since earliest know history. In this paper we have used two data mining techniques for classification. i.e support vector machine and Naïve Bayes classifier to understand the various factors affecting quality of wine trade such as fixed acidity , volatile acidity, citric acid, residual sugar, chlorides, free sulfur dioxide, total sulfur dioxide, density , pH, sulphates, alcohol and one output variable (based on sensory data) quality (score between 0 and 10). We have tried to compare the results of these classification techniques and also draw inferences for future applications in this trade. The data has been drawn from Center for Machine Learning and Intelligent Systems (UCI Machine Learning).
Keywords: Red wine, White wine, alcohol, density, Support Vector machine, Naïve Bayes
classifier
1.
INTRODUCTION
1.1 HISTORY OF WINE
Wine is one of the foundations of Western Civilization. The story of wine is that of medicine, religion, war, discovery, science and dream. Wine and beer are both very ancient alcoholic beverages [1,2]. But wine is considered special. It can be produced only once a year, in the fall, when the grapes are mature. Beer can be brewed more or less anytime. Further, if the must have enough sugar, natural fermentation produces wine that contains 12 to 14%alcohol, that is almost three or four times more than beer. Generally, Wine gives people a buzz. It is considered as a magical beverage, associated with gods and religious occasions. For more than thousands of years (until the Arabs invented distillation), wine was not just the most potent beverage but also the most powerful antiseptic available. In terms of trade in ancient times,Viticulture most likely spread through the trade of wine, vine cuttings, wine jars, and even resin from the Terebinth tree[11]. The latter was used to coat the inside of wine jars and amphorae.
62
the presence of tartaric acid and its salt, calcium tartrate. Tartaric acid is the most important acid of grapes and occurs obviously only in wine.
Wine was an integral part of everyday life since the earliest days of Rome. Wines, viticulture, varietals, pruning, aging and other wine-related issues have been critically discussed by Horace, Pliny the Elder, Virgil, Cato, and many others. At the 1st century BC, wine taverns were common in cities.
The general poverty that followed World War I was disastrous for wine industry that had not yet fully recovered from two great natural disasters: mildew and phylloxera. In 1917, the Russian Revolution began, shutting off the profitable Russian market. The general poverty and despair that naturally followed the end of World War I resulted in widespread alcoholism. Governments everywhere around that time started pushing prohibition. The Finnish Diet forbaded the import of alcoholic beverages in 1910.Several northern European countries heavily taxed alcohol and restricted its sale to state-run stores.
The first known mention of grape-based wines in India was from the late 4th-century BC writings of Chanakya the chief minister of Emperor Chandragupta Maurya. In his writings, Chanakya condemned the use of alcohol while advising the emperor and his court's frequent indulgence of a style of wine known as
madhu[1].
1.2 Wine Components and Wine Quality
1. Fixed acidityAcids not only educe sour taste, but they also modify the perception of other taste and mouth feel sensations. This is particularly noticeable in a diminished perception of sweetness demonstrated in a recent study of sourness-sweetness interactions in water, wine and alcohol mixture (Zamora et al. 2006). In particular, Zamora and others (2006) observed during experiments, a suppressive effect of tartaric acid (solutions adjusted to pH 3.0, 3.4 and 3.8) on the perceived sweetness of fructose.
2. Volatile acidity
Ethanol, a major component of the wine matrix has been observed to decrease the partition coefficient of various classes of volatile compounds by increasing the solubility of volatile compounds in model wine systems. [2,3,5,16]
3. Citric acid
Significant non-volatile, fixed acids in wine include tartaric, malic, citric and succinic acids. They are mostly produced during photosynthesis, growth and ripening of grapes. Titratable acidity (TA) in grapes usually ranges from 5 to 16 g/L whereas in wine, lower values are observed at about 5 to 7 g/L range (Zoecklein et al. 1995).The actual sour taste of a wine depends on the absolute and relative amounts of the various acids, the proportion of acids present in undissociated form or as acid salts, factors that affect the pH of the wine, the sugar and ethanol concentrations. At the same level of acidity, apparent sourness of the common wine acids proceeds in the following order as follows: malic >tartaric>citric>lactic (Amerine et al. 1965, Fischer and Noble 1994).
4. Residual sugar
63
introduced at the time of crushing, pressing and during fermentation thereby increasing the amounts presented for perception in the wine (Lund and Bohlmann 2006). Volatile compounds connected with varietal aroma of grapes are comprised of terpenes, norisoprenoids, pyrazines, and carbonyl compounds.
5. Chlorides
The level of Chloride and sodium ions in wines basically depends on the geographic, geologic and climatic conditions of vine culture. the content of these elements is increased in wines coming from vineyards which are near the sea coast, which have brackish sub—soil or which have arid ground irrigated with salt water and the molar ratio cf Cl/Na+ therefore varies appreciably and can even have a value close to one (1) which could mean the addition of salt (NaCl) to the wine. When wine contains surplus sodium (excess sodium is equal to the content of sodium ions less the content of chloride ions expressed as sodium), it is generally less than 60 mg/L, a limit which may be exceeded in exceptional cases.[10]
6. Free sulfur dioxide (FSO2)
(Free sulfur dioxide) is that segment of sulfur dioxide (SO2) that is not bound to the sulfur dioxide binding
compounds that are present in grape juice and wine. A small amount of SO2 is produced in nature as a byproduct of fermentation, but most of the SO2 has been supplemented by the winemaker.
FSO2= SO2 + HSO3 + SO3 (molecular) (bisulfate) (sulfite)
(Source: http://www.santarosa.edu/~jhenderson/Sulfur%20Dioxide.pdf)11
7. Total sulfur dioxide
During white wine production, it is supplemented at almost every stage of the process, and is more or less necessary after malolactic fermentation is complete. It is used to a much lesser extent during red wine production, but is still a essential component in many production techniques. The most important method of action for Sulfur Dioxide is as an anti-microbial agent. It controls the growth of harmful yeast and bacterial growth in the wine. However, the “good” yeasts used in the winemaking process have biologically developed a kind of resistance to SO2 over the years, allowing them both to live in harmony
with each other. This gives the “good” yeasts a competitive advantage over the harmful yeasts during the fermentation process. Another significant role of Sulfur Dioxide lies in its anti-oxidant properties. This protects wine against browning and protects the fruit-like qualities of the wine. SO2 can also bind with a
molecule called acetaldehyde. When SO2 reacts with acetaldehyde, they tie together, producing a
64
Figure 1. Sulfur dioxide in wines.
(Source: http://www.santarosa.edu/~jhenderson/Sulfur%20Dioxide.pdf) 11
8. Density
Density in wines is the concentration of ethanol in wines. The density of wine is close to that of water, dry wine is less, and sweet wine is higher. Water has a known density of 1.000 Kg/L.Ethanol has a density of 0.789 Kg/L.Sugar has a density of 1.587 Kg/L. So wine with 13% alcohol by volume and 0.5% sugar by volume has a density of 0.13*789 + 0.005*1587 + 0.865*1000 = 975.5 Kg/L which is considered good.[8]
9. pH (phenolic compounds)
The phenolic compounds are key non-volatile components in wines, which are widely known as an essential component of wine quality. They endow wine with color (Somers 1971, Somers and Evans 1986), astringency (Landon et al. 2008) and bitterness (Fischer and Noble 1994) to wine. The phenolic composition of the finished wines actually depends on the grape and winemaking practices. Polyphenols are unbalanced compounds, with their reactions beginning as soon as the grape is crushed or pressed, ongoing throughout winemaking and aging. These reactions may involve communication or binding with aroma compounds, thus affecting aroma release and perception (Clarke and Bakker 2004). According to (Margalit 2004; Peynaud 1984).White wines are fundamentally composed of phenols found in flesh of the grapes such as gallic acid, hydroxynammic acid esters, catechin, epicatechin, gallocatechin gallate, procyanidin and catechin gallate. The content varies and usually found in few mg/L units. On the other hand, red wines are mainly possessed of several closely related chemical groups: flavonol-3 group (catechin), flavane(3,4)diol group (leucocyanidin), flavonol-3 (quercetin), anthocyanins and tannins, in accumulation to those phenolic compounds found in white wines (Margalit 2004; Peynaud(1984).
10. Sulphates
Sulfites are a preservative to wine. Wineries have been using sulfur for a long time, since the Roman times. Wine-makers, in the Roman days would actually burn candles made of sulfur in empty wine containers. These were called Amphora. Sulfur started to be used in winemaking in the early 1900′s in order to stop bacteria and other yeasts from growing. [6]
11. Alcohol
In chemistry, an alcohol is an organic compound in which the hydroxyl functional group (-O H) is attached to a carbon atom. In practice, this carbon center should be saturated, having single bonds to three other atoms [
13].
Alcohol by volume (abbreviated as ABV, abv, or alc/vol) is a standard measurement of how much alcohol (ethanol) is enclosed in an alcoholic beverage (expressed as a percentage of total volume).During the production of wine and beer, yeast is added to a sugary solution. During fermentation, the yeast organisms practically consume the sugars and produces alcohol. Technically, the density of sugar in water is greater than the density of alcohol in water. A hydrometer is used to measure the change in specific gravity (SG) of the solution before and after fermentation. The volume of alcohol in the solution can then be calculated. Both red and white wine are found normally between 11% and 13% proof. Standard servings of beer, wine and distilled spirits each contain .06 oz of absolute or pure alcohol [7].65
The composition of wine is one of the key elements determining wine quality. The nature of the wine matrix actually affects the concentration of various odorants in the headspace. These effect the aroma and flavor of wine. Ethanol, the most abundant volatile compound has been shown to decrease the partition coefficient of various classes of volatile compounds in model wine systems [17](Whiton and Zoecklein 2000, Hartmann et al. 2002).[5] The suppression effect of ethanol on aroma corresponds to the increase in odor detection limit in wines in the presence of ethanol (Grosch 2001). This cumulatively effects the contribution of aroma volatiles towards building the overall characteristic of wine aroma, smell and perception. It also enhances the overall fruity and flowery intensity of wine as a whole (Escudero et al. 2007, Guth 1998).
It has also been witnessed that the phenolic compounds also affect the release of aroma compounds in wine to some degree. Jung & Ebeler (2003) evaluated the effect of catechin on flavor volatility. Their study revealed a significant reduction in the ion response for hexanal and ethylhexanoate when compared to water but not for heptanone. The addition of tannin was found to have less effect on perceived aroma in Cabernet Sauvignon and Chardonnay wines although headspace analysis revealed reduction in odorant volatility (Aronson and Ebeler 2004). It has also been seen that the perception of fruity, citrus, strawberry, and floral aromas are high in wines with higher polyphenol content (Goldner et al. 2011).
3.
RESEARCH OBJECTIVES
The research objectives in this study are:
1.To understand the various factors which are responsible for determining the quality of red and white wine samples.
2.To compare such factors and identify the prominent factors among them.
3.To identify the impact of classification techniques on data points available in both red and white wine samples.
4.To measure the accuracy of classification techniques in both red and white wine samples. 5.To identify the better classifier among Support Vector Machine and naïve bayes classifier. 6.To identify the prospects of application of support vector machine in determining wine quality.
4.
ASSUMPTION/HYPOTHESIS
The current research paper has been evaluated on the basis of two set of assumptions: A.) Regarding Quality of Wine
1. Ha0: Quality of red wine is dependent upon the alcohol content of the wine.
2. Ha1: Quality of red wine is not dependent upon the alcohol content of the wine.
B.) Regarding Accuracy metric of Classification technique.
Hb0: Higher amount of accuracy is present when support vector machine is used for classification of wine
data points in red and white wine samples.
Hb1: Higher amount of accuracy is not present when support vector machine is used for classification of
wine data points in red and white wine samples.
5.
RESEARCH METHODOLOGY
66
6.
DATA COLLECTION
The relevant data has been collected from different websites available over internet and other reliable sources. The data is based on 11 Input variables (based on physicochemical tests): fixed acidity , volatile acidity, citric acid, residual sugar, chlorides, free sulfur dioxide, total sulfur dioxide, density , pH, sulphates, alcohol and one output variable (based on sensory data) quality (score between 0 and 10). In this research, we have considered two datasets The two datasets are related to red and white variants of the Portuguese "Vinho Verde" wine [4](Source: http://www.vinhoverde.pt/en/) the reference taken from [Cortez et al., 2009].( www3.dsi.uminho.pt/pcortez/wine/). Due to privacy and logistic issues, only physicochemical (inputs) and sensory (the output) variables are used. (e.g. there is no data about grape types, wine brand, wine selling price, etc.).
7.
DATA ANALYSIS:
Two sample sets of wine were used i.e one contained 1599 samples of red wine and the other contained 4898 White Wine samples. These samples based datasets were tested using statistical software STATISTICA 7.
7.1 DESCRIPTIVE STATISTICS
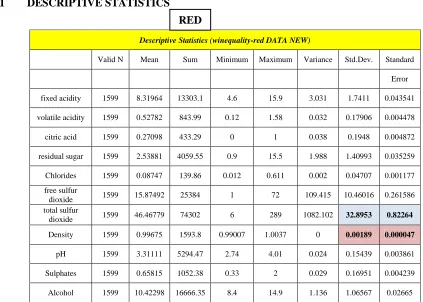
RED
Descriptive Statistics (winequality-red DATA NEW)
Valid N Mean Sum Minimum Maximum Variance Std.Dev. Standard
Error
fixed acidity 1599 8.31964 13303.1 4.6 15.9 3.031 1.7411 0.043541
volatile acidity 1599 0.52782 843.99 0.12 1.58 0.032 0.17906 0.004478
citric acid 1599 0.27098 433.29 0 1 0.038 0.1948 0.004872
residual sugar 1599 2.53881 4059.55 0.9 15.5 1.988 1.40993 0.035259
Chlorides 1599 0.08747 139.86 0.012 0.611 0.002 0.04707 0.001177
free sulfur
dioxide 1599 15.87492 25384 1 72 109.415 10.46016 0.261586
total sulfur
dioxide 1599 46.46779 74302 6 289 1082.102 32.8953 0.82264
Density 1599 0.99675 1593.8 0.99007 1.0037 0 0.00189 0.000047
pH 1599 3.31111 5294.47 2.74 4.01 0.024 0.15439 0.003861
Sulphates 1599 0.65815 1052.38 0.33 2 0.029 0.16951 0.004239
Alcohol 1599 10.42298 16666.35 8.4 14.9 1.136 1.06567 0.02665
67
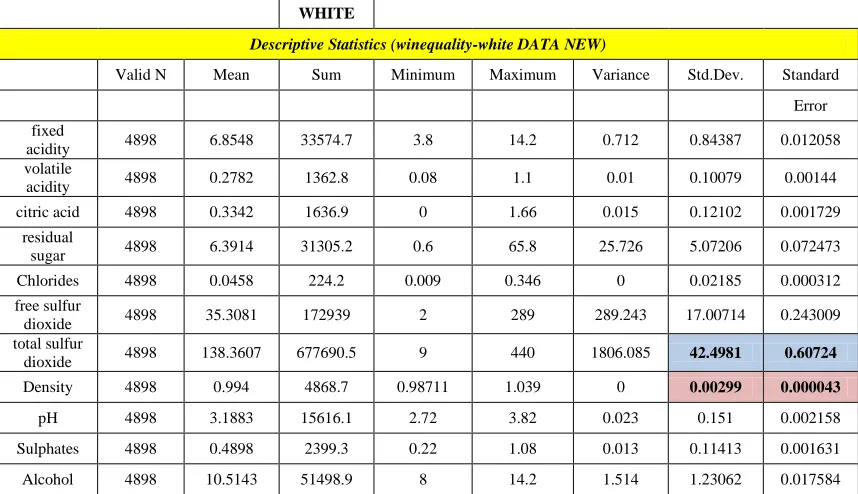
WHITE
Descriptive Statistics (winequality-white DATA NEW)
Valid N Mean Sum Minimum Maximum Variance Std.Dev. Standard
Error
fixed
acidity 4898 6.8548 33574.7 3.8 14.2 0.712 0.84387 0.012058
volatile
acidity 4898 0.2782 1362.8 0.08 1.1 0.01 0.10079 0.00144
citric acid 4898 0.3342 1636.9 0 1.66 0.015 0.12102 0.001729
residual
sugar 4898 6.3914 31305.2 0.6 65.8 25.726 5.07206 0.072473
Chlorides 4898 0.0458 224.2 0.009 0.346 0 0.02185 0.000312
free sulfur
dioxide 4898 35.3081 172939 2 289 289.243 17.00714 0.243009
total sulfur
dioxide 4898 138.3607 677690.5 9 440 1806.085 42.4981 0.60724
Density 4898 0.994 4868.7 0.98711 1.039 0 0.00299 0.000043
pH 4898 3.1883 15616.1 2.72 3.82 0.023 0.151 0.002158
Sulphates 4898 0.4898 2399.3 0.22 1.08 0.013 0.11413 0.001631
Alcohol 4898 10.5143 51498.9 8 14.2 1.514 1.23062 0.017584
Table 2 Descriptive statistics of 4898 Red Wine samples
From table 1 & 2, two different samples of red and white wine were taken with variables such as fixed acidity, volatile acidity, citric acid, residual sugar, chlorides, free sulfur dioxide, total sulfur dioxide, density, pH, sulphates, alcohol to test the quality of wine being used (score between 0 and 10).It was intresting to note that in both the samples, minimum standard deviation and standard error was observed [ Red wine sample ,density( 0.00189 & 0.000047), White wine sample ,density(0.00299 & 0.000043)].On the other hand maximum standard deviation and standard error was observed [ Red wine sample , total sulfur dioxide (32.89532 & 0.82264), White wine sample , total sulfur dioxide (42.49806 &0.607239)].This shows that density factor is more stable in all samples collectively (1599+4898=6497 samples.)
68
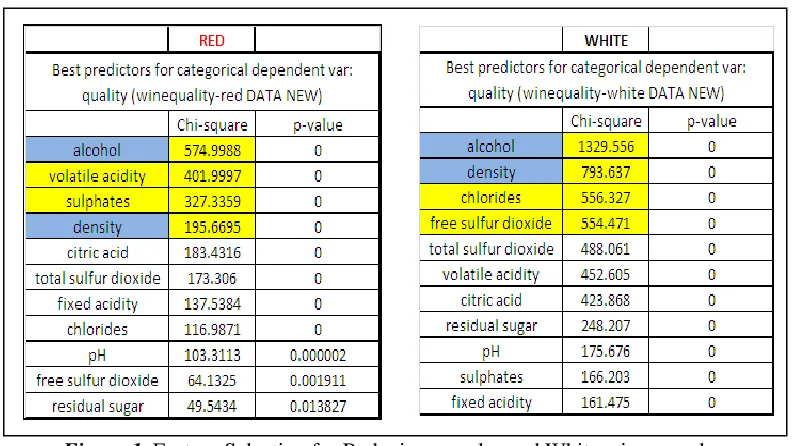
Figure 1. Feature Selection for Red wine samples and White wine samples.
In figure 1, we can observe the best features for prediction of quality for both red wine as well as white wine. If we consider the top four variables according to chi-square calculations, for both set of samples, we can detect alcohol and density as common among them. Therefore, both alcohol and density in wine is important for testing the quality of the red wine and white wine.
7.3
CLASSSIFICATION TECHNIQUES
7.3.1
SUPPORT VECTOR MACHINE ANALYSIS
Figure 2. Support Vector machine for Red wine samples and White wine samples.
As seen in figure 2, we have tried to classify the available data points using support vector machine. In case of red wine samples, we could see high amount of accuracy in 2 classes of clusters (class 3,66.13 %) and (class 6,79.26). Also, in case of white wine samples, high amount of accuracy (class 3,83.34%) and (class 6,46.28%) was recorded.
69
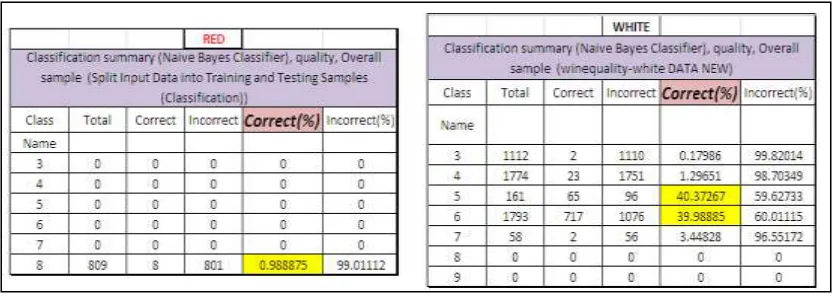
Figure 3. Naïve Bayes for Red wine samples and White wine samples.
In figure 3, we can see the results of classification technique Naïve bayes classifier. It was observed that in case of red wines, only one class had some kind of result ( class 8, 0.988875). While on the other hand, in white wine sample, we observed standard amount of accuracy (class 5,40.37%) and (class 6,39.98%). This is based on classification of group of sample (red & white) being divided into training samples (50%), testing and validation (50%).
8.
DISCUSSION
1. Standard deviation in density of both the samples was less as compared to all other 10 variables, as evident from descriptive statistics (Table1).
2. Alcohol and density factors are the most important factors for predicting the quality of the wines, i.e both red and white wine samples.( Figure 1).
3. During classification of available data points through support vector machine, higher amount of correctness and accuracy (Min. 43 % and Max. 86% approx.) was recorded for 2 classes i.e for both red wine samples and white wine samples.
4. On the contrary, classification of available data points through naïve bayes classifier revealed lesser amount of accuracy (Min. 0.98 % & Max. 40%).
5. If we compare Support Vector Machine with Naïve Bayes Clasifier, we find that Support vector Machine gives better results ( Max 86 %) as compared with Naïve Bayes (Max. 40%).
Some of the suggestions which can be implemented at different levels include: 1. Red wine is better for preventing tooth decay as prevalent in French society. [12]
2. Red wine contains melatonin which can help an individual to sleep peacefully. [12]
3. Red wine also contains flavonoids and saponins which protect individuals against cardiovascular diseases. [12]
4. A controlled, regulated intake of red wine is beneficial in terms of health benefits, though alcohol content in red wine should be reduced from current levels of ( 10– 13) % to (5-6)% for reducing harmful effects of alcohol.
5. White wine also has the ability to protect the heart against aging, which can provide preventive benefits to the organ, though not all whites have the power to do so.
6. A diet with 10 percent of energy derived from white wine was found to be as effective in assisting weight loss as a diet with 10 percent of energy derived from juices along with the additional benefits from consuming wine.
70
9.
CONCLUDING NOTE
Wine trade has been in existence since centuries in past. Density and Alcohol beverage volume has been found to be major factors determining quality of red wine or white wine being used. Also, Support Vector Machine gives more accurate classification than Naïve Bayes classifier technique .Therefore, we accept the two null hypothesis Ha0 and Hb0 that Quality of red wine is dependent upon the alcohol content of the
wine and Higher amount of accuracy is present when support vector machine is used for classification of wine data points in red and white wine samples.. Also, we reject the alternate hypothesis Ha0 andHb0.
10.
RESEARCH IMPLICATIONS
The current research can have numerous implications mostly related to how global wine manufacturing and trade and can be conducted in more efficiently and effectively in this current age of cut throat competition. Further, the suggestions mentioned in the research paper can be incorporated for social benefits without limiting the possibility of gaining higher demand in the market, higher growth in terms of market share, higher productivity and improved overall performance for all the parties involved.
11.
LIMITATIONS OF THE STUDY
Our present work is limited to exploring the factors related to composition of red wine and white wine. Time and cost factors were also responsible for limiting the boundaries of the current research. Most of the data had been collected from open ended secondary sources which are freely available over the internet.
12.
SCOPE FOR FURTHER RESEARCH
We also propose of enhancing the results of current paper by studying more variables involved and their interrelationship in the near future. The paper also gives certain insights on different inter-related factors which determine the levels of improvements that can be made for understanding the wine industry with focus on other aspects or physiochemical properties of wine. The future objective could be directly or indirectly related with improving the quality of wine for health benefits, thereby influencing customers in terms of acceptability and usability.
REFERENCES
1. Ajancis, R. (ed.) (2006). The Oxford Companion to Wine Third Edition. (pp. 355–356). Oxford University Press.
2. Camara, J. S., Arminda Alves, M., & Marques, J. C. (2006). Development of headspace solidphase microextraction-gas chromatography-mass spectrometry methodology for analysis of terpenoids in Madeira wines. Anal. Chim. Acta , 555, 191-200.
3. Conner, J. M., Birkmyre, L., Paterson, A., & Piggott, J. R. (1998). Concentrations of ethyl esters at different alcoholic strengths. J. Sci. Food Agri , 77, 121-126.
71
5. Hartmann, P., Mc Nair, H., & Zoecklein, W. (2002, ). Measurements of 3-alkyl-2-methoxypyrazine by headspace solid phase microextraction in spiked model wines. J. Enol. Vitic,
53, 285-288.
6. http://winefolly.com/tutorial/sulfites-in-wine/. (n.d.).
7. http://www.answers.com/Q/Is_red_wine_stronger_than_white_wine.
8. http://www.answers.com/Q/What_is_the_density_of_wine. (n.d.).
9. http://www.calwineries.com/learn/wine-chemistry/chemical-components-of-wine/sulfur-dioxide. (n.d.).
10.
http://www.oiv.int/oiv/files/6%20- %20Domaines%20scientifiques/6%20%204%20Methodes%20d%20analyses/6-4-1/EN/OIV-MA-D1-03.pdf. (n.d.).
11. http://www.santarosa.edu/~jhenderson/Sulfur%20Dioxide.pdf. (n.d.).
12. https://www.in.lifestyle.yahoo.com.
13. IUPAC, Compendium of Chemical Terminology, 2nd ed.the "Gold Book". (1997, Online corrected version: (2006)).
14. McGovern, P. (2003). Ancient Wine. (Gordon and Breach, Amsterdam).
15. McGovern, S. F. (2000). The Origins and Ancient History of Wine. (Gordon and Breach, Amsterdam).
16. Voilley, A., Beghin, V., Charpentier, V., Charpentier, C., & Peyrond, D. (1991). Interactions between aroma substances and macromolecules in a model wine. Food Sci. Technol. , 24,469-472.