A Realistic Evaluation and Comparison of Indoor Location
Technologies: Experiences and Lessons Learned
Dimitrios Lymberopoulos
Microsoft Research Redmond, WA, USAJie Liu
Microsoft Research Redmond, WA, USAXue Yang
New Devices Group, IntelSanta Clara, CA, USA
Romit Roy Choudhury
UIUC
Urbana-Champaign, IL, USA
[email protected]
Vlado Handziski
Technische Universität BerlinBerlin, Germany
Souvik Sen
HP Labs Palo Alto, CA, USAABSTRACT
We present the results, experiences and lessons learned from comparing a diverse set of technical approaches to indoor localization during the 2014 Microsoft Indoor Localization Competition. 22 different solutions to indoor localization from different teams around the world were put to test in the same unfamiliar space over the course of 2 days, allowing us to directly compare the accuracy and overhead of various technologies. In this paper, we provide a detailed analysis of the evaluation study’s results, discuss the current state-of-the-art in indoor localization, and highlight the areas that, based on our experience from organizing this event, need to be improved to enable the adoption of indoor location services.
Categories and Subject Descriptors
C.3 [Special-purpose and Application-based Systems]:
Real-time and embedded systems
General Terms
Experimentation
Keywords
indoor localization, fingerprinting, ranging, evaluation
1.
INTRODUCTION
Accurate indoor localization has the potential to change the way people navigate indoors in the same way the GPS changed the way people navigate outdoors. For well over a decade, academia and industry have recognized the value of the indoor localization problem and have devoted a lot of effort and resources into solving it.
Permission to make digital or hard copies of all or part of this work for personal or classroom use is granted without fee provided that copies are not made or distributed for profit or commercial advantage and that copies bear this notice and the full cita-tion on the first page. Copyrights for components of this work owned by others than ACM must be honored. Abstracting with credit is permitted. To copy otherwise, or re-publish, to post on servers or to redistribute to lists, requires prior specific permission and/or a fee. Request permissions from [email protected].
IPSN ’15,April 14 - 16, 2015, Seattle, WA, USA. Copyright 2015 ACM 978-1-4503-3475-4/15/04 ...$15.00. http://dx.doi.org/10.1145/2737095.2737726.
Infrastructure-free approaches have focused on leverag-ing already existleverag-ing WiFi [5, 15, 49, 40, 41, 45, 6, 22, 47, 50], FM and TV [8, 9, 34, 28, 29, 27, 12, 33, 19, 48], GSM [31, 44], geo-magnetic [10], and sound signals [43] to enable indoor localization through detailed
fingerprint-ing. Infrastructure-based approaches rely on the
deploy-ment of customized RF-beacons [37], such as RFID [30], infrared [46], ultrasound [36, 20], Bluetooth [7], short-range FM transmitters [26], lights [23], and magnetic signal mod-ulators [32, 2] to enable accurate indoor position estimation. Even though hundreds of different approaches have been proposed in the literature, the indoor location problem still remains unsolved. The research community has not con-verged to a single, widely accepted solution that can achieve the desired accuracy at the required cost. We believe that this is partly due to the highly ad-hoc evaluation process of indoor location systems. Each system is usually evaluated in a custom, highly controlled environment making hard to draw conclusions about its performance and overhead in re-alistic conditions. Even worse, this type of evaluation makes comparison of different solutions almost impossible.
With this in mind, we organized the Microsoft Indoor
Lo-calization Competition [1]. The main motivation behind
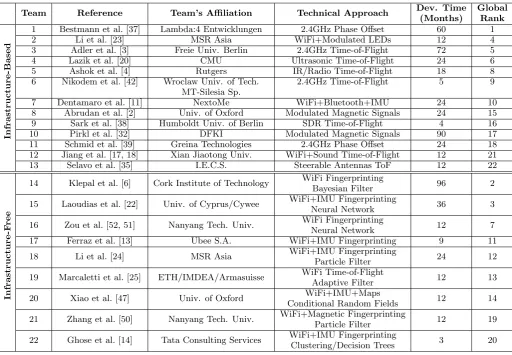
Team Reference Team’s Affiliation Technical Approach Dev. Time Global
(Months) Rank
In
fra
st
ruc
tu
re
-B
as
e
d
1 Bestmann et al. [37] Lambda:4 Entwicklungen 2.4GHz Phase Offset 60 1
2 Li et al. [23] MSR Asia WiFi+Modulated LEDs 12 4
3 Adler et al. [3] Freie Univ. Berlin 2.4GHz Time-of-Flight 72 5
4 Lazik et al. [20] CMU Ultrasonic Time-of-Flight 24 6
5 Ashok et al. [4] Rutgers IR/Radio Time-of-Flight 18 8
6 Nikodem et al. [42] Wroclaw Univ. of Tech. 2.4GHz Time-of-Flight 5 9
MT-Silesia Sp.
7 Dentamaro et al. [11] NextoMe WiFi+Bluetooth+IMU 24 10
8 Abrudan et al. [2] Univ. of Oxford Modulated Magnetic Signals 24 15
9 Sark et al. [38] Humboldt Univ. of Berlin SDR Time-of-Flight 4 16
10 Pirkl et al. [32] DFKI Modulated Magnetic Signals 90 17
11 Schmid et al. [39] Greina Technologies 2.4GHz Phase Offset 24 18
12 Jiang et al. [17, 18] Xian Jiaotong Univ. WiFi+Sound Time-of-Flight 12 21
13 Selavo et al. [35] I.E.C.S. Steerable Antennas ToF 12 22
In
fra
st
ruc
tu
re
-F
re
e
14 Klepal et al. [6] Cork Institute of Technology WiFi Fingerprinting 96 2
Bayesian Filter
15 Laoudias et al. [22] Univ. of Cyprus/Cywee WiFi+IMU Fingerprinting 36 3
Neural Network
16 Zou et al. [52, 51] Nanyang Tech. Univ. WiFi Fingerprinting 12 7
Neural Network
17 Ferraz et al. [13] Ubee S.A. WiFi+IMU Fingerprinting 9 11
18 Li et al. [24] MSR Asia WiFi+IMU Fingerprinting 24 12
Particle Filter
19 Marcaletti et al. [25] ETH/IMDEA/Armasuisse WiFi Time-of-Flight 12 13
Adaptive Filter
20 Xiao et al. [47] Univ. of Oxford WiFi+IMU+Maps 12 14
Conditional Random Fields
21 Zhang et al. [50] Nanyang Tech. Univ. WiFi+Magnetic Fingerprinting 12 19
Particle Filter
22 Ghose et al. [14] Tata Consulting Services WiFi+IMU Fingerprinting 3 20
Clustering/Decision Trees
Table 1: The teams that participated in the 2014 Microsoft Indoor Localization Competition. Teams in each category are listed in order of the localization accuracy they achieved (highest to lowest). Teams 3 and 4 achieved almost identical location errors (0.005m difference), and we considered this to be a tie. The second place was awarded to Li et al., because they deployed fewer anchor nodes. The column before the last one shows the development time (in months) spent on each system.
In this paper, we describe the competition’s evaluation process, provide a detailed analysis of the results, and dis-cuss the experiences and lessons learned from the organiza-tion of this competiorganiza-tion. In particular, we make the follow-ing contributions:
• We provide an in-depth evaluation of the accuracy of
22 different indoor localization systems from academia, industry research and startups in the same realistic, unfamiliar space. We show that sub-meter accuracy is feasible today, and that even WiFi-based approaches
can achieve close to 1maccuracy.
• We show that the localization accuracy degrades by as
much as 3mdue to setup and environmental changes,
such as human or furniture movement and RF inter-ference, between calibration and actual evaluation of the system.
• We compare the expected or previously reported
ac-curacy of each system as determined by controlled lab experiments to the accuracy achieved in our realistic,
unfamiliar environment, and show that in practice
lo-calization accuracy degrades by 1m−4mon average.
• We show that localization accuracy can widely vary
across different evaluation points even for the most ac-curate systems. In addition, we show that there are easy and hard evaluation points in the sense that most or almost any of the systems can achieve low error re-spectively. This shows that the choice of evaluation test points is critical, and it reveals the difficulty of objectively evaluating indoor location systems.
• We evaluate the stability of localization accuracy for
the top performing systems, and study the promise and limitations of automated, robot-based evaluation.
2.
EVALUATION PROCESS
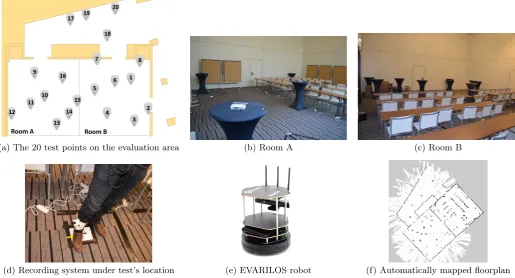
(a) The 20 test points on the evaluation area (b) Room A (c) Room B
(d) Recording system under test’s location (e) EVARILOS robot (f) Automatically mapped floorplan
Figure 1: The 300m2 area used for the competition. 20 evaluation points were placed into two rooms and
the hallway. Besides the manual evaluation, the EVARILOS robot automatically mapped the evaluation area and then was used to automatically evaluate the accuracy of the top two teams.
2.1
Participating Teams
Initially 32 teams registered 36 different submissions for the competition. Eventually, 21 teams with 22 different ap-proaches attended the competition (Table 1). All systems
were classified into two categories: infrastructure-free and
infrastructure-based, based on their hardware deployment
requirements. Teams in theinfrastructure-free category did
not require the deployment of any custom hardware to com-pute indoor locations, apart from existing WiFi infrastruc-ture. Most of these approaches leverage existing WiFi sig-nals and combine them with sensors, such as accelerom-eter, gyro, and compass, on existing off-the-shelf devices such as phones and tablets. On the other hand, teams in theinfrastructure-basedcategory required the deployment of custom hardware such as, bluetooth beacons, magnetic res-onators, ultrasound speakers, custom RF transmitters and more.
Overall, 9 systems were in the infrastructure-free
cate-gory, and 13 systems in the infrastructure-based category
(Table 1).
Most of the participating teams were able to setup their
systems according to their expectations. However, a few
teams faced difficulties that might have negatively impacted their performance. In particular, Team 11 erroneously mea-sured the ground truth location of one of their anchor nodes, leading to much higher than expected localization error. For various reasons, Teams 13 and 18 spent only a limited amount of time setting up, and this resulted into subopti-mal system configurations. Finally, Team 20 faced technical
issues that prevented it from using wearable inertial sensors, thus negatively impacting its overall accuracy.
2.2
System Setup and Evaluation
The competition took place in Berlin, Germany at the ho-tel venue of the 2014 International Conference on Informa-tion Processing in Sensor Networks (IPSN). Two attached
rooms, each measuring 10m by 9min dimensions, and the
hallway in front of the two rooms (measuring approximately
10m by 4m) were used for the evaluation. Figure 1 shows
the floor plan of the approximately 300m2 evaluation area.
None of the participating teams had access to the evaluation
area before the competition.1
The competition was a 2-day event. During the first
day, all teams were given 7 hours to setup their indoor
location technologies in the evaluation area. During this
time, teams were able to deploy their custom hardware, if any, and also perform any profiling of the space necessary (i.e., fingerprinting, map construction etc.). Each team was allowed to deploy up to 10 infrastructure points (i.e., ac-cess points, custom RF modules, magnetic field modulators, light-modulating lamps etc.) in the evaluation area.
To avoid having each team deploying their own generic WiFi access points, the organizers deployed 10 WiFi ac-cess points in the evaluation area. Each room was equipped with 5 access points, one at each corner of the room and one in the middle of the room. The deployed access points
1
0.72
1.56 1.96
2.03 2.04 2.09 2.22 2.35 2.58
2.72 2.81 3.19
3.47 3.71 3.83
3.87 3.96 4.04
4.86 5.23
8.91 10.22
0 1 2 3 4 5 6 7 8 9 10 11
Loc
ati
on
Er
ror
(me
te
rs)
Average Error RMSE Location Error Standard Deviation
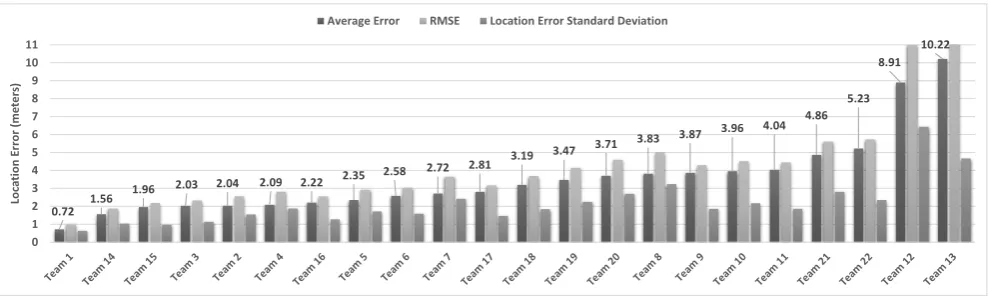
Figure 2: Average location error, root mean square error(RMSE), and the standard deviation of the location
error for all22 teams. As a reference, if a team were to always report the center of the evaluation area as
the true location, the average location error would be7meters.
were mounted on cocktail tables like the ones shown in
Fig-ure 1(b) at a height of approximately 1.5 meters from the
ground. All the teams that relied on generic WiFi access points for estimating indoor location, could only use these access points.
Note that the deployment of 10 dedicated WiFi access points created a bias in favor of all systems in the
infrastructure-free category. Given the relatively small size of the
evalu-ation area, deploying 10 access points resulted into an un-usually high density of access points. Most areas today (i.e., malls) provide fewer number of access points that are also mounted differently in the space (i.e., mounted on the ceil-ing).
At the beginning of the first day, the organizers indicated an origin point for the reference coordinate system that each
team should use to report locations. Locations were
re-ported as two-dimensional coordinates (i.e., (2.12m, 5.1m)) with respect to the origin point.
At the end of the first day, the deployed hardware from all teams was turned off, and all contestants left the evaluation
area. At that time, the organizers marked 20 points on
the floor of the evaluation area and measured theX andY
coordinates of these points with respect to the predefined origin point (Figure 1(a)). The ground truth measurements of the evaluation points were taken using laser range finders. Leveraging the technical drawings of the building used for the evaluation, we verified that the evaluation points were
measured with centimeter level accuracy (1−2cm error).
This measurement error is an order of magnitude less than the localization error achieved by the best team, and thus it did not affect the evaluation results.
During the second day of the evaluation, each team would show up at a pre-assigned time slot, turn on its deployed system, and hand the device to be localized to the organiz-ers. The device was a mobile phone, a tablet or a laptop depending on the system under test. The organizers carried the device above each of the 20 evaluation points, waited for a couple of seconds, and recorded the location reported by the system under test. All systems were evaluated based on the average location error across all 20 evaluation points. The location error for a given point was defined as the Eu-clidean distance between the true and reported coordinates for that point. Note that even though we recorded location
estimates only on the pre-measured 20 evaluation points, the system under test was allowed to continuously perform localization. For instance, the system under test could use inertial sensors to perform continuous path tracking to im-prove localization accuracy.
2.2.1
Introducing Realistic Uncertainty
To assess the ability of each approach to localize devices at dynamic/unfamiliar environments, part of the evaluation area’s furniture placement was modified after the setup day and before the evaluation day. More specifically, both rooms in Figure 1(a) were equipped with furniture. Approximately half of each room was filled with tables and chairs resem-bling a typical classroom setup. The other half of the rooms was either empty or sparsely occupied by tall cocktail ta-bles (Figure 1(a) and Figure 1(b)). Room A, shown in Fig-ure 1(a), remained unchanged between the setup and eval-uation days. The furniture in Room B (Figure 1(b)) were completely rearranged in terms of both placement and ori-entation. Competitors were not aware of which room will be modified and how until the evaluation day. This allowed us to evaluate the accuracy of the different approaches in both familiar and unfamiliar setups.
Two more sources of unfamiliarity were, unintentionally, introduced during the evaluation. First, even with the or-ganizers deploying the WiFi access points, there was still a huge level of wireless interference during the first day of system setup where all teams were simultaneously profiling the space and calibrating their systems. The wireless in-terference was significantly reduced during the second day where the actual evaluation took place, as only one system was active at a time. Second, during both days of the event (setup and evaluation days), people participating in the eval-uation study as well as guests of the hotel venue where the evaluation took place were more than welcome to enter the rooms and walk around. This provided varying levels of oc-cupancy and human movement in the evaluation area during the setup and evaluation days.
2.3
Automated Evaluation
benchmark-ing platform [16] to automatically evaluate the localization accuracy of the two teams in the infrastructure-based and infrastructure-free categories that achieved the lowest local-ization errors.
The EVARILOS benchmarking platform is an integrated experimental infrastructure that fully automates the evalu-ation of indoor localizevalu-ation systems [21]. It leverages the TWISTbot mobility platform (Figure 1(e)) comprised of a Kubuki mobility base, a Microsoft Kinect sensor and a Hokuyo URG-04L laser ranger, to enable accurate and re-peatable positioning of the evaluated localization devices at different evaluation points.
During the setup day, the TWISTbot platform was able to automatically extract the floor plan of the evaluation area using its onboard sensors (Figure 1(f)). During the evalu-ation day, each team’s device was mounted on top of the robot, and then the robot was given the true coordinates of each of the 20 evaluation points. In response, the robot autonomously navigated to the evaluation points and when there, it recorded the location of the system under test. Even though the EVARILOS benchmarking platform can interact with the evaluated localization system over a well defined API, locations were manually recorded and compared with the ground-truth information provided by the TWISTbot to reduce the integration overhead for the participating teams. This allowed us to evaluate the stability of the localization accuracy for the top performing systems, and to study the promise and limitations of robot-based evaluation.
3.
LOCALIZATION ACCURACY ANALYSIS
Figure 2 shows the localization accuracy of all 22 systems.
The average location error achieved varied between 0.72m
and 10.22m. Only 3 teams were able to achieve less than
2maccuracy, while half of the teams achieved less than 3m
error. The team with the highest accuracy was Team 1 with
an average location error of 0.72m. It is worth noting that
Team 1 opted to deploy only 6 out of the total 10 anchor nodes they were allowed to deploy in the evaluation area.
In the infrastructure-based category, Team 1 was followed by Team 2, Team 3, and Team 4, with all 3 teams achieving
almost identical location errors (2m- 2.1m). Teams 3 and
4 deployed 10 anchor nodes, while Team 2 deployed only 5 LED lamps.
In the infrastructure-free category, Team 14 achieved the
lowest location error (1.6m). Teams 15, 16, and 17 followed
with location errors of 1.96m, 2.22m, and 2.81m respec-tively.
Interestingly, the gap in terms of location accuracy be-tween infrastructure-free and infrastructure-based approaches seems to be significant only for the top performing teams. The most accurate infrastructure-based approach (Team 1) was able to achieve half the error of the top infrastructure-free approach (Team 14), which represents a notable increase in localization accuracy.
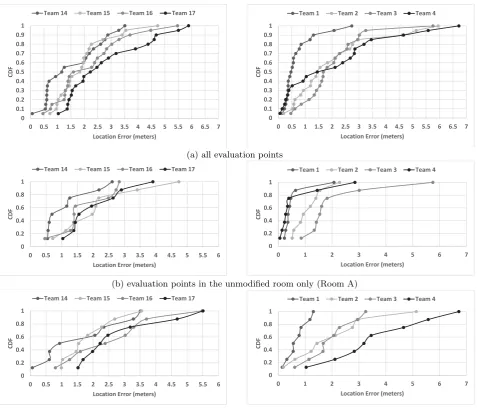
Figure 3(a) shows the empirical CDF of the location er-rors for the top 4 teams in both categories. The top ap-proaches in both categories (Team 1, and Team 14) are
clearly ahead of the other teams. Surprisingly, the
per-formance of the remaining top approaches is very similar independently of any custom infrastructure used. The dif-ference between infrastructure-based and infrastructure-free
approaches is rather small (≈ 0.5m). Also, the maximum
0 2 4 6 8 10 12
0 20 40 60 80 100 120
Loc
ati
on
Er
ror
(m
)
Development TIme in Months
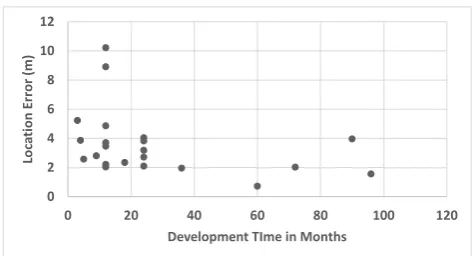
Figure 4: Relationship between the achieved loca-tion error in meters and the development time spent on each system.
location errors produced by infrastructure-based approaches can be higher than that of infrastructure-free approaches.
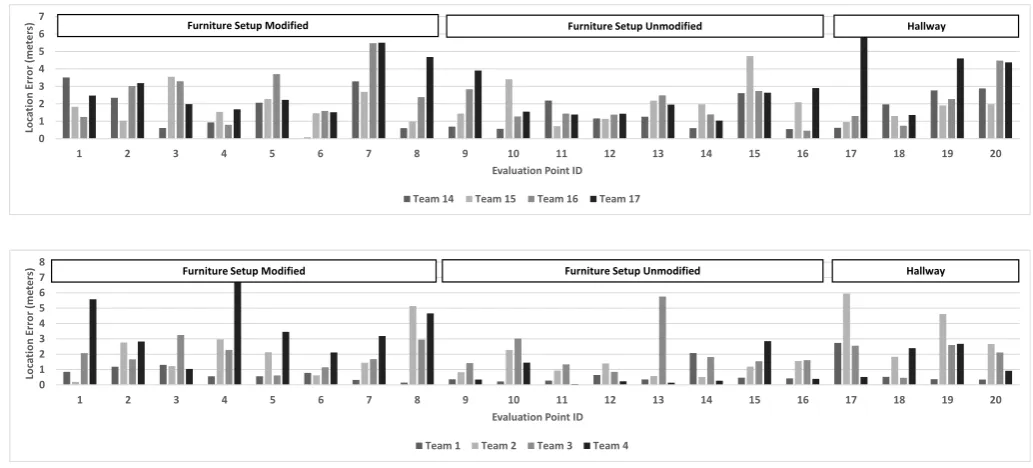
Figure 5 shows the exact location error that the top 4 teams in each category achieved for all 20 evaluation points. Note that the location error achieved by each team varies across evaluation points. In addition, the top teams do not necessarily achieve the best performance for all evaluation points. For instance, Team 14 (the top infrastructure-free approach) achieves the worst or close to the worst location error compared to the other teams for several evaluation points (1, 2, 11, 15, 18).
3.1
Implementation Variations
Even though different teams leveraged similar techniques for indoor location estimation, the variance in performance across implementations was significant. For instance, the accuracy achieved by approaches measuring time-of-flight or
phase offset in the 2.4GHz range varied from 0.72m(Team
1) all the way to approximately 4m (Team 11). Similarly,
WiFi-only approaches exhibited similar variations ranging
from 1.6m (Team 14) to approximately 5m (Team 22)
lo-cation accuracy. On the other hand, the two teams that leveraged modulated magnetic signals (Team 8 and Team
10) achieved similar accuracy (≈4m).
We believe that some of these variations can be attributed to the amount of time that the teams have devoted in im-plementing their approaches. As shown in Table 1, Team 1 has spent 5 years optimizing its infrastructure-based system, while Team 11 has only been working on its implementation for two years. Similarly, in the case of infrastructure-free ap-proaches, Team 14 has spent 8 years developing its system, while Team 22 has devoted only 3 months.
In some cases, though, development time does not seem to help. For instance, even though Team 10 has spent almost 5 years on indoor localization using modulated magnetic sig-nals, Team 8 achieved similar performance using the same technology after 2 years of development time.
Figure 4 shows the localization accuracy achieved by each team as a function of the development time. Even though some relatively young systems performed well, it is clear that the variation in performance is higher when the development time is less than 2 years. The only teams that were able to
achieve localization errors lower than 2mhad devoted more
0 0.1 0.2 0.3 0.4 0.5 0.6 0.7 0.8 0.9 1
0 0.5 1 1.5 2 2.5 3 3.5 4 4.5 5 5.5 6 6.5 7
CDF
Location Error (meters)
Team 14 Team 15 Team 16 Team 17
0 0.1 0.2 0.3 0.4 0.5 0.6 0.7 0.8 0.9 1
0 0.5 1 1.5 2 2.5 3 3.5 4 4.5 5 5.5 6 6.5 7
CDF
Location Error (meters)
Team 1 Team 2 Team 3 Team 4
(a) all evaluation points
0 0.2 0.4 0.6 0.8 1
0 0.5 1 1.5 2 2.5 3 3.5 4 4.5 5 5.5 6
CDF
Location Error (meters)
Team 14 Team 15 Team 16 Team 17
0 0.2 0.4 0.6 0.8 1
0 1 2 3 4 5 6 7
CD
F
Location Error (meters)
Team 1 Team 2 Team 3 Team 4
(b) evaluation points in the unmodified room only (Room A)
0 0.2 0.4 0.6 0.8 1
0 0.5 1 1.5 2 2.5 3 3.5 4 4.5 5 5.5 6
CDF
Location Error (meters)
Team 14 Team 15 Team 16 Team 17
0 0.2 0.4 0.6 0.8 1
0 1 2 3 4 5 6 7
CDF
Location Error (meters)
Team 1 Team 2 Team 3 Team 4
(c) evaluation points in the modified room only (Room B)
Figure 3: Empirical cumulative distribution function of the location error for the top 4 teams in the
infrastructure-free (left) and infrastructure-based (right) categories.
3.2
The Impact of Furniture Setup
Right after the setup day and before the evaluation day, the furniture setup in Room B was modified, while the fur-niture setup in Room A remained the same (Figure 1). Ta-ble 2 shows the average location error achieved by the top 4 teams in both categories and for each of the two rooms separately. With the exception of Team 15, the rest of the infrastructure-free approaches report higher location errors in the room where the furniture setup was modified. The error increase varies anywhere between 0.47mand 0.94m.
Surprisingly, even infrastructure-based approaches seem to be affected by the changes in the furniture setup. The top 4 teams in this category, with the exception of Team 3, exhibited an increase in location errors in the modified
room that varied anywhere between 0.11mand 2.99m. For
Teams 1 and 3 the error difference between the rooms is rather small, but for the rest of the approaches the error increase can be even higher than that of infrastructure-free approaches. We believe that this is primarily due to differ-ences in the way these teams deployed hardware in the two
rooms, and not due to the furniture setup in the rooms. For instance, Team 2 deployed only 2 LED lamps in the modified room and 3 LED lamps in the room that remained identical. This type of deployment decisions are the main source of er-ror increase in the case of infrastructure-based approaches in Table 2.
This intuition can be further verified by Figure 3(b), and Figure 3(c), where the empirical CDF of the location error for the top 4 teams is shown for each room separately. All CDF curves for the infrastructure-free approaches seem to be uniformly shifted to the right in the case of modified furni-ture. However, for infrastructure-based approaches this shift is significantly smoother and varies across systems. We be-lieve that this variability across teams is caused by the type of deployment decisions made by each team as described earlier.
0 1 2 3 4 5 6 7
1 2 3 4 5 6 7 8 9 10 11 12 13 14 15 16 17 18 19 20
Loc
ati
on
Er
ror
(m
et
er
s)
Evaluation Point ID
Team 14 Team 15 Team 16 Team 17
Furniture Setup Modified Furniture Setup Unmodified Hallway
0 1 2 3 4 5 6 7 8
1 2 3 4 5 6 7 8 9 10 11 12 13 14 15 16 17 18 19 20
Loc
ati
on
Er
ror
(me
ter
s)
Evaluation Point ID
Team 1 Team 2 Team 3 Team 4
Furniture Setup Modified Furniture Setup Unmodified Hallway
Figure 5: Location error achieved at each evaluation point by the top 4 teams in the infrastructure-free (top) and infrastructure-based categories (bottom).
Avg. Location Error (meters)
Approach Identical Room Modified Room (Room B)
Infrastructure-free
Team 14 1.2 1.67
Team 15 2.21 1.92
Team 16 1.75 2.69
Team 17 2.09 2.91
Infrastructure-based
Team 1 0.6 0.71
Team 2 1.15 2.06
Team 3 2.16 1.95
Team 4 0.71 3.7
Table 2: Average location error achieved by the top
4 approaches in each category for the two rooms.
Most of the approaches experienced significant in-crease in location error in the room where the fur-niture location and orientation was modified.
significantly higher compared to the evaluation points in the room with the unmodified furniture (points 8 through 16).
Note that the error for the evaluation points in the hall-way also increases. We believe that this was caused by the limited coverage that most teams’ equipment provided at the hallway. During setup, most teams emphasized deploy-ment in the interior of the two rooms, creating blind spots in the hallway.
3.3
Error Correlation Between Teams
In this section we examine the correlations of the different teams in terms of their performance across the evaluation points. For each team, a vector including the localization error for each of the 20 evaluation points was calculated. We
analyze the correlation of each pair of teams by computing the cross-correlation between their localization error vectors. Figure 6 shows the computed correlation matrix for all 22 teams. There is a clear subset of teams that are highly cor-related. First, the top 4 WiFi-based fingerprinting teams
(Teams 14, 15, 16, and 17) are highly correlated.
Sur-prisingly, Team 22 is also highly correlated to these teams even though it achieved almost double the localization error. Even though less accurate, this team achieved similar trends in localization error across evaluation points.
Even more surprisingly, the top WiFi-fingerprinting ap-proaches seem to be highly correlated to the the top 4 infrastructure-based teams (Teams 1, 2, 3, and 4) despite the fact that some of these teams are using completely different technology (i.e., Team 4 leverages ultrasonic transmissions).
3.4
Variance Across Evaluation Points
Figure 7 shows the average location error across all teams for each of the 20 evaluation points. At a high-level, there seem to be good and bad points in terms of location accu-racy. For instance, points 6, 9, 10, 11, 12, and 16 tend to generate lower location errors across all teams compared to the rest of the evaluation points. It is interesting to note that all these points tend to be located towards the center of the two evaluation rooms. On the other hand, points lo-cated at the edges of the rooms (i.e., 1 , 2, 7 , 8), or at the hallway (i.e., 19, 20) generate the highest location error with the largest deviations.
1 2 3 4 5 6 7 8 9 10 11 12 13 14 15 16 17 18 19 20 21 22
1 1
2 1 1
3 0.9 0.9 1
4 0.9 1 0.9 1
5 0.4 0.3 0.3 0.3 1
6 -0 -0 -0 -0 -0 1
7 0.1 0.1 0.1 0.2 -0 -0 1
8 0.5 0.4 0.4 0.4 0.1 -0 -0 1
9 0.2 0 0.1 -0 0.2 -0 -0 0.4 1
10 0 0.1 -0 0.2 0 -0 0 -0 -0 1
11 -0 -0 -1 -1 -0 -0 -0 -0 0.4 -0 1
12 0.5 0.4 0.3 0.2 0.5 0 -0 0.5 0.5 -0 0 1
13 0.2 0.1 0.1 0.1 0.3 -0 0.2 0.1 0.4 0.2 -0 0.2 1
14 0.9 0.9 0.9 1 0.3 -0 0.2 0.1 -0 0.2 -1 0.1 0.1 1
15 1 1 1 1 0.3 -0 0.1 0.4 0 0.1 -1 0.4 0.1 0.9 1
16 0.9 1 1 1 0.3 -0 0.2 0.3 0 0.1 -1 0.3 0.1 1 1 1
17 0.9 1 0.9 1 0.3 -0 0.2 0.3 -0 0.1 -1 0.3 0 1 1 1 1
18 0.4 0.4 0.4 0.4 0.4 0.1 0.1 0 0.2 0.1 -0 0.4 -0 0.4 0.4 0.4 0.4 1
19 0.5 0.5 0.4 0.5 0.6 0.1 0 0.4 0.1 0.2 -1 0.5 0.4 0.5 0.5 0.5 0.5 0.4 1
20 0 0.1 0.1 0.1 -0 0.1 0.3 0 -0 -0 -0 -0 0.2 0.2 0.1 0.1 0.2 -0 0.1 1
21 0.7 0.8 0.6 0.7 0.1 0 0.2 0.3 -0 0.2 -0 0.2 0.1 0.7 0.7 0.7 0.6 0.1 0.4 0.1 1
22 0.4 0.4 0.4 0.5 0.1 0.3 0 0.3 -0 0.5 -1 0.1 0.3 0.4 0.5 0.4 0.3 0.1 0.6 -0 0.5 1
Te
am
ID
Team ID
Figure 6: The cross-correlation of the localization accuracy vectors for every pair of systems evaluated.
able to emphasize more on the hard to estimate locations in the area of interest. How these metrics are specifically defined is beyond the scope of this study.
3.5
Lab vs. Reality
Indoor localization approaches are usually evaluated in highly controlled environments (i.e., research lab). This type of evaluation could positively bias the performance of the system. To quantify this bias, we asked each participating team to report the localization error that it had previously achieved in their own experiments, and compared this error to the one achieved in our evaluation study.
Figure 8 shows the difference between expected and achieved localization error for all teams. Most teams achieved worse
accuracy by approximately 1.5mto 4m. There were teams
though (i.e., Team 1, Team 14, Team 17) that were able to achieve the same or even better accuracy than expected. Note that all the teams that achieved higher than expected accuracy are WiFi-based approaches (Teams 14, 17, 18). We believe that this was due to the large number of WiFi access points that were leveraged in the evaluation study. Given
that the evaluation area was relatively small (300m2), all
10 access points could be successfully sniffed from every lo-cation in the evaluation area, creating an ideal setup for WiFi-based approaches.
3.6
Robot-based Evaluation
The best two teams (Teams 1 and 14), as determined by the manual evaluation process, were invited to another eval-uation round using the EVARILOS benchmarking platform described in Section 2.3.
Table 3 shows the average location error for both the robot and the manual evaluation process. Surprisingly, the ap-proach by Team 1 was able to achieve the exact same local-ization accuracy indicating the stability and reliability of the technology. The accuracy of the approach by Team 14 was
only slightly increased by 0.15m. Given that this is a pure
WiFi-based approach, the overall accuracy and its stability is impressive.
The results in Table 3 also show the feasibility of automat-ing the evaluation process of indoor location technologies us-ing properly equipped robots. Even though the evaluation
Figure 7: Average location error and its standard
deviation across all teams for each of the 20
evalua-tion points.
Avg. Location Error (meters)
Approach Manual Robot
Team 1 0.72 0.72
Team 14 1.56 1.71
Table 3: Automatic evaluation using the EVARILOS
benchmarking platform. For Team 14, the robot
evaluation included only18out of the total20
evalu-ation points. Obstacles or failures in robot’s naviga-tion, prevented the robot from placing the system-under-test above all evaluation points.
area was a very challenging navigation and locomotion envi-ronment due to the presence of a lot of people and installed localization infrastructure (including a lot of loose cabling on the floors), the TWISTbot mobility platform was able to position the system-under-test devices to the different evaluation points with an average positioning error of less
than 25cm. This result highlights the promising potential
of leveraging robots as a source of ground-truth informa-tion for automatic evaluainforma-tion of many indoor localizainforma-tion solutions that typically have location estimate errors that are several multiples of this value. However, scaling out au-tomated, robot-based evaluation to any type of floor-plan that might include multiple floors with different locomotion conditions still remains a challenging, unsolved problem.
4.
LESSONS LEARNED
-10 -8 -6 -4 -2 0 2 4 6
1 2 3 4 5 6 7 8 9 10 11 12 13 14 15 16 17 18 19 20 21 22
Exp
ect
e
d
-A
ch
ie
ve
d
L
oc
at
ion
Er
ror
(m
et
e
rs)
Team ID
Figure 8: The difference between expected (previ-ously measured in the lab) and achieved location accuracy in meters. Negative values indicate worse accuracy than expected while postitive values indi-cate better than expected results.
experience organizing this event, we believe we can safely extract a set of high level conclusions.
4.1
The Indoor Location Problem is NOT Solved
After more than a decade of intensive work in this area, the indoor location problem remains unsolved. There does not seem to exist a technology or a combination of tech-nologies that can recreate the experience that GPS offers
outdoors in the indoor environment. Even though Team
14 managed to achieve an impressive 1.6 meters accuracy
solely based on off-the-shelf access points (the high density of deployed access points positively biased this type of
sys-tems), and Team 1 was able to achieve 0.72 meters location
error, this level of accuracy can only enable a subset of the envisioned indoor localization scenarios. Applications that require room-level or even meter level accuracy (i.e., indoor navigation), can be easily powered by such technologies.
However, more sophisticated applications such as dynamic personalized pricing, and product placement and advertise-ments in the context of retail stores (i.e., grocery or clothing stores) require much higher granularity of location informa-tion. In such scenarios, there might be tens of different prod-ucts within a meter distance from the user, rendering the current systems inefficient. In addition, there does not seem to be a technology that can consistently provide the same lo-calization error across all evaluation points. All systems ex-hibited large accuracy variations across different evaluation points which raises concerns about the stability/reliability of current indoor location technologies.
4.2
Deployment Overhead Remains High
Most of the teams that participated in the evaluation study had to deploy custom infrastructure, and the rest had to manually profile the evaluation area. From directly ob-serving all the teams during the setup day, it became clear that the deployment/profiling cost of current approaches is
prohibitively high. All teams were given 7 hours to
de-ploy their hardware and/or profile a relatively small area of
300m2. Even though one would think that 7 hours should
be way more than enough time for the teams to setup their systems, this wasn’t the case. On average, it took each team 5 hours to setup its approach in the designated evaluation area. 8 out of the total 22 teams made use of the full 7
hours of setup time, and for a couple of teams 7 hours was not enough time to fully deploy their systems. This is par-ticularly concerning given the fact that the teams did not have to worry about any practical issues that any commer-cial deployment would impose (i.e., aesthetics, properly hide the deployed equipment etc.).
In addition, the whole process of deploying custom hard-ware and profiling the space was quite intrusive. We don’t believe that any business owner would like to perform either of these two tasks while real customers are in the business.
When considering the massive size of deployment candi-date sites (i.e., shopping malls) and how intrusive, time con-suming and labor intensive the processes of deploying hard-ware and profiling the space are, realistic indoor location de-ployments that can achieve centimeter-level accuracy seem infeasible at this point. Reducing the overhead and manual labor required by the different indoor location technologies is of paramount importance for their success.
4.3
Changes in the Environment Impact
Ac-curacy
Even though previous studies have already shown that large objects such as furniture and human presence can im-pact localization accuracy, indoor location technologies are typically evaluated on static environments. By modifying the furniture setup in one of the rooms in the evaluation area we were able to quantify the impact of large objects on different indoor location approaches. Infrastructure-free approaches that rely on WiFi signals can experience up to 1 meter of location error increase due to furniture setup changes (Table 2). This is particularly high considering that the average location error of the top infrastructure-free
ap-proach was 1.6m. However, the increase in location error
depends heavily on the implementation. For instance, the top two teams in the infrastructure-free category experience less than 0.5m or even no increase in error at all when the furniture setup is altered.
4.4
Redesigning Indoor Location Evaluation
The way indoor location technologies are evaluated and compared can be rather tricky. Even though various metrics have been proposed in the literature (i.e., average location
error, RMSE, 95th percentile etc.), there are variations in
the real world that are not being properly captured by these metrics. For instance, as Figure 7 shows, not all evaluation
points are equal. There are easy points that almost any
indoor location approach can easily handle, and there are points that are really hard to accurately localize. As a re-sult, the way evaluation points are selected and weighted in the evaluation metric becomes crucial. We believe that a lot of work needs to be done in terms of standardizing the eval-uation process and metrics of indoor location technologies to properly capture these parameters.
4.5
Designing Future Indoor Localization
Com-petitions
Our first attempt at organizing an indoor localization com-petition gave us a lot of insight on how an ideal comcom-petition
should be organized. First, one of the major issues that
teams had to deal with was the RF interference caused by the numerous custom RF solutions that were simultaneously deployed. This interference made calibration a tedious task, and in some cases it prevented contestants from properly calibrating their systems. Ideally, and assuming no realis-tic time restrictions, each team should be allocated a time slot during which only this team’s system is active, enabling hassle-free system calibration.
Second, in this competition dedicated access points were deployed just for the competition to make sure that contes-tants can easily measure their ground truth locations. How-ever, any infrastructure-free approach should be able to rely on existing access points, and should also be able to deal with all the different sources of noise that this implies (i.e., lower deployment density, power level adaptation etc.).
Third, instead of using a relatively small area consisting of two large rooms on a single floor, a significantly larger area with a mixture of open and office-like spaces across multiple floors should be leveraged for such an evaluation.
Fourth, the evaluation of systems in this competition has been point-based ignoring the ability of these systems to perform continuous localization as the human subject moves in space and time. A way to capture and quantify the ability of indoor location systems to capture the continuous path that the human subject follows would be of great value.
Fifth, to ensure that all systems are evaluated under iden-tical environmental conditions (i.e., number of people in the room, interference etc.), all systems should be simultane-ously evaluated at a given evaluation point. Also, in order to capture temporal variations, all systems should be evalu-ated across different time windows as well.
Sixth, it is very hard to capture the effectiveness of an indoor localization algorithm with a single metric. Ideally, competing systems should be compared across a wide variety of localization accuracy metrics, and several other aspects of each system, such as deployment overhead, setup time, and more, should be quantified in detail.
5.
CONCLUSIONS
The indoor location competition described in this paper was an experiment that aimed to bring multiple indoor loca-tion technologies under the same roof and directly compare their accuracy and overhead requirements. The overwhelm-ing participation clearly demonstrated that indoor location remains a hot topic. It also demonstrated the need from the research and industry community in this area to have a venue for demonstrating its latest results and comparing its performance to other teams in a reliable way. Based on the passion the teams demonstrated and the fun they had during the event, we believe that more experiments like this one need to take place or even be established as recurring (i.e., yearly) events.
6.
ADDITIONAL AUTHORS
Filip Lemic- Technische Universit¨at Berlin, Germany,
(email: [email protected])
Jasper B¨usch- Technische Universit¨at Berlin, Germany,
(email: [email protected])
Zhiping Jiang- Xi’an Jiaotong University, China,
(email: [email protected])
Han Zou- Nanyang Technological University, Singapore,
(email: [email protected])
Hao Jiang- Nanyang Technological University, Singapore,
(email: [email protected])
Ashwin Ashok- Carnegie Mellon University, USA,
(email: [email protected])
Chenren Xu- Carnegie Mellon University, USA,
(email: [email protected])
Avik Ghose- Tata Consulting Services, India,
(email: [email protected])
Nasim Ahmed- Tata Consulting Services, India,
(email: [email protected])
Chi Zhang- Nanyang Technological University, Singapore,
(email: [email protected])
Zhuoling Xiao- University of Oxford, UK,
(email: [email protected])
Hongkai Wen- University of Oxford, UK,
(email: [email protected])
Thomas Schmid- RF Ranging, USA,
(email: [email protected])
Daniel Lee- RF Ranging, USA,
(email: [email protected]))
Martin Klepal- Cork Institute of Technology, Ireland,
(email: [email protected])
Christian Beder- Cork Institute of Technology, Ireland,
(email: [email protected])
Maciej Nikodem- Wroclaw University of Technology, Poland,
(email: [email protected])
Szymon Szymczak- MT-Silesia, Poland,
(email: [email protected])
Pawel Hoffmann- MT-Silesia, Poland,
(email: [email protected])
Leo Selavo - Institute of Electronics and Computer
Sci-ence, Latvia, (email: [email protected])
Domenico Giustiniano- IMDEA Networks Institute, Spain,
(email: [email protected])
Vincent Lenders- Armasuisse, Switzerland,
(email: [email protected])
Maurizio Rea- ETH, Zurich,
(email: [email protected])
Andreas Marcaletti- ETH, Zurich,
(email: [email protected])
Christos Laoudias- KIOS Research Center, Cyprus,
(email: [email protected])
Demetrios Zeinalipour-Yazti- University of Cyprus, Cyprus,
(email: [email protected])
Yu-Kuen Tsai- Cywee Corporation Ltd, Taiwan,
(email: [email protected])
Traian E. Abrudan- University of Oxford, UK,
(email: [email protected])
Andrew Markham- University of Oxford, UK,
(email: [email protected])
Arne Bestmann- Lambda:4 Entwicklungen GmbH,
Ger-many, (email: [email protected])
Ronne Reimann- Lambda:4 Entwicklungen GmbH,
Ger-many, (email: [email protected])
Liqun Li- Microsoft Research Asia, China,
(email: [email protected])
Chunshui Zhao- Microsoft Research Asia, China,
Stephan Adler- Freie Universit¨at Berlin, Germany,
(email: [email protected])
Simon Schmitt- Freie Universit¨at Berlin, Germany,
(email: [email protected])
Patrick Lazik- Carnegie Mellon University, USA,
(email: [email protected])
Niranjini Rajagopal- Carnegie Mellon University, USA,
(email: [email protected])
Anthony Rowe- Carnegie Mellon University, USA,
(email: [email protected])
Vincenzo Dentamaro- Nextome, Italy,
(email: [email protected])
Domenico Colucci- Nextome, Italy,
(email: [email protected])
Pasquale Ambrosini- Nextome, Italy,
(email: [email protected])
Andre S. Ferraz, - Ubee, Brazil,
(email: [email protected])
Lucas Q. L. Martins- Ubee, Brazil,
(email: [email protected])
Pedro Bello- Ubee, Brazil,
(email: [email protected])
Alan Alvino- Ubee, Brazil,
(email: [email protected])
Vladica Sark- Humboldt University of Berlin, Germany,
(email: [email protected])
Gerald Pirkl- DFKI GmbH, Germany,
(email: [email protected])
Peter Hevesi- DFKI GmbH, Germany,
(email: [email protected])
7.
REFERENCES
[1] Microsoft indoor localization competition.
http://research.microsoft.com/en-us/events/ ipsn2014indoorlocalizatinocompetition/.
[2] T. E. Abrudan, Z. Xiao, A. Markham, and N. Trigoni. Distortion rejecting magneto-inductive 3-D
localization (MagLoc).IEEE Journal on Selected
Areas in Communications, pages 1–14, 2015. (to
appear).
[3] S. Adler, S. Schmitt, Y. Yang, Y. Zhao, and M. Kyas. FubLoc: Accurate Range-based Indoor Localization and Tracking. Technical report, Microsoft Indoor Localization Competition, 2014.
[4] A. Ashok, C. Xu, T. Vu, M. Gruteser, R. Howard, Y. Zhang, N. Mandayam, W. Yuan, and K. Dana. Bifocus: Using radio-optical beacons for an augmented
reality search application. InProceeding of the 11th
Annual International Conference on Mobile Systems, Applications, and Services, MobiSys ’13, pages 507–508, New York, NY, USA, 2013. ACM. [5] P. Bahl and V. N. Padmanabhan. RADAR: An
In-Building RF-based User Location and Tracking
System. InProceedings of INFOCOM, 2000.
[6] C. Beder and M. Klepal. Fingerprinting based localisation revisited - a rigorous approach for comparing RSSI measurements coping with missed access points and differing antenna attenuations. In 2012 International Conference on Indoor Positioning
and Indoor Navigation (IPIN), 2012.
[7] R. Bruno and F. Delmastro. Design and analysis of a bluetooth-based indoor localization system. In
Personal Wireless Communications, Lecture Notes in
Computer Science. 2003.
[8] Y. Chen, D. Lymberopoulos, J. Liu, and B. Priyantha.
Fm-based indoor localization. InThe 10th
International Conference on Mobile Systems, Applications, and Services, MobiSys’12, 2012.
[9] Y. Chen, D. Lymberopoulos, J. Liu, and B. Priyantha.
Indoor localization using fm signals.IEEE
Transactions on Mobile Computing, 12(8):1502–1517,
2013.
[10] J. Chung, M. Donahoe, C. Schmandt, I.-J. Kim, P. Razavai, and M. Wiseman. Indoor location sensing
using geo-magnetism. InMobiSys, 2011.
[11] V. Dentamaro, D. Colucci, and P. Ambrosini. Nextome: Indoor Positioning and Navigation System.
http://www.nextome.org/index.php.
[12] S.-H. Fang, J.-C. Chen, H.-R. Huang, and T.-N. Lin. Metropolitan-scale location estimation using fm radio
with analysis of measurements. InIWCMC, 2008.
[13] A. S. Ferraz, A. G. Alvino, L. Q. L. Martins, and P. A. Bello. Ubee.in: An Indoor Location solution for mobile devices. Technical report, Microsoft Indoor Localization Competition, 2014.
[14] A. Ghose, V. Chandel, A. K. Agrawal, A. Kumar, N. Ahmed, and C. Bhaumik. Smartevactrak: A people counting and coarse-level localization solution for
efficient evacuation of large buildings. InPervasive
Computing and Communications Workshops (PERCOM Workshops), 2015 IEEE International
Conference on. IEEE, 2015.
[15] A. Haeberlen, E. Flannery, A. M. Ladd, A. Rudys, D. S. Wallach, and L. E. Kavraki. Practical robust localization over large-scale 802.11 wireless networks.
InMobiCom, 2004.
[16] T. V. Haute, E. D. Poorter, J. Rossey, I. Moerman, V. Handziski, A. Behboodi, F. Lemic, A. Wolisz,
N. Wistr¨om, T. Voigt, P. Crombez, P. Verhoeve, and
J. J. de las Heras. The EVARILOS Benchmarking Handbook: Evaluation of RF-based Indoor
Localization Solutions. InMERMAT 2013, 5 2013.
[17] Z. Jiang, J. Zhao, J. Han, S. Tang, J. Zhao, and W. Xi. Wi-fi fingerprint based indoor localization
without indoor space measurement. InMobile Ad-Hoc
and Sensor Systems (MASS), 2013 IEEE 10th
International Conference on, pages 384–392, Oct 2013.
[18] Z. Jiangy, W. Xiy, X.-Y. Li, J. Zhaoy, and J. Hany. HiLoc: A TDoA-Fingerprint Hybrid Indoor Localization System. Technical report, Microsoft Indoor Localization Competition, 2014.
[19] J. Krumm, G. Cermak, and E. Horvitz. Rightspot: A novel sense of location for a smart personal object. In
UBICOMP, 2003.
[20] P. Lazik and A. Rowe. Indoor pseudo-ranging of
mobile devices using ultrasonic chirps. InProceedings
of the 10th ACM Conference on Embedded Network
Sensor Systems, SenSys ’12, pages 99–112, New York,
NY, USA, 2012. ACM.
[21] F. Lemic, J. B¨usch, M. Chwalisz, V. Handziski, and
Location-Based Services (UPINLBS’14), November 2014.
[22] C.-L. Li, C. Laoudias, G. Larkou, Y.-K. Tsai, D. Zeinalipour-Yazti, and C. G. Panayiotou. Indoor Geolocation on Multi-sensor Smartphones. In Proceeding of the 11th Annual International Conference on Mobile Systems, Applications, and
Services, MobiSys ’13. ACM, 2013.
[23] L. Li, P. Hu, C. Peng, G. Shen, and F. Zhao. Epsilon:
A Visible Light Based Positioning System. In11th
USENIX Symposium on Networked Systems Design
and Implementation (NSDI 14), pages 331–343,
Seattle, WA, Apr. 2014. USENIX Association. [24] L. Li, C. Zhao, G. Shen, and F. Zhao. Indoor
Localization with Multi-modalities. Technical report, Microsoft Indoor Localization Competition, 2014. [25] A. Marcaletti, M. Rea, D. Giustiniano, and
V. Lenders. WINS: Tracking of Mobile Devices with WiFi Time-Of-Flight. Technical report, Microsoft Indoor Localization Competition, 2014.
[26] A. Matic, A. Popleteev, V. Osmani, and
O. Mayora-Ibarra. Fm radio for indoor localization
with spontaneous recalibration.Pervasive Mob.
Comput., 6, December 2010.
[27] V. Moghtadaiee, A. G. Dempster, and B. Li. Accuracy indicator for fingerprinting localization systems. In
Proceedings of PLANS, IEEE/ION, 2012.
[28] V. Moghtadaiee, A. G. Dempster, and S. Lim. Indoor localization using fm radio signals: A fingerprinting
approach. InInternational Conference on Indoor
Positioning and Indoor Navigation (IPIN), 2011.
[29] V. Moghtadaiee, A. G. Dempster, and S. Lim. Indoor positioning based on fm signals and wi-fi signals. In
Proceedings of IGNSS Symposium, 2011.
[30] L. M. Ni, Y. Liu, Y. C. Lau, and A. P. Patil. Landmarc: indoor location sensing using active rfid.
Wirel. Netw., 10, November 2004.
[31] V. Otsason, A. Varshavsky, A. L. Marca, and E. de Lara. Accurate gsm indoor localization. In
UbiComp, 2005.
[32] G. Pirkl and P. Lukowicz. Robust, low cost indoor positioning using magnetic resonant coupling. In Proceedings of the 2012 ACM Conference on
Ubiquitous Computing(Ubicomp-2012), pages 431–440.
ACM, 2012.
[33] A. Popleteev.Indoor positioning using FM radio
signals. PhD thesis, University of Trento, April 2011. [34] A. Popleteev, V. Osmani, and O. Mayora.
Investigation of indoor localization with ambient fm
radio stations. InProceedings of PerCom, 2012.
[35] K. Prieditis, I. Drikis, and L. Selavo. Santarray: passive element array antenna for wireless sensor
networks. InProceedings of the 8th ACM Conference
on Embedded Networked Sensor Systems, pages
433–434. ACM, 2010.
[36] N. B. Priyantha, A. Chakraborty, and
H. Balakrishnan. The cricket location-support system.
InMobicom, 2000.
[37] R. Reimann, A. Bestmann, and M. Ernst. Locating Technology for AAL Applications with Direction Finding and Distance Measurement by Narrow
Bandwidth Phase Analysis. InEvaluating AAL
Systems Through Competitive Benchmarking, volume
362 ofCommunications in Computer and Information
Science, pages 52–62. Springer Berlin Heidelberg, 2013.
[38] V. Sark and E. Grass. Software Defined Radio for Time of Flight Based Ranging and Localization. Technical report, Microsoft Indoor Localization Competition, 2014.
[39] T. Schmid and D. Lee. High Resolution Indoor RF Ranging. Technical report, Microsoft Indoor Localization Competition, 2014.
[40] S. Sen, B. Radunovic, R. R. Choudhury, and T. Minka. Precise indoor localization using phy layer
information. InProceedings of HotNets, 2011.
[41] S. Sen, B. Radunovic, R. R. Choudhury, and T. Minka. You are facing the mona lisa: spot localization using phy layer information. In Proceedings of MobiSys, 2012.
[42] S. Szymczak, T. Jankowski, and M. Nikodem. Underground GPS (UGPS) - precondition for location
based services underground. InInnowacyjne techniki i
technologie dla g´ornictwa: bezpiecze´nstwo -efektywno´s´c - niezawodno´s´c, pages 33–41. Instytut
Techniki G´orniczej KOMAG, 2014.
[43] S. P. Tarzia, P. A. Dinda, R. P. Dick, and G. Memik. Indoor localization without infrastructure using the
acoustic background spectrum. InMobiSys, 2011.
[44] A. Varshavsky, E. de Lara, J. Hightower, A. LaMarca,
and V. Otsason. Gsm indoor localization.Pervasive
Mob. Comput., 3, December 2007.
[45] H. Wang, S. Sen, A. Elgohary, M. Farid, M. Youssef, and R. R. Choudhury. No need to war-drive:
Unsupervised indoor localization. InProceedings of the
10th International Conference on Mobile Systems, Applications, and Services, MobiSys ’12, pages 197–210, New York, NY, USA, 2012. ACM.
[46] R. Want, A. Hopper, V. Falc˜ao, and J. Gibbons. The
active badge location system.ACM Trans. Inf. Syst.,
10, January 1992.
[47] Z. Xiao, H. Wen, A. Markham, and N. Trigoni. Lightweight map matching for indoor localization
using conditional random fields. InThe International
Conference on Information Processing in Sensor
Networks (IPSN’14), Berlin, Germany, 2014.
[48] A. Youssef, J. Krumm, E. Miller, G. Cermak, and E. Horvitz. Computing location from ambient fm
radio signals. InIEEE WCNC, 2005.
[49] M. Youssef and A. Agrawala. The horus wlan location
determination system. InMobiSys, 2005.
[50] C. Zhang, J. Luo, and J. Wu. A Dual-Sensor Enabled Indoor Localization System with Crowdsensing Spot
Survey. InProc. of the 10th IEEE DCOSS, pages
75–82, 2014.
[51] H. Zou, X. Lu, H. Jiang, and L. Xie. A fast and precise indoor localization algorithm based on an
online sequential extreme learning machine.Sensors,
15(1):1804–1824, 2015.
[52] H. Zou, L. Xie, Q.-S. Jia, and H. Wang. Platform and algorithm development for a rfid-based indoor
positioning system.Unmanned Systems,