The role of human factors in the distribution of
mercury in the metropolitan area of Karun and
Arvand River
Mohammad Reza Ammeri*, Yadollah Nikpour, Kamal Ghanemi
Department of Marine Chemistry, Faculty of Marine Science, Khorramshahr University of Marine Science and Technology, P.O. BOX 669, Khorramshahr, Iran
Corresponding authoremail: [email protected]
ABSTRACT: The aim of this research was to examine the connection of possible external factors, such as industrial units, customs, municipal wastewater, return of agricultural and industrial effluents and fish markets, to the distribution of total mercury in water, sediment, and pore water in seven stations of Karun and Arvand River which are located in the metropolitan area of the city of Khorramshahr and Abadan. Sampling was conducted from the seven selected stations in November 1392. The samples were taken based on the standard sampling principles and then the amount of mercury was determined by Cold Vapor Atomic Absorption spectrometry (CVAAS). The results showed that the average amount of mercury in water, sediment, and pore water of all stations was relatively higher than international standards. In addition, the percentage of mercury was higher in the stations adjacent to the industrial units than the other stations.
Key words: Mercury, Karun River, Arvand River, sediment, water, Cold Vapor Atomic Absorption spectrometry (CVAAS).
INTRODUCTION
Several definitions are usually applied to the contamination of surface water; in most of which, the most emphasis is on human factors and also on the deleterious effects of waste (1). In general, high levels of heavy metals can be derived from multiple sources, including air, soil and water and then enter into aquatic ecosystems by various processes (2-5). But the major part of heavy metals entering the aquatic environment are produced by various human activities. Certainly human activities in coastal and marine areas, including industry, exploration and mining, shipping, fishing, agriculture, etc. produce debris that may contain high amounts of heavy metals (6).
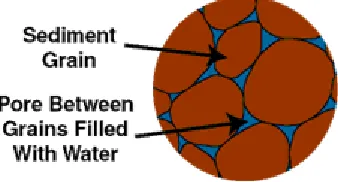
Metals entering the aquatic environments are dissolved in water or they are connected to suspended particles. If these suspended particles settle, a high concentration of elements will be aggregated in sediments (7). Since heavy metals are not decomposed by organisms or by physical and chemical processes, the increase of these material will make the environment toxic (8). Therefore, to determine the amount of heavy metals and their biological availability in coastal and marine environments, biological monitoring programs are required. These programs can play an important role in their control, and any efforts to regulate the effects of pollution, without the estimation of the amount of heavy metals, will fail (9).
Among the metals having environmental pollution, mercury enters into marine environments naturally and by human activities (10). In aqueous environments, under normal conditions of pH and temperature, mercury may be methylated by chemical or biological processes or both. All the mercury that has been discharged into the rivers, gulfs, or estuaries in the forms of elemental mercury, inorganic mercury compounds, phenyl mercury or alkoxy alkyl mercury can be converted to methyl mercury compounds by natural processes. Finding that certain microorganisms are capable of converting organic and inorganic forms of mercury into methyl mercury and dimethyl mercury with high toxicity reveals that any form of mercury is extremely dangerous to the environment (11, 12). Synthesis of methyl mercury by bacteria, found in inorganic mercury compounds in sea water or in sediments, is the main origin of this molecule in aqueous environments (13). The process can occur under both aerobic and anaerobic conditions, but it seems that anaerobic conditions are preferable (14).
54
Figure 1. pore water
In a study which was conducted by Christian Gagnon et al in 1995 on the behavior of methylmercury in sediments rich in organic matter in the Saguenay Riverbank in Quebec, Canada, the relationship between the concentration of iron and dissolved methylmercury was reported as such: the minimum concentration of both species exist at the oxidized sediment surface, while in the areas without oxygen, high levels of methyl mercury were measured up to 10 ng (15). No credible report has been published about the existence of methyl mercury in pore water of marine sediments. However, the result of a study on the pore water of coastal sediments of several lakes has reported the concentration of about 2.5 ng per liter at 3 cm depth of sediment (16). In oxidized sediments, a substantial part of the mercury is absorbed on the iron oxides; and when it is buried in the sediment, it revives and then it is released in pore water (17). Since each river has a certain capacity for the acceptance of entering pollutants, the qualitative and environmental evaluation of these resources is important nowadays. Because rivers are one of the major sources of water for various uses such as agriculture, industry and drinking. Karun and Arvand Rivers are the main rivers of the region. Given the importance of these channels and the drought in recent years, the preservation of these resources is an important task. In one hand, these sources have been considered as the place for the discharge of sewages, the wastewater of the plants and the agricultural drainage. On the other hand, construction and commissioning of large and small industrial factories and workshops in many parts of Khuzestan province around Karun River, without conducting any study on the wastewater treatment, import much pollution into the river.
Despite the extreme importance of these rivers in obviating the needs of industries, urban centers and agricultural lands, several pollutions have entered into these water resources that increase the improvement and treatment costs of the river water for various uses.
Therefore, the analysis and control of heavy metals in Karun and Arvand rivers are of special need. Accordingly, by evaluation and determination of the concentration of mercury in sediment, water, and pore water in different stations located in the metropolitan area of Khorramshahr and Abadan cities, we try to specify its possible connection to the adjacent industries, facilities and centers.
The study area Karun River
Karun River in Khuzestan province is one of the longestand largest rivers by discharge of water in the country. It supplies the water for most of the small and large industries, 70% of irrigated lands and 75% of the population. It is also the place for the discharge of hundred million cubic meters of industrial, agricultural, urban and hospital wastewater. This issue has provided the increasing pollution conditions of the river to a variety of pollutants such as toxic and hazardous heavy metals. Some pollutants of the river that passes through the city of Khorramshahr include: Heavy metals that exist in Khorramshahr soap factory wastewater, which is located near Karun River; Shipbuilding industry and marine engineering complex that is responsible for the construction of oil rigs; the wastewater of Khorramshahr Marine Customs, which is located at the intersection of Arvand and Karun rivers; the wastewater of hospital and municipal sewage treatment facilities; the traffic and stop of recreational, commercial, and fishing vessels in the river and its ports; agricultural pesticides in the water returned from the streams to the river (Khuzestan Environmental Protection Agency).
Arvand River
55 Petroleum hydrocarbons caused by ships and oil pipelines, ship ballast water, oil refineries facilities, petrochemical industries, oil terminals and vessels wastes, chemicals formed by the activities of Abadan refinery and petrochemical company which are located along Arvand Rud, solid waste includes household and food waste, the discharge of plant sewages without treatment or with little treatment located in industrial towns, natural accumulation of sand and dust particles and atmospheric dust, the discharge of water with high salinity from desalination plants, Dredging of sediments that cause the release of pollutants and can contaminate the surrounding habitat with one or more pollutants (Khuzestan Environmental Protection Agency).
In this study, mercury is taken into consideration as a toxic element that can be stored in aquatic tissue. The amount of mercury was determined at five stations of Karun River and two stations of Arvand Rud, by atomic absorption spectrometry using cold vapor system. Sampling of water, sediment and pore water from the seven districts located in the metropolitan area was conducted on November 1392 (table 1)
Table 1. Geographic location and characteristics of the studied stations
Station The area characteristics Geographic coordinates
One (Karun) Adjacency to soap factories, farms and
municipal wastewater treatment facility
N ״ 8 / 63 ׳ 63 ° 63 E58° 26׳ 45/6״
Two (karun) Adjacency to the entry of water returned
from the palm irrigation canals, and the activities of recreational boats
N ״ 6 / 88 ׳ 64 ° 63 E ״ 8 / 35 ׳ 26 ° 58
Three (Karun) Adjacency to the Khorramshahr fish
market, and traffic and docking of fishing boats N ״ 7 / 36 ׳ 63 ° 63 E ״ 6 / 38 ׳ 22 ° 58
Four (Karun) Adjacency to the Khorramshahr
shipbuilding facilities near its new bridge
N ״ 6 / 74 ׳ 64 ° 63 E ״ 6 / 67 ׳ 23 ° 58
Five (Karun) Khorramshahr marine customs area,
Karun River entry to the Arvand Rud
N ״ 3 / 33 ׳ 64 ° 63 E ״ 3 / 87 ׳ 38 ° 58
Six (Arvand Rud) Adjacency to the dock which is opposite
the main gate of Abadan Refinery
N ״ 6 / 24 ׳ 63 ° 63 E ״ 5 / 27 ׳ 23 ° 58
Seven (Arvand Rud) Adjacency to the place of Abadan
municipal wastewater discharge, and traffic and docking of fishing boats
N ״ 8 / 64 ׳ 28 ° 63 E ״ 6 / 37 ׳ 27 ° 58
MATERIALS AND METHODS
Sampling of sediments was conducted in the selected stations by bottom sampler (Grab Van Vienna). For sampling of surface water, anywhere in the selected stations, 3 repetitions of surface water with depth of (0-15) cm were taken. All samples were transferred to 5.0 liter polyethylene containers, and they were transported to the laboratory in an ice box. To prevent the absorption of mercury by the container, immediately after sampling, the solution of potassium dichromate dissolved in concentrated nitric acid was prepared in the ratio of 1: 1 and 5 ml liter it was added to the container per liter. A day after the transport of sediments to the laboratory, an amount of sediment from each station was centrifuged separately at 2500 rpm for 15 minutes. Then the separated water was poured into polyethylene containers as pore water. After the transport of sediments to the laboratory, their debris and coarse materials were removed at first. Then the required amount of sediment for each station was put in the oven at the temperature of 55 ° C for 24 hours to dry completely. Dried samples were placed in glass containers until chemical digestion. Then they were crushed into a powder by a glass mortar. The amount of 5.0 g of sediment was removed and placed in a 250 ml round flask that was connected to the refrigerant. 4 ml of a mixture of concentrated nitric acid, with the purity of 65%, and hydrochloric acid, with the purity of 37%, was added to the sediment powder with the ratio of 3: 1. (1 ml of concentrated nitric acid and 3 ml of hydrochloric acid). The complete digestion of samples was carried out at the temperature of 80 ° C till the color of samples became transparent. Then the samples were filtered using a filter paper, the materials were collected, and their volume was increased to 25 mL with distilled water. Three control samples were prepared separately for the sediment samples, in the same condition and with the same ratio of acid and distilled water. For the analysis of water samples, 50 ml of water sample were poured into a 100 mL flask, then 5 ml of concentrated sulfuric acid with the purity of 98% and 5 mL of concentrated nitric acid and 15 ml of KMnO4 were added and they were placed at room temperature. Then
10 ml of K2S2O8 were added to them and they were placed in water bath at 95 ° C for 2 hours. After cooling, 5 ml of
56 solution was injected into the CV-AAS machine with three replications, based on the injection method. The standard curve as linear equation of y = 0.0032x -0.0147 (r2=0.995), and concentration (x) in μg/g were calculated and plotted by the method of least squares using Excel software.
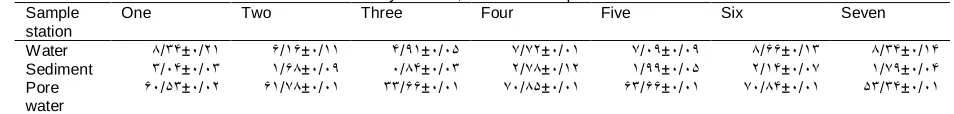
Table 2. Concentration of mercury in water, sediment and pore water of the studied stations* Sample
station
One Two Three Four Five Six Seven
Water 8/65±3/62 3/23±3/22 5/82±3/34 7/76±3/32 7/38±3/38 8/33±3/26 8/65±3/25 Sediment 6/35±3/36 2/38±3/38 3/85±3/36 6/78±3/26 2/88±3/34 6/25±3/37 2/78±3/35 Pore
water
36 / 3 ± 46 /
33 32/78±3/32 66/33±3/32 73/84±3/32 36/33±3/32 73/85±3/32 46/65±3/32
* Sediment concentration is presented based on micrograms per gram of dry weight, water and pore water concentration is based on ng ml
RESULTS
The measurement results are presented in table 2, divided by the concentration of mercury in water, sediments, and pore water. The highest concentration of mercury in sediment was related to the station No. 1; it’s the location of entry of Karun to the studied area, after passing along the various facilities in industrial town. The station is adjacent to arable lands, water and wastewater treatment site and soap factory of Khorramshahr. According to studies conducted in 1389 by Iran department of environment, about the effect of the wastewater of Khorramshahr soap factory on the quality of Karun water, the pH of the wastewater was reported about 12.56. Given the increased transfer of mercury from water to sediment under increased alkalinity, high concentrations of mercury in sediment of the station can be linked to this issue. Comparison of the average concentration of mercury in pore water of various stations showed significant differences. Stations No. 4 and 6, with the highest concentration of mercury in pore water, were the most polluted stations. The reason for high concentration of mercury in pore water in these stations cannot be evaluated from the same point. Because station No. 4, whose sampling was conducted around Khorramshahr new bridge and shipbuilding facilities, compared to station No. 6, whose sampling was done around Abadan refinery dock, is in contact with fewer pollution sources. Therefore, as we explained earlier about the effect of iron on the transfer of mercury from water to the sediment and pore water, the abundance of this metal around the facilities can be regarded as a reason for the increase of its absorption in the pore water. The results showed that the proportion of mercury in water of stations 6 and 7 was more than that in the other stations. This difference can be attributed to the continuous and non-stop entry of mercury pollutants to the water of these stations and to the slight chance of their precipitation during the day due to numerous traffic of vessels.
CONCLUSION
57 sediment is due to the constant bubbling and mobility of water in this area, which reduce the possibility of the settling of heavy pollutant metals.
Suggestion
The present study showed that the main factors that cause the pollution along these two rivers include the return of agricultural, industrial, and municipal effluents. Sudden discharges by upstream industries, increased use of chemical fertilizers and illegal aquaculture are among the other factors that cause Karun cross-pollution. Statistical results showed that the amount of mercury pollution, both in sediments and in pore water, was much higher than the mentioned standards. Therefore, considering the limited self-refining capacity of the rivers and the importance of drinking water and the effects of heavy metals on human health, it is proposed that all industries, manufacturing plants and natural and human pollution resources which are in glen be examined; and effluents of the nearby industries be sampled as far as possible, so that the main causes of water pollution at each station and area can be determined. Also it is recommended that in future researches, by increasing the number of stations and decreasing the sampling period, physical and chemical parameters of water and oil pollution indicators be measured and examined.
REFERENCES
Agarval SK. 2005. Environmental monitoring. A.P.H. publishing corporation. New Delhi–110002.
Boudou A, Delnomdedieu M, Georgescauld D. 1991. Fundamental roles of biological barriers in mercury accumulation and transfer in freshwater ecosystems. Water Air Soil Pollut. 56: 807-821
Caussy D, Gurzau DM, Neagu C, Ruedel H. 2003. Ecotoxicology and lessons from case studies of metals: investigating exposure, bioavailability, and risk. Environmental safety 56, 45-51.
Clark RB. 1999. Marine pollution. Oxford university press, 320.
Clarkson T. 1997.The toxicology of mercury. Crit Rev Clin Lab Sci. 1997;34:369-403.
Compeau G, Bartha R. 1987. Effect of salinity on mercury methylating activity of sulfate reducing bacteria in estuarine sedim ents. Applied and Environmental Microbiology, 3, 261–265.
Cossa D, Laurier FJG, Ficht A. 2002. Mercury contamination in the Seine estuary, France: an overview. In: Cai, Y., Braids, O.C. (Eds.), Biogeochemestry of Environmentally Important Elements. American Chemical Society, Washington, DC, pp. 298–320 (Chapter 20). Evans RL, Miller MC. 2006. Nutrients, eutrophic response, and fish anomalies in the Little Miami River, Ohio. Ohio Jurnal Science 106, 146–
155.
Gagnon C, Pelletier E, Mucci A, Fitzgerald WF. 1995. Diagenetic behavior of methylmercury in organic-rich coastal sediments du fjord du Saguenay. Ph.D. thesis, Univ. Quebec at Rimouski.187 p.
Gobeil C, AND D. Cossa. 1993. Mercury in sediments and sediment pore water in the Laurentian Trough. Can. J. Fish. Aquat. Sci . 50: 1794-1800.
Gunsen U. 2004. The residue levels of some toxic metals in different fish species. Indian Veterinary jurnal 81, 1339-1341.
Kutlu T, Karagozler AA, Gozukara EM. 2006. Relationship among placental Cd, Pb, Zn and Cu levels in smoking pregnant women. Biology Trace element research 114, 7-17.
Mason RP, Fitzgerald WF. 1990. Alkylmercury species in the equatorial Pacific. Nature 347: 457-459.
Sharma P, Pe´rez D, Va´zquez J, Toscano A, Gutie´rrez R. 2007. First example of antimoniated Schiff bases: Hypervalent Sb N(sp2) bonds. Inorganic Chemistry Communications 10, 389–392.
Szentmihalyi K, Fodor M, Kotai J, Blazovics L, Somogyi A, Then A. 2006. In vitro study of elements in herbal remedies. Biology Trace metal research 114, 143-150.
U.S. Environmental Protection Agency. 2001. Collection of interstitial water, in Methods for collection, storage and manipulation of sediments for chemical and toxicological analyses--Technical manual: U.S. Environmental Protection Agency, Washington, D.C., Office of Science and Technology, 208 p.