Optimization of Knitted Fabric Comfort and UV
Protection using Desirability Function
Anindya Ghosh, PhD1, Prithwiraj Mal2, Abhijit Majumdar, PhD3, Debmalya Banerjee, PhD4
1
Government College of Engineering and Textile Technology, Berhampore, West Bengal INDIA
2
National Institute of Fashion Technology, NIFT Campus, Opposite Hi-Tech City, Madhapur Hyderabad INDIA
3
Indian Institute of Technology Delhi, New Delhi, Delhi INDIA
4
Jadavpur University, Kolkata, West Bengal INDIA
Correspondence to
Prithwiraj Mal email: [email protected]
ABSTRACT
The present study deals with the optimization of multiple quality parameters of single jersey and 1×1 rib knitted fabrics using the desirability function approach. Comfort properties such as air permeability, thermal conductivity and safety properties such as UV protection are combined to yield an ‘overall desirability’ varying from zero to one. The overall desirability has been maximized versus target values for air permeability, thermal conductivity and UV resistance. Experimental validation confirms that the proposed method can be used to design a knitted fabric with desired comfort and UV resistance characteristics.
INTRODUCTION
A porous structure is found to be more comfortable due to high breathability and permeability. Hence, knitted fabrics with porous structures have become popular as summer wear [1]. However, the heat generated by physical activity is dissipated to the atmosphere through the respiratory system and skin. Thus, in a cold climate a textile would be comfortable if it does not allow body heat to dissipate whereas in hot climatic condition, transmission of body heat is desirable. In hot climates, open fabric enhances air permeability, resulting in more heat loss through convection. Further, the open structure of a fabric reduces heat transmission through conduction. However, porous structures expose the skin to dangerous UV rays. Though a certain degree of UV exposure is required for vitamin D synthesis in human body, over exposure can result in erythema, sun-tanning, skin-cancer, etc. [2-6]. The UV resistance of textile clothing is expressed by UPF (ultraviolet protection factor), which rates the extent of sunburn protection provided by the textile.
Textiles are classified as ‘good protection’ (UPF range 15 to 24), ‘very good protection’ (UPF range 25 to 39), and ‘excellent protection’ (UPF more than 40) based on their UPF values [7, 8].
Researchers have studied various parameters affecting the comfort and UV resistance of textiles. It was inferred from various studies that the UPF of textiles depends on type of fiber, type of yarn, cover factor / tightness factor of a fabric, areal density, finishing etc. [9-14]. In contrast the comfort properties of knitted fabrics depend on such factors as air permeability, thermal conductivity, moisture management etc. depend on type of fiber, yarn structure, fabric structure i.e. porosity [15-18].
Consequently, optimization of fabric properties such as air permeability, thermal conductivity and UV resistance are basically will require adjustment of several conflicting parameters. Higher air permeability results in low thermal conductivity as well as low UPF and vice-versa. For example, cotton knitted fabrics designed for summer wear will require a balance between two conflicting parameters, air permeability and thermal conductivity for optimum comfort. Nevertheless, the UPF of the fabric should have a desired level that decides the protection from harmful UV rays. Hence, to achieve a fabric with optimum comfort as well as desired UV protection, it is necessary to optimize multiple parameters simultaneously.
quality, which comprises various mechanical properties such as areal density, bursting pressure, extensibility, dimensional stability, abrasion resistance etc. Souid et al. [22] estimated denim fabric quality using desirability function. Asim et al. [23] optimized the process parameters for simultaneous fixation of reactive printing and crease resistant finishing using desirability function. However, no study in the literature addresses the simultaneous optimization of comfort and UV resistance for textile fabrics.
In this experimental work the desirability function technique is used to determine the values of the controlled factors that yield the ‘maximum desirable’ values of fabric response parameters including air permeability, thermal conductivity and UPF, for both single jersey and 1×1 rib knitted fabrics.
MATERIALSANDMETHODS
Materials
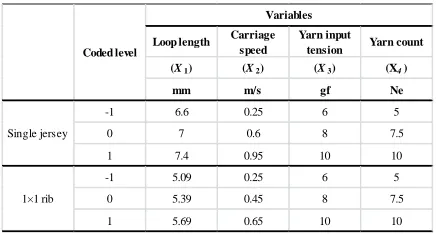
Yarns spun with one hundred percent cotton fibers were used to prepare single jersey and 1×1 rib knitted fabric samples by choosing four factors: loop length (X1), carriage speed (X2), yarn input tension (X3) and
yarn count (X4) each at three different levels. The
coded level and the actual level of the factors are shown in Table I.
TABLE I. Actual values of the factors corresponding to their coded levels.
A total of thirty six single jersey and thirty six 1×1 rib knitted fabric samples were prepared in a 12 gauge computerized flat knitting machine as the per 4-factor-3-level orthogonal block Box and Behnken experimental design [24] illustrated below.
�
±1 ±1 ± 0
±1 ±1 0 ±1
±1 0 ±1 ±1
0 ±1 ±1 ±1
�
Testing
All the seventy two knitted fabric samples were washed in a Washcator washing machine for complete relaxation per EN ISO 6330 [25]. The samples were then conditioned at standard atmospheric conditions for 48 hours. The samples were subsequently evaluated for air permeability, thermal conductivity and UPF. For each sample, 10 readings were taken for air permeability, thermal conductivity and UPF and their average values were determined.
Air permeability testing was conducted using a TEXTTEST FX3300 air permeability tester per ASTM D737 [26]. A pressure gradient of 100 Pa was maintained across the fabric samples during the test.
Thermal conductivity testing was conducted using an Alambeta instrument per ISO EN 31092 [27]. The measuring head temperature and contact pressure were maintained at 32ºC and 200 Pa respectively.
UPF testing was conducted using a Labsphere 2000F and was determined by the in-vitro method per AATCC 183:2004 [28]. The UPF of a fabric sample was calculated using the following equation.
𝑈𝑈𝑈𝑈𝑈𝑈= ∑400290𝐸𝐸(𝜆𝜆)𝑆𝑆(𝜆𝜆)Δ(𝜆𝜆)
∑400𝐸𝐸(𝜆𝜆)𝑆𝑆(𝜆𝜆)T(𝜆𝜆)Δ(𝜆𝜆)
290 (1)
Where E(λ) is the relative erythemal spectral effectiveness, S(λ) is the solar spectral irradiance [W/m2nm], Δλ is the measured wavelength interval [nm] and T(λ) =is the average spectral transmittance of the sample.
Response Surface Equations
A quadratic regression equation model used to relate various independent factors including loop length, carriage speed, yarn input tension, yarn count with air permeability, thermal conductivity and UPF. Eq. (2) shows the general form of the model:
(2)
Where, Y is the dependent variable, X1, X2, X3 and X4
are the inputs to the model and α0, α1, α2, α3,... α14 are
the regression coefficients. In the fitted regression equations only the regression coefficients which are significant at 95% confidence limits are considered.
Loop length Carriage speed
Yarn input
tension Yarn count
(X1) (X2) (X3) (X4)
mm m/s gf Ne
-1 6.6 0.25 6 5
0 7 0.6 8 7.5
1 7.4 0.95 10 10
-1 5.09 0.25 6 5
0 5.39 0.45 8 7.5
1 5.69 0.65 10 10
Coded level
Variables
Single jersey
Desirability Function
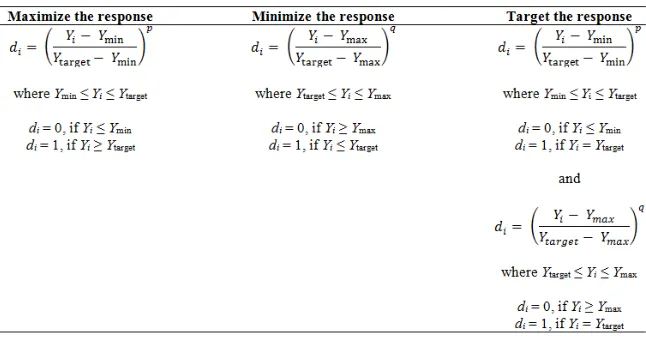
A desirability function (di) is defined individually for
each response parameter including targets and boundaries. The desirability functions with different targets and boundaries are shown in Figure 1. There
are three types of targets: maximum response, minimum response and target response. Equations defining each type of response are expressed in Table II.
FIGURE 1. Desirablity function to (a) maximize; (b) minimize; (c) reach a target value
The exponents’ p and q in the Table II determine the degree of importance of hitting target value. The desirability function approaches linear for p = q = 1. The desirability function is convex for p < 1, q < 1 and is concave for p > 1, q > 1.
The divalues are combined to calculate the ‘overall
desirability function’ for optimization. The equation of ‘overall desirability function’ is manifested in the following equation:
𝐷𝐷= ��𝑑𝑑1𝑤𝑤1 × 𝑑𝑑2𝑤𝑤2 × … .× 𝑑𝑑𝑛𝑛𝑤𝑤𝑛𝑛�
𝑤𝑤
(3)
Where 𝑤𝑤= ∑ 𝑤𝑤𝑖𝑖, 𝑤𝑤𝑖𝑖 is the weight of ith response and n is the number of responses. Both the ‘individual desirability function’ and ‘overall desirability function’ have a range from ‘zero’ to ‘one’. A desirability of ‘zero’ corresponds to a completely undesirable property whereas a value of ‘one’ indicates an ideal response value.
TABLE II. Expressions of desirability functions for different target values.
RESULTS AND DISCUSSION
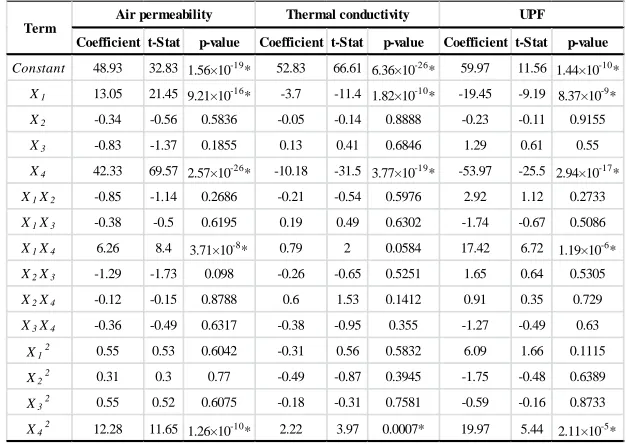
A quadratic regression model was used to relate the loop length, yarn input tension, and carriage speed and yarn count to the air permeability, thermal conductivity, and UPF for both types of fabrics. The general form of the quadratic regression model is shown in Eq. (2). Significant tests were conducted on regression coefficients of the quadratic regression models. The regression coefficients, t statistics and p-values of all the terms for single jersey and 1×1 rib knitted fabrics are shown in Table III and Table IV
\
TABLE III. Regression statistics coefficients for different response variables using coded values of the input variables for single jersey fabric.
*Statistically significant 95% confidence level
TABLE IV. Regression statistics for different response variables using coded values of the input variables for 1×1 rib fabric.
*Statistically significant 95% confidence level
Coefficient t-Stat p-value Coefficient t-Stat p-value Coefficient t-Stat p-value
Constant 134.25 26.16 1.64×10-17* 38.85 82.82 6.67×10-28* 10.05 18.9 1.16×10⁻¹⁴*
X1 22.29 10.64 6.48×10⁻¹⁰* -0.78 -4.09 0.0005* -1.69 -7.77 1.32×10⁻⁷*
X2 2.21 1.06 0.303 -0.01 -0.07 0.9486 0.19 0.88 0.3885
X3 -0.66 -0.32 0.754 -0.19 -1 0.3283 0.16 0.74 0.4694
X4 111.49 53.22 6.85×10⁻²⁴* -4.6 -24 9.34×10⁻¹⁷* -7.69 -35.4 3.29×10⁻²⁰*
X1X2 1.75 0.68 0.503 -0.43 -1.81 0.0843 -0.25 0.94 0.3579
X1X3 -0.11 -0.04 0.967 0.04 0.19 0.8538 -0.3 -1.14 0.2672
X1X4 9.6 3.74 0.001* -0.06 -0.24 0.8128 1.32 4.95 6.72×10⁻⁵*
X2X3 2.51 0.98 0.339 -0.21 -0.91 0.3752 -0.44 -1.65 0.1139
X2X4 3.84 1.5 0.15 0.41 1.76 0.0932 -0.32 -1.21 0.2405
X3X4 -0.61 -0.24 0.815 0.08 0.35 0.7325 -0.37 -1.39 0.1794
X12 -0.81 -0.22 0.826 -0.44 -1.33 0.1973 -0.24 -0.64 0.5317
X22 -4.57 -1.26 0.222 0.12 0.36 0.7193 0.69 1.83 0.081
X32 10.36 2.86 0.009* -0.22 -0.65 0.5207 -0.49 -1.31 0.2063
X42 25.94 7.15 4.76×10-7* 1.16 3.49 0.0022* 2.05 5.45 2.11×10⁻⁵*
UPF Term
Air permeability Thermal conductivity
Coefficient t-Stat p-value Coefficient t-Stat p-value Coefficient t-Stat p-value
Constant 48.93 32.83 1.56×10-19* 52.83 66.61 6.36×10-26* 59.97 11.56 1.44×10⁻¹⁰*
X1 13.05 21.45 9.21×10⁻¹⁶* -3.7 -11.4 1.82×10⁻¹⁰* -19.45 -9.19 8.37×10⁻⁹*
X2 -0.34 -0.56 0.5836 -0.05 -0.14 0.8888 -0.23 -0.11 0.9155
X3 -0.83 -1.37 0.1855 0.13 0.41 0.6846 1.29 0.61 0.55
X4 42.33 69.57 2.57×10⁻²⁶* -10.18 -31.5 3.77×10⁻¹⁹* -53.97 -25.5 2.94×10⁻¹⁷*
X1X2 -0.85 -1.14 0.2686 -0.21 -0.54 0.5976 2.92 1.12 0.2733
X1X3 -0.38 -0.5 0.6195 0.19 0.49 0.6302 -1.74 -0.67 0.5086
X1X4 6.26 8.4 3.71×10-8* 0.79 2 0.0584 17.42 6.72 1.19×10⁻⁶*
X2X3 -1.29 -1.73 0.098 -0.26 -0.65 0.5251 1.65 0.64 0.5305
X2X4 -0.12 -0.15 0.8788 0.6 1.53 0.1412 0.91 0.35 0.729
X3X4 -0.36 -0.49 0.6317 -0.38 -0.95 0.355 -1.27 -0.49 0.63
X12 0.55 0.53 0.6042 -0.31 0.56 0.5832 6.09 1.66 0.1115
X22 0.31 0.3 0.77 -0.49 -0.87 0.3945 -1.75 -0.48 0.6389
X32 0.55 0.52 0.6075 -0.18 -0.31 0.7581 -0.59 -0.16 0.8733
X42 12.28 11.65 1.26×10-10* 2.22 3.97 0.0007* 19.97 5.44 2.11×10⁻⁵*
Term
TABLE V. Response surface equations of various parameters.
It is apparent from the equations that, while the yarn count and loop length are the key factors affecting the air permeability, thermal conductivity and UPF, the carriage speed has no significant effect on these response variables in the case of both the single jersey and 1×1 rib knitted fabrics. However, the yarn input tension has little effect on the air permeability of the single jersey fabric and hence it is removed from the response surface equation. The response surface equation the air permeability of single jersey fabric was thus rewritten as:
(4)
In the present work, the objective is to achieve the target values for air permeability, thermal conductivity and UPF for both the single jersey and 1×1 rib knitted fabrics by optimizing the ‘overall-desirability’. The target values were set using data collected from literature and experience. The minimum and maximum values for air permeability, thermal conductivity and UPF were estimated from their corresponding response surface equations.
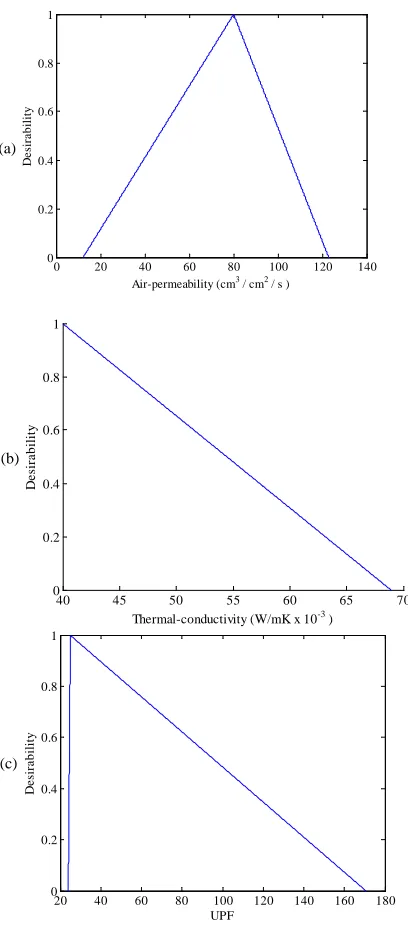
Table VI shows the target, minimum and maximum values for air permeability, thermal conductivity and UPF for both types of fabrics. To find the ‘individual desirability’ for each property, target response equations shown in the last column of Table II were used. In this study, the values of p and q were chosen as 1. The diagrams of the ‘individual desirability’ of each property of single jersey and 1×1 rib fabrics are depicted in Figure 2 and Figure 3 respectively. The ‘overall desirability’ as expressed in Eq. (3) was determined for each type of fabric using MATLAB Optimization Toolbox (version 7.7) to solve the equation for maximum values. The weight value (𝑤𝑤𝑖𝑖) was chosen as 1 which implies equal importance among responses.
TABLE VI. The boundaries and target values of different responses.
The solutions resulting from this optimization exercise are given in Table VII. In case of single jersey, the maximum ‘overall desirability’ value is estimated as 0.91 which corresponds the optimum values of 80.6, 41.3 and 15 for air permeability, thermal conductivity and UPF respectively at 6.6 mm loop length and 6.7 Ne yarn count. In the case of 1×1 rib fabric, the optimum values of air permeability, thermal conductivity and UPF are obtained as 80, 45.9 and 30.4 respectively, which yield a maximum ‘overall desirability’ value of 0.92 at 5.69 mm loop length and 8.4 Ne yarn count. The overall-desirability curve for single jersey and 1×1 rib knitted fabrics are shown in Figure 4 and Figure 5 respectively. It is also evident from Table VII that single jersey fabric and 1×1 rib knitted fabric ensure ‘good protection’ and ‘very good protection’ respectively from the UV rays, with desired values of air permeability and thermal conductivity. Moreover, for a given machine gauge and yarn count, 1×1 rib fabric provides slightly better comfort with more UV protection than single jersey fabric.
Air permeability Thermal conductivity UPF
134.25 + 22.29X1 + 111.49X4 +
9.60X1X4 + 10.36X32 + 25.94X42
38.85 – 0.78X-1 – 4.60X4 + 1.16X42
10.05 – 1.69X1 – 7.69X4 +
1.32X1X4 +2.05X42
(R2 = 0.99) (R2 = 0.95) (R2 = 0.97) 48.93 + 13.05X1 + 42.33X4 +
6.26X1X4 + 12.28X42
52.83 – 3.70X-1 – 10.18X4 + 2.22X42
59.97 – 19.45X1 – 53.97X4 +
17.42 X1X4 +19.97X42
(R2 = 0.99) (R2 = 0.97) (R2 = 0.97) Single-jersey
1×1 rib
Type of fabrics
Response variables
Fabric type Responses Lower limit Target Upper limit
Air permeability (cm3
/cm2
/s) 36.01 80 303.57
Thermal conductivity (W/mK×10-3) 34.63 40 45.39
UPF 4.04 15 22.8
Air permeability (cm3
/cm2
/s) 12.09 80 122.85
Thermal conductivity (W/mK×10-3) 41.17 40 68.93
UPF 23.94 25 170.78
Single jersey
FIGURE 2. Individual desirability function diagram of (a) air permeability, (b) thermal conductivity and (c) UPF for single jersey fabric.
FIGURE 3. Individual desirability function diagram of (a) air permeability, (b) thermal conductivity and (c) UPF for 1×1 rib fabric.
0 50 100 150 200 250 300 350
0 0.2 0.4 0.6 0.8 1
Air-permeability (cm3 / cm2 / s)
D
e
sir
a
b
ility
34 36 38 40 42 44 46
0 0.2 0.4 0.6 0.8 1
Thermal-conductivity (W/mK x 10-3)
D
e
sir
a
b
ility
0 5 10 15 20 25
0 0.2 0.4 0.6 0.8 1
UPF
D
e
sir
a
b
ility
0 20 40 60 80 100 120 140
0 0.2 0.4 0.6 0.8 1
Air-permeability (cm3 / cm2 / s )
D
e
sir
a
b
ility
40 45 50 55 60 65 70
0 0.2 0.4 0.6 0.8 1
Thermal-conductivity (W/mK x 10-3 )
D
e
sir
a
b
ility
20 40 60 80 100 120 140 160 180
0 0.2 0.4 0.6 0.8 1
UPF
D
e
sir
a
b
ility
(a)
(b)
(c)
(a)
(b)
TABLE VII. Solutions of optimization problems for single jersey and 1×1 rib fabrics.
FIGURE 4. Overall-desirability as a function of yarn count and loop length for single jersey fabric.
FIGURE 5. Overall-desirability as a function of yarn count and loop length for 1×1 rib fabric.
EXPERIMENTAL VALIDATION
The optimization model was validated by comparing optimum values and actual results. For this purpose, single jersey and 1×1 rib knitted fabric samples were made in the same 12 gauge computerized flat knitting
machine equipped with ‘digital loop control system’ to acquire the desired loop length. One hundred percent cotton yarns of 6.5 Ne (≈ 6.7 Ne) and 8.5 Ne (≈ 8.4 Ne) were used to manufacture single jersey and 1×1 rib knitted fabrics respectively. The loop length for single jersey and 1×1 rib were chosen as 6.6 mm and 5.69 mm respectively. The samples were completely relaxed by washing, conditioned and tested for air permeability, thermal conductivity and UPF per the standards listed previously. Table VIII shows the actual and calculated optimum values of air permeability, thermal conductivity and UPF for both single jersey and 1×1 rib knitted fabrics. It is evident from the Table VIII that the actual values of air permeability, thermal conductivity and UPF are very close to the calculated optimum values with an error of less than 5% in all cases for both the single jersey and 1×1 rib knitted fabrics.
TABLE VIII. Optimized and achieved fabric properties.
O = Optimized value, A= Achieved value
CONCLUSION
In this study an adaptive method was used to combine optimize key properties of knitted fabrics and yield to a single ‘overall desirability’ index which varies from 0 to 1. The overall desirability index was maximized by optimizing multiple properties such as air permeability, thermal conductivity and UV resistance against target values. Optimum values are obtained for loop length and yarn count in order to maximize the “overall desirability” and engineer a knitted fabric with desired combinations of comfort and UV resistance. The experimental results show significant agreement between the actual and calculated values of the key fabric properties. This study may lead to the development of a single point grade scale from 0 to 1 which can be used to rank knitted fabrics for target comfort and UV resistant properties.
REFERENCES
[1] Chidambaram, P., Govind, R., Venkataraman, K. C., “The effect of loop length and yarn linear density on the thermal properties of bamboo knitted fabric”, Autex Research Journal, 11, 2011, 102-105.
[2] Holick, M. F., “Resurrection of vitamin D deficiency and rickets”, Journal of Clinical Investigation, 116, 2006, 2062–2072.
Fabric type Responses
Predicted value of the response
Overall desirability
value
Solution
Air permeability (cm3/cm2/s) 80.6
Thermal conductivity (W/mK×10-3) 41.3
UPF 15
Air permeability (cm3/cm2/s) 80
Thermal conductivity (W/mK×10-3) 45.9
UPF 30.4
Single jersey
1×1 rib 0.92
0.91 X1 = 6.6 mm
X4 = 6.7 Ne
X1 = 5.69 mm X4 = 8.4 Ne
-1 -0.5 0 0.5 1 -1 -0.5 0 0.5 1 0 0.2 0.4 0.6 0.8 1
Loop-length (X1 ), mm Yarn-count (X2 ), Ne
O v er al l-des ir abi lit y 0 0.1 0.2 0.3 0.4 0.5 0.6 0.7 0.8 0.9 -1 -0.5 0 0.5 1 -1 -0.5 0 0.5 1 0 0.2 0.4 0.6 0.8 1
Loop-length (X1 ), mm Yarn-count (X2 ), Ne
O v er al l-des ir abi lit y 0 0.1 0.2 0.3 0.4 0.5 0.6 0.7 0.8 0.9
O A Error % O A Error % O A Error %
Single-jersey 80.6 83.4 3.40% 41.3 40.1 3.00% 15 15.3 1.96% 1×1 rib 80 82.9 3.50% 45.9 43.8 4.80% 30.4 29.1 4.50%
Thermal conductivity
(W/mK×10-3) UPF
Fabric type
Air permeability
[3] Pettifor, J. M., “Nutritional rickets: Deficiency of vitamin D, calcium, or both”, The American Journal of Clinical Nutrition, 80, 2004, 1725S – 1729S.
[4] Mackie, R. M., “Effects of ultraviolet radiation on human health”, Radiation Protection Dosimetry, 91, 2000, 15-18.
[5] Gallagher, R. P., Lee, T. K., “Adverse effects of ultraviolet radiation: A brief review”, Progress in Biophysics and Molecular Biology, 92, 2006, 119-131.
[6] Halliday, G. M., Norval, M., Byrne, S. N., Huang, X. X., Wolf, P., “The effects of sunlight on the skin”, Drug Discovery Today, 5, 2008, e201 – e209.
[7] ASTM D 6603-07:2007. “Standard guide for labelling of UV-protective textiles”.
[8] AS/NZS 4399:1996. “Sun protective clothing – evaluation and classification”.
[9] Das, B. R., “UV radiation protective clothing”, Open Textile Journal, 3, 2010, 14-21. [10] Majumdar, A., Kothari, V. K., Mondal, A. K..,
Hatua, P., “Effect of weave, structural parameters and ultraviolet absorbers on in-vitro protection factor of bleached cotton woven fabrics”, Photodermatology, Photoimmunology & Photomedicine, 28, 2008, 58– 67.
[11] Algaba, I. M., Pepio, M., Riva, A., “Correlation between the ultraviolet protection factor and the weight and thickness of undyed cellulosic woven fabrics”, Fibres & Textiles in Eastern Europe,16, 2008, 85 – 89.
[12] Algaba, I., Riva, A., “Influence of fibre type and fabric porosity on the UPF of summer fabrics”, AATCC Review, 2004, 26 – 31. [13] Morihiro, Y., Eri, F., Chie, T., “Effects of fiber
materials and fabric thickness on UV shielding properties of fabrics”, Journal of Textile Engineering, 55, 2009, 103 – 109. [14] Hang-kei, S. C., Chi-wai K., Jimmy, K. L.,
Sun-pui, N., Hong, H., Chun-wah, M. Y., “Study on the relationship between UV protection and knitted Fabric Structure, Journal of Textile Engineering, 59, 2013, 71-74.
[15] Onofrei, E., Rocha, A. M., Catarino, A., “The influence of knitted fabrics’ structure on the thermal and moisture management properties”, Journal of Engineered Fibers and Fabrics, 6, 2011, 10-22.
[16] Ramachandran, T., Manonmani, G., Vigneswaran, C., “Thermal behavior of ring – and compact – spun yarn single jersey, rib and interlock knitted fabrics”, Indian Journal for Fibre & Textile Research, 35, 2010, 250-257.
[17] Oglakcioglu, N., Marmarali, A., “Thermal comfort properties of some knitted structure”, Fibres & Textiles in Eastern Europe, 15, 2007, 94-96.
[18] Mavruz, S., Ogulata, R. T., “Optimization of air permeability of interlock knitted fabrics using different experimental design”, Proceedings, 7th International Conference TEXSCI 2010, Liberec, Czech Republic. [19] Harrington, E. C., “The desirability function”.
Industrial Quality Control, 1965, 494-498. [20] Derringer, G. C., Suinch, R., “Simultaneous
optimization of several response variables”, Journal of Quality Technology, 12, 1980, 214-219.
[21] Taieb, A. H., Msahli, S., “Optimization of the knitted fabric quality by using multicriteria phenomenon tools”, International Journal of Fiber and Textile Research, 3, 2013, 66-77. [22] Souid, H., Babay, A., Sahnoun, M., “Fabric
quality optimization by using desirability function and neural networks”, International Journal Computer Technology & Applications, 3, 2012, 356-364.
[23] Asim, F., Mahmood, M., Siddiqui, M. A., “Optimization of process parameters for simultaneous fixation of reactive printing and crease resistant finishing using desirability function”, 7, 2012, 1-12.
[24] Dean, A., Voss, D., “Design and Analysis of Experiments”, Springer – Verlag, New York, 1999, 576-579.
[25] EN ISO 6330:2012.. “Domestic wash & dry procedures for textiles”
[26] ASTM D737:2012. “Standard test method for air permeability of textile fabrics”.
[27] ISO EN 31092:1993, “Textiles – physiological effects – measurement of thermal and water – vapor resistance under steady – state conditions (sweating guarded – hotplate test)”
[29] Ghosh, A., Mal, P., Majumdar, A., Banerjee, D., “Multi-objective optimization of knitted fabric comfort and ultraviolet radiation protection by evolutionary algorithm”, Proceedings, 4th International Conference on Soft Computing for Problem Solving, SocProS 2014, NIT Silchar, India.
[30] Majumdar, A., Mal, P., Ghosh, A., Banerjee, D., “Multi-objective optimization of air permeability and thermal conductivity of knitted fabrics with desired ultraviolet protection”, The Journal of the Textile
Institute, DOI: 10.1080/00405000.2016.1159270.
AUTHORS’ ADDRESSES Anindya Ghosh, PhD
Government College of Engineering and Textile Technology
Berhampore, West Bengal 742101 INDIA
Prithwiraj Mal
National Institute of Fashion Technology
NIFT Campus, Opposite Hi-Tech City, Madhapur Hyderabad, Telengana 500081
INDIA
Abhijit Majumdar, PhD
Indian Institute of Technology Delhi New Delhi, Delhi 110016
INDIA
Debmalya Banerjee, PhD
Jadavpur University