Nonlinear Processes in Geophysics (2004) 11: 153–163
SRef-ID: 1607-7946/npg/2004-11-153
Nonlinear Processes
in Geophysics
© European Geosciences Union 2004
Instabilities in a thin current sheet and their consequences
N. Singh
Electrical and Computer Engineering Department University of Alabama, Huntsville, Al 35899, USA
Received: 12 March 2003 – Revised: 22 January 2004 – Accepted: 4 February 2004 – Published: 13 April 2004
Abstract. Using a fully 3-D particle in-cell simulation, we studied the electrodynamics of a thin current sheet (CS). Starting with a uniform plasma and anti-parallel magnetic field, Harris equilibrium is achieved during the early stage of the simulation. In the processes of reaching the equilib-rium, both electrons and ions in the newly formed CS are energized and develop pitch-angle anisotropies. We find two distinct stages of primarily electrostatic instabilities; in the first stage the relative drift between electrons and ions drives the instability in the central regions of the CS. The electro-static fluctuations scatter electrons causing current disruption in the central region. The associated reduction in the av-erage drift velocity of the current-carrying electrons gener-ates sheared flow. The second stage of the instability begins when the drift velocity develops a minimum in the central plane. Then the shear and the growing electrostatic fluctua-tions under the condition of the maintained anti-parallel driv-ing magnetic field configuration feed each other makdriv-ing the instability explosive. The growing fluctuations create plasma clumps as the electrons and ions are progressively trapped in the large-amplitude waves. The density clumping also gener-ates clumps in the current. The non-uniform current distribu-tion causes magnetic reconnecdistribu-tion, accompanied by heating of electrons and ion at a fast rate and nearly complete bi-furcation of the current sheet. Anomalous resistivity during different stages of the evolution of the CS is calculated and compared against theory.
1 Introduction
One of the outstanding problems in plasma physics is the un-derstanding of the processes, which initiate reconnection of anti-parallel magnetic fields bounding current sheets in col-lisionless plasmas. In recent years, several studies based on 2-D particle-in-cell (PIC) simulations have been performed to unravel the kinetic processes occurring during reconnec-tion (Shay et al., 2001; Pritchet, 2001; Hesse et al., 2001). These studies have been very successful in revealing the va-riety of nonlinear processes accompanying the evolution of
Correspondence to: N. Singh
reconnection. A bibliography for studies on magnetic recon-nection is in two recent reviews by Hesse and Birn (2000) and Pritchett (2000). These 2-D kinetic studies however fail to reveal the processes, which initiate the reconnection. Over the years, it has been speculated that the reconnection might be initiated by plasma instabilities driven by the cur-rent. In order to tackle this problem 3-D kinetic simulations are needed, self-consistently including the third dimension along the current. Pritchett et al. (1996) have performed such 3-D simulations revealing the role of the drift kink instability (DKI) in the initiation process. This is an electromagnetic instability and it has been shown that it becomes ineffective for realistic electron to ion mass ratio (Daughton, 1999). Re-cently Zeiler et al. (2002) and Drake et al. (2003) reported studies using 3-D PIC simulations. However, even in these 3-D treatments aX-line was used as an initial condition to study the further evolution of reconnection, setting aside the issue of initiating reconnection by the current-driven plasma instabilities.
Lui (2000) and Kropotkin et al. (1999) have suggested that electrostatic instabilities (EI), such as the Weibel, modified two-stream and electron-acoustic modes, might initiate the reconnection process via either current disruption, genera-tion of anomalous resistivity or nonlinear coupling between EI-driven and ion tearing wave modes. Despite these initial studies, the question about initiation of reconnection has re-mained largely unsettled. Saha and Singh (1999) reported preliminary results of 3-D PIC simulations showing recon-nection occurring following the nonlinear evolution of ion modes (Fried and Gould, 1961).
in which the current at early times is primarily carried by the electrons. The electron drift is sufficiently large to drive Fried-Gould ion mode instability (Fried and Gould, 1961), which is closely related to the Buneman mode (Hasegawa, 1975). This nearly purely growing instability sets up large amplitude electrostatic fields, which scatter electrons and re-duce the current in the central region of the CS. The associ-ated reduction in the electron drift generates a shear in the electron flow. The developing shear becomes a new source of free energy for the electrostatic modes, which in turn feed the shear by further reducing the current and hence the drift velocity of the current-carrying electrons in the central CS. Thus the instability becomes explosive under the condition of the maintained anti-parallel driving magnetic field config-uration. The non-uniform current disruption in the explosive instability causes reconnection. The induced electric fields after the onset of reconnection cause electron and ion heat-ing at a rate much faster than that prior to the reconnection. Furthermore, there is nearly complete bifurcation of the CS with large current densities on either side of the central CS.
The clumping of electrons and ions in the central CS dur-ing the Buneman and shear-driven instability stages serve as scattering centers and a source of anomalous resistivity as proposed by Dupree (1970) in connection with ion-acoustic turbulence. However, we find that the purely growing shear-driven waves overwhelm any effect of anomalous resistivity driven tearing of the current sheet. The waves are by them-selves effective in clumping and tearing of the CS.
It is worthwhile to point out that there is a vast literature on instabilities in thin current sheets. Recently Silin and B¨uchner (2003a, b) studied the kinetic instabilities of thin current sheets showing that the drift-resonant instability oc-curs when the lower-hybrid-drift waves (Ozaki et al., 1996) penetrating from the outer parts of a current sheet into its cen-tral part resonantly interact with the drifting ions. They have compared and contrasted their findings with the findings of several prior studies on the topic. All theses prior studies are based on an initialized Harris equilibrium, in which ions are the major current carriers. In contrast, we deal here with a current sheet, which is continually driven by external anti-parallel magnetic fields simulating a continued forcing as in situations of nanoflares (Parker, 1972), solar flares (Priest, 1976) as well as generalized magnetic turbulence( Wu and Chang, 2000; Matthaeus et al., 2003). The induced elec-tric field in the forced situation preferentially accelerates the unmagnetized electrons in the central current sheet and they become the major current carriers as found in laboratory ex-periments (Baum and Bratenaul, 1976). We have attempted to simulate such a situation and found that during the initial stages of the evolution of the current sheet the electrostatic ion mode instabilities dominate and not the electromagnetic instabilities as found in several prior studies with the initial-ized Harris equilibrium.
The rest of the paper is organized as follows. In Sect. 2 we describe the method of simulation. Section 3 deals with setting up of the CS including its structure, acceleration of current carrying electrons and ions and their velocity
distri-bution functions. Section 4 deals with ion-mode instabilities driven by the electron drift followed by formation of shear and shear driven explosive waves. Section 5 deals with the consequences of the explosive instability. The issue of the generation of anomalous resistivity is discussed in Sect. 6. Conclusions of the paper and their relevance to space and astrophysical plasmas are discussed in Sect. 7.
2 Method of simulation
We utilize a fully 3-D electromagnetic PIC code with rela-tivistic effects included (Birdsall and Langdon, 1985). We used this code to simulate a volume of plasma given by Lx×Ly×Lz=32×32×64λ3d, where λ3d is the Debye length. The anti-parallel magnetic field is given by
B=Botanh((z−zc)/D)ax, (1)
whereBois the magnetic field at distances far away from the central planez=zc=Lz/2,Dis the scale length in the vari-ation ofBxwithz. This field in Eq. (1) is always maintained through the entire simulation time as an external source for driving the plasma. The plasma is initially uniform and it has no current in it. For the driving field in Eq. (1) starting at time t=0, the simulation self-consistently yields the Harris equi-librium (Harris, 1962). We point out here that it is not essen-tial to iniessen-tialize the simulation with Harris type of density dis-tributions at timet=0, instead the equilibrium is reached as the plasma and the fields evolve self-consistently. In the sim-ulation the grid spacing is the Debye length,λdo, in the initial plasma with a uniform densitynoand Maxwellian electrons and ions having temperatures ofTeo andTio, respectively. The ion to electron temperature ratio is 2. We incorporated periodic boundary conditions alongx andy on both parti-cles and fields. Along z we used a conducting boundary conditions for the fields while the particle boundary condi-tions were varied in different simulacondi-tions. In the simulacondi-tions described here the particles leaving the simulation box at boundariesz=0 andLzare not recirculated, instead they are replaced by new ones from the Maxwellian distributions hav-ing the same temperatures as the initial plasma loaded in the simulation box. The fields in this code are updated solving the time-dependent Maxwell’s equations (Birdsall and Lang-don, 1985), including a correction for the space-charge field (Langdon, 1992).
We performed simulations for two values of the ra-tio of velocity of light, C, to the electron thermal ve-locity, Vt eo, C/Vt eo=10 and 25 and found physically similar results. The ion to electron mass ratio was M/m=16. We chose Bo so that electron cyclotron
N. Singh: Instabilities in a thin current sheet and their consequences 155
Fig. 1. Current sheet at an early timet=50. (a) Distributions of ne(z), ni(z), Jey(z)andJiyacross the current sheet. (b) Pressure balance att∼50; distributions of magnetic (Pm), kinetic (Pk) and total (Pt) pressures.
ω−peo1, λdo, Vt eo, KbTo/eλd, mωpeo/e, and noeVt eo for time, distance, velocity, electric field, magnetic field and cur-rent, respectively. We started the simulations with 36 pairs of electrons and ions in each cell of sizeλ3d. At any time there were∼2.5×10⁶electrons and ions in the simulation box. Since we use open boundary conditions for the parti-cles atz=0 andz=Lz, this number varies a little bit (∼5%) over the course of the run. The time step wasδt=0.02ωpeo−1, which insured stability of the simulations through out the run.
3 Setting up the current sheet and its stability
As mentioned above we start the simulation without a current sheet but with a reverse magnetic field configuration applied
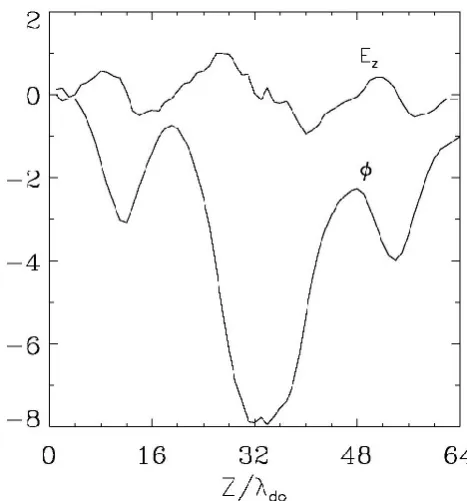
Fig. 2. Electric fieldEz(z)and potentialϕ(z)att=50 during the formation of the CS.
to quasi-neutral uniform plasma. As the simulation runs, quite soon a current sheet is self-consistently set up in the plasma. Figures 1a and 1b show the state of the current sheet at time t=50. The normalized electron (ne) and ion (ni) densities and the corresponding current densitiesJey andJiy att=50 are shown in Fig. 1a; the particle and current den-sities peak in the central planez=32. The ion current is quite small compared to the electron current. Thus the total current isJy∼=Jey. The particle density maximums are ap-proximately∼2no while the current maximum is Jym∼5. Using the Ampere’s law, the maximum current is given by Jym=Bo/µol≈(50/D) (neeV t h)=4.2(noeV t h), which matches well with the above result from the simulation (Fig. 1a). Figure 1b shows the distribution of magnetic, ki-netic and total pressure alongzat timet=50. It reveals that the state of plasma is nearly in equilibrium as the total pres-sure, which is the sum of the magnetic and kinetic pressures, is nearly constant.
Fig. 3. Electron (left panels) and ion (right panels) velocity distribu-tion funcdistribu-tions att=50. Note the electrons, which carry the current, have a velocity distributionFe(Vy)shifted toward the large negative velocities. Also note the flat-top distributionFi(Vz)for the ions.
on the average it points toward thez=0 plane. The corre-sponding potential distributionϕ(z)is also plotted in Fig. 2, showing a deep potential well for the ions centered atz=32. The evolving fields modify the electron and ion velocity dis-tribution functions. Figure 3 shows the velocity distribu-tions of electrons and ions in the CS (20< z <44) att=50. The left-hand panels show the electron distribution functions Fe(Vx), Fe(Vy) and Fe(Vz) from top to bottom, respec-tively. The corresponding ion distributionsFi(Vx), Fi(Vy) and Fi(Vz) are shown in the right-hand panels. The Vx -distributions for the electrons and ions are nearly the same as the initial ones. TheVy- andVz-distributions for the elec-trons are significantly modified; Fe(Vy) has a net drift in the negativey direction that supports the current Jy and it also appears to be heated compared toFe(Vx). F (Vz)for the electrons shows two populations; a cold one nearVz∼0 like F (Vx)and a warm one. The cold population is the initial Maxwellian and the warm one is the consequence of acceler-ation in the−ydirection followed by their cyclotron motion. As expected, theVy-distribution for the ions,Fi(Vy), has a small net drift in the positiveydirection making a small con-tribution toJy from the ions. TheVz-distribution, (Fi(Vz)), of ions is significantly modified because of the trapping of ions in the potential well shown in Fig. 2. The width of the nearly flat-top distribution in Fig. 3f is determined by the am-plitude of the potential well shown in Fig. 2. An important fact to note from the discussion here is that both ions and electrons have developed thermal anisotropies with higher effective temperatures across the magnetic field than that par-allel to it.
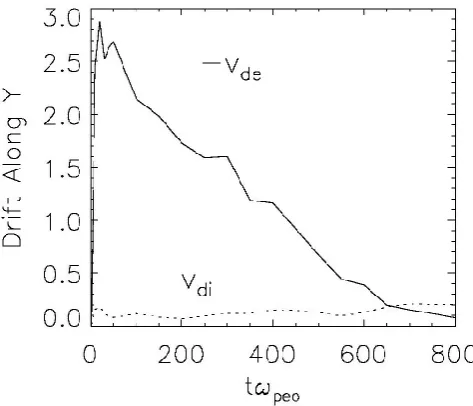
Fig. 4. Averaged drifts of (a) electrons and (b) ions lying in the central CS (31< z <33).
N. Singh: Instabilities in a thin current sheet and their consequences 157
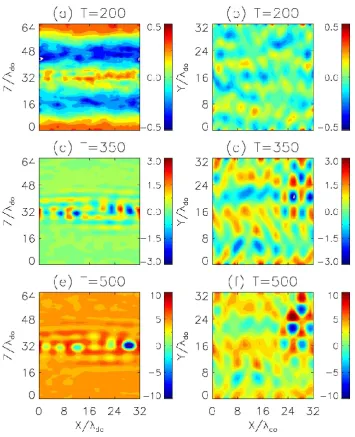
Fig. 5. Wave structures inEy(x, y=16, z)in the left column andEy(x, y, z=32)in the right column. (a)-(b)t=200, (c)-(d)t=350, and (e)-(f)t=500. Note that the wave structure is periodic in thex-yplane and it is confined inside the current CS.
not directly applicable to the numerical calculation here. We repeated the simulation by reducing the magnetic field from Bo=0.5 toBo=0.2 in Eq. (1) and thus reducing the current densityJy andVdeby a factor of∼2.5. We found that the current sheet remained stable over the time interval discussed in this paper. It is important to note that the CS forBo=0.2 becomes stable becauseVdefalls below the critical drift for the instability of ion modes found here.
4 Development of shear and explosive instability phase
The electric field fluctuations shown in Figs. 5a–d scatter electrons and begin to reduce the electron drift in the cen-tral region of the sheath. Figure 6 shows the evolution of the profile of (−Vde(z)). The profiles shown in the figure are
Fig. 6. Evolution of the profile of the electron drift velocity (−Vde(z)). Note the sheared flow with inflection points in the CS aftert∼400.
Fig. 7. Mode structure in the CS. The curves fort <400 show the mode structure driven by the ion mode instability. Note the large growth inEyfort >400 occurs when the current-carrying electrons develop the sheared flow shown in Fig. 6.
shows that fort≥400 the drift distribution has a minimum at z∼32 and maxima in the off-central regions. Such a config-uration ofVde(z), having shear and inflection points, is un-stable. Ganguli et al. (1988) and Romero et al. (1992) have shown that the free energy for wave excitation is proportional to the second derivative ofVde(z). The inflection points en-sure that the second derivative changes sign in the sheared flow as required for the instability according to Raleigh
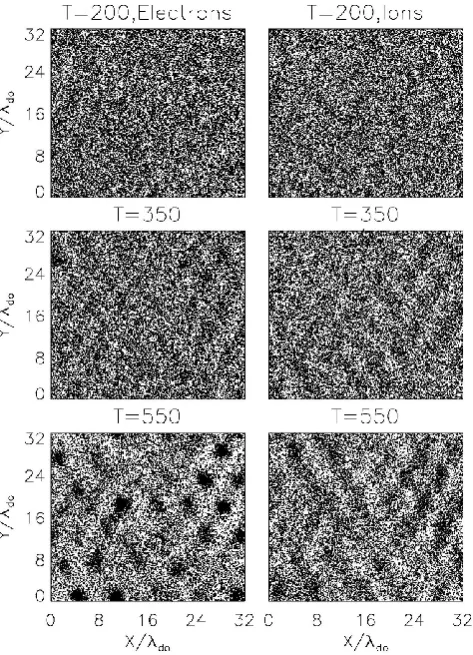
theo-Fig. 8. Spatial distribution of electrons and ion in thex-yplane. Note the formation of clumps.
rem (Mikhailovskii, 1974). Figures 5e and f show the further growth in the wave structure att=500. Figure 7 shows the growing wave mode in the CS; the oscillations inEy in the CS seen fort <400 basically represent the wave structure ap-pearing in Figs. 5a–d and they are driven by the two-stream instability. The curve fort=500 shows the beginning of the fast growing waves fed by the sheared flow in the central CS. The growing electrostatic perturbations inEy further scatter electrons and reduce the drift velocity in the central CS. This further enhances the shear and growth of the waves, making the instability explosive.
5 Consequences of the explosive instability
We describe here the plasma processes occurring in the CS after the onset of the shear formation including its fragmen-tation, magnetic reconnection and fast heating of both elec-trons and ions.
5.1 Fragmentation of plasma and the CS
N. Singh: Instabilities in a thin current sheet and their consequences 159
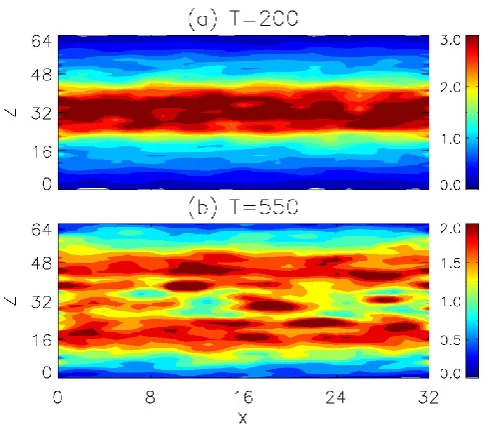
Fig. 9. Surface plots of current distribution in thex-zplane. Note that the initial CS first broadens and then bifurcates as the current disrupts in the central region.
the spatial distributions of electron and ions in thex-yplanes occupying a volume in the central CS (24< z <40). The dots in Fig. 8 represent electrons and ions and give their locations. At early times, like att=200, electrons and ions are nearly uniformly distributed. The clumps are beginning to appear at t=350 and they are fully formed by the timet=550. The main cause of the clump formation is the trapping of elec-trons in the potential wells set by the instability. Ions also clump as they are coupled to the electrons by electric fields.
The clumping of the plasma generates clumps in the cur-rent distribution. Figure 9 shows the evolution in the curcur-rent structure. The panels in Fig. 9 show the surface plots of the electron current in thex-yplane aty=9. Physically similar current distributions appear at anyy. Att=100 we see a relatively narrow current distribution as required by the im-posed magnetic field. As time increases the current sheet de-velops wavy structures, current level drops and it also broad-ens. This behavior continues untilt∼400. Beginning at aboutt∼500 the perturbations in the current in the central CS grow to quite large amplitudes and the CS begins to bi-furcate with current disruptions extending alongx. The
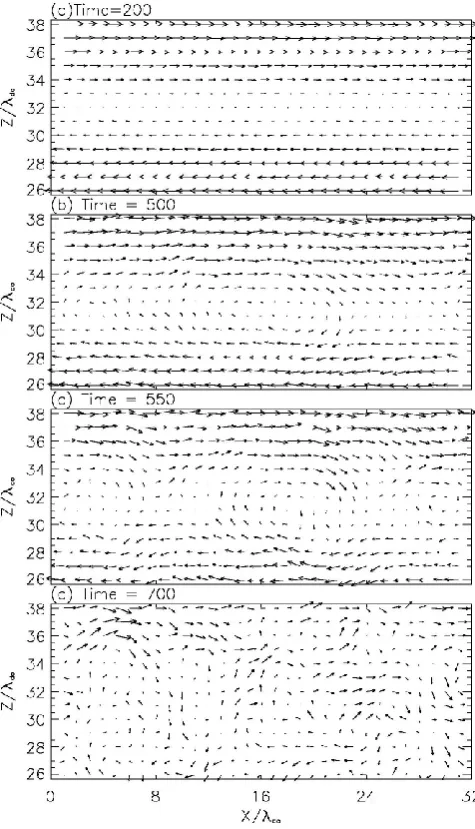
bi-Fig. 10. MFC resulting from magnetic reconnection: vector plots at (a)t=200, (b)t=500, (c)t=550 and (d)t=700. The arrows show the direction and their lengths show the relative magnitude of the magnetic field.
furcation is clearly evident from the surface plots fort >500, except for some patches of large currents. As discussed later, these patches are associated with magnetic turbulence. 5.2 Magnetic reconnection
Fig. 11.Jy(x, y=17, z)associated with the MFC in (a) Fig. 10a and (b) Fig. 10c. The patches of large currents in the CS att=550 are collocated with the magnetic loops in Fig. 10c.
Fig. 12. (a) Temporal evolution ofBz at (16, 17, 32) and (b) its Fourier spectrum. The oscillations inBz are at low frequencies, namely,ω/ωpe≤0.03, which is the ion cyclotron frequency with the magnetic fieldBo.
changes with the current. Figure 10c shows that att=550 MFC consists of two regions of connected fields with a loop in between. Figures 11a and b show the current structures as-sociated with the MFC in Figs. 10a and c, respectively. Fig-ure 11a shows that the original CS is nearly intact att=200. The fragmentation of the CS is seen att=550 in Fig. 11b; the loops in the magnetic field in Fig. 10c are collocated with peaks in the current distribution near the planez∼32. The
Fig. 13. Comparison of electron phase space inz−Vx(top),z−Vy (middle) and z−Vz (bottom) planes at t=50 (left panels) and t=550 (right panels). At the latter time electrons have undergone large accelerations; the largest accelerations occur in the central part of the current sheet.
temporal variability of Bz seen in the MFC after the onset of the magnetic reconnection is shown in Fig. 12a by plot-tingBz(16,16,32). The frequency spectrum of the data for 500< t <1000 is plotted in Fig. 12b, which shows that the oscillations are at low frequencies below the maximum ion cyclotron frequency (∼0.03) corresponding toBo=0.5. 5.3 Electron and ion acceleration
N. Singh: Instabilities in a thin current sheet and their consequences 161
Fig. 14. Same as Fig. 13, but for ions.
The symmetry of thez−Vy plot with respect toVy=0 near z∼32 att=550 implies that the current in the central region is disrupted as discussed earlier in connection with Fig. 9. In contrast to this, the asymmetry persists in the regions out side the central CS; in the outer region the current carrying elec-trons have net drifts in the negativeVy direction. The cold electron populations appearing nearz=0 andz=64 are the product of boundary condition; the electrons leaving the sim-ulation box atz=0 andz=64 are replaced by the initial cold population.
Thez−Vzplot att=550 shows that the accelerated elec-trons are flowing out of the central regions as revealed by the populations forVz>0 over 48< z <64 and forVz<0 over 0< z <16. Such an outflow along withx-directed outflows is a characteristic feature of magnetic reconnection. In our simulations thex-directed outflow is masked by the use of periodic boundary conditions on the particles atx=0 and x=Lx.
The ion phase space att=50 (right-hand panels, Fig. 14) do not show any noteworthy feature, except that ions are heated in the central region inVz as indicated byFi(Vz)in Fig. 3. All the three left-hand panels in Fig. 14 show that after the onset of reconnection ions have also undergone a considerable heating. The heating is again largest in the cen-tral CS. Like the electrons,z−Vzplot for the ions also show the outflow.
Figure 15 shows the time history of kinetic energy gain by electrons and ions. In this figure we have plotted av-erage energy of the electrons lying in a slice of plasma of thickness 1z=2, centered at z=32, extending over the entire x-y plane of the simulation. Since electrons reach relativistic velocities, the kinetic energy is calculated by W=(m−mo) xC2, where mo is the rest mass and m the mass at a velocityV. We find three stages of energy gain by
Fig. 15. Temporal behavior of the gain in kinetic energy of electrons and ions.
the electrons and ions. The first stage occurs with the CS for-mation; The application of the magnetic field to the plasma generates electric fieldEy, which accelerates electrons near z∼32 in they direction. Some of these electrons also show acceleration in thezdirection as a consequence of their cy-clotron motion in the anti-parallel magnetic field. These fea-tures are clearly shown by the distribution functions in Fig. 3 and the phase space plots in Fig. 13. In this phase the un-magnetized ions gain energy in theVzcomponent as seen in Figs. 3 and 14.
Next phase of energization is associated with the insta-bilities and the rate of energy gain is relatively small and it lost over 50< t <500. Soon after the magnetic reconnection begins, the heating rate increases as seen for t >550. The increase in the heating rate is caused by the induced elec-tric fields associated with the magnetic reconnection. Over a short span of time electrons are accelerated to energies sev-eral hundred times their initial energies. Ions are also accel-erated but to a lesser extent.
6 Anomalous resistivity
Dupree (1970) postulated a theoretical framework for anomalous resistivity in plasmas driven by applied electric fields. It involves formation of electron and ion clumps in-teracting as macro-particles via the fields generated by them. We already saw the clumping in Fig. 8. The interaction gives rise to a drag force on the electrons tantamount to an en-hanced plasma resistivity given by
Fig. 16. Anomalous resistivity determined using Eq. (3). The dotted-line curve shows the resistivity level given by the theory of Dupree (1970).
ηD∼0.01k λd(ωpeo)−1. In the early stage of the instability we havek λd∼kyλd∼0.6 andηD∼6×10⁻³(ωpeo)−1.
We measure the anomalous resistivity (η) in the simulation by the heating rate of the electrons given by
dWe/dt∼(1/2)η < Jey2(t ) > /ne(t ) (3) Using the plot forWe(t )in Fig. 15, and the average value of the electron current density and number densityne(t )near z=32, we have plottedη(t )in Fig. 16. For the purpose of comparison,ηD is also plotted. It is interesting to note that during the early stage of the ion-mode instability, the anoma-lous resistivity seen from the simulation agrees well with the theoretical value. But at later times the former exceeds the latter by orders of magnitude. We point out that although anomalous resistivity develops in the CS, it does not seem to play a central role in the CS electrodynamics as discussed in this paper. It is the shear driven explosive instability, which seems to play the dominant role. Only in the initial stage of the instability, the anomalous resistivity helps in initiating the onset of shear.
7 Conclusions and discussion
Our main purpose of this paper is to study the electrodynam-ics of a thin current sheet. Our simulations have revealed a rich set of processes including (i) excitation of waves by the current, (ii) partial current disruption by the waves in the cen-tral CS setting up sheared flow of the current-carrying elec-trons, (iii) shear-driven explosive waves, which further dis-rupt the current, (iv) patchy current disdis-ruptions causing mag-netic reconnection, (v) large heating of both electrons and ions, (vi) nearly complete bifurcation of the original CS and (vii) generation of anomalous resistivity of different levels in the course of the bifurcation of the CS.
We suggest that the initial instability, which occurs in the null magnetic field region and begins to disrupt the current, is likely to lead to the explosive stage by sowing the seed for
the initial shear. Lui et al. (1992) have studied a number of such so-called cross-field instabilities in connection with cur-rent disruptions in the geotail. These instabilities are modi-fied two-stream, Weibel and electron-acoustic modes with a small but non-zeroBzcomponent of the magnetic field in the neutral plane. Further studies are needed to determine the ef-fectiveness of these cross-field instabilities in initiating the shear formation.
For solar flare models it is suggested by Priest (1976) that whenVde exceedsVt e, the anomalous resistivity associated with the ion-acoustic modes diffuses the current and reduces the drift velocity and thus it does not induce magnetic con-nection. We find that diffusion does occur, but the generation of the shear by the local reduction of Vde near the neutral plane makes all the difference in driving the explosive insta-bility and hence magnetic reconnection and faster accelera-tions of electrons and ions.
Is it possible to have the large anti-parallel magnetic fields with sufficiently small scale lengths to yield a large electron drift to excite the Buneman or ion modes in laboratory and space plasmas? In the laboratory experiment of Baum and Bratenahl (1976) the electron drift reached or exceeded the electron thermal velocity near the so-called flash point. In a series of recent reports on EMHD simulations of magneto-tail Ma and Bhattacharjee (1999) have reported sudden im-pulsive increase in current densityJy by two orders of mag-nitude. Depending on local plasma temperature and den-sity, it is quite likely that Buneman threshold can be met in such events. Exceeding the initial threshold may also criti-cally depend on the composition of the plasma and temper-atures of the constituent electrons and ions. Presence of a cold plasma population in the neutral sheet region may sat-isfy the initial threshold and ignite the explosive instability. Thin current sheets are a consequence of continued forcing in MHD plasma flows as envisioned by Parker (1988) for the solar coronal heating. A systematic study incorporating MHD modeling of large-scale flows and PIC simulations of small-scale microphysics is needed to determine the various types of kinetic plasma processes, depending on the thick-ness of a current sheet as it evolves from a thick to thin sheet. It is important to point out that bifurcated current sheets have been observed in the magnetotail by Geotail (Hoshino, et al., 1996) and more recently by Cluster (Nakamura et al., 2003; Segeev et al., 2003). Sitnov et al. (2003) recently pro-posed a static model depending on pancake type anisotropy of ions. Our simulation shows that the explosive inflectional instability disrupts the current in the central CS and causes the bifurcation of the current sheet. In the region of the disrupted current the magnetic structure becomes complex consisting of evolving loops and reconnecting magnetic field lines. Such magnetic field structures are like those seen in MHD turbulence (Wu and Chang, 2000; Matthaeus et al., 2003).
N. Singh: Instabilities in a thin current sheet and their consequences 163 Buneman instability resulting in the energization of
elec-trons and ions. We find that initially accelerated elecelec-trons in the process of setting up the CS drive the Buneman-like ion mode instabilities, which generate a sheared flow of the current-carrying electrons. The shear-driven instabilities be-come explosive and drive a variety of processes including clumping of the plasma, magnetic reconnection, bifurcation of the CS, energization of electrons and ions, and generation of anomalous resistivity.
We point out that our simulations have the limitation of small mass ratioM/m. In future simulations, this limitation needs to be removed and our findings further verified. How-ever, we note that the Bunneman-like ion mode instability and its consequences are well known in plasma physics. A realistic mass scale is likely to increase the time scale of the evolution. Shear-driven instability is also a well-known one (Ganguli et al., 1988; Mikhailovskii, 1974). The significant contribution in this paper is to report that these instabilities could occur in thin CS and have important consequences for its electrodynamics.
Acknowledgements. Help from S. Saha in some of the early com-putational work and from N. Puthumbhakum in both computation and visualization are acknowledged. This work was performed under the support of NASA grant NAG5-13489.
Edited by: J. B¨uchner Reviewed by: two referees
References
Baum, P. J. and Bratenahl, A.: Laboratory solar flares experiment, Solar Phys., 47, 331, 1976.
Birdsall, C. K. and Langdon, A. B.: Plasma Physics via Computer Simulations, NY, McGraw-Hill, 1985.
Daughton, W.: The unstable Eigenmodes of neutral sheets, Phys. Plasmas, 6, 1329, 1999.
Drake, J. F., Swisdak, M., Cattell, C., Shay, M. A., Rogers, B. N., and Zeiler, A.: Formation of Electron Holes and Particle En-ergization During Magnetic Reconnection, Science, 299, 873, 2003.
Dupree, T. H.: Theory of resistivity in collisionless plasma, Phys. Rev. Lett., 25, 789, 1970.
Fried, B. D. and Gould, R. W.: Longitudinal ion oscillations in hot plasmas, Phys. Fluids, 4, 139, 1961.
Ganguli, G., Lee, Y. C., and Palmadesso, P. J.: Phys. Fluids, Electron-ion hybrid mode due to transverse shear, Phys. Fluids, 31, 823, 1988.
Harris, E. G.: On a plasma sheath separating regions of oppositely directed magnetic fields, Nuovo Cimento, 23, 1115, 1962. Hasegawa, A.: Plasma Instabilities and Nonlinear Effects, Berlin,
Springer-Verlag, 2, 34, 1975.
Hesse, M. and Birn, J.: Magnetic reconnection: Three-dimensional Aspects and onset in the magnetotail, IEEE Trans. Plasma Sci., 28, 1887, 2000.
Hesse, M., Birn, J., and Kuznetsova, M.: Collisionless magnetic re-connection: Electron processes and transport modeling, J. Geo-phys. Res., 106, 3721, 2001.
Hoshino, M., Nishida, A., Mukai, T., Saito, Y., and Yamamoto, T.: Structure of plasma sheet in magnetotail: double-peaked electric current sheet, J. Geophys. Res., 101, 24 775, 1996.
Kropotkin, A. P., Trubachev, O. O., and Lui, A. T. Y.: Nonlin-ear instability of the geomagnetotail current sheet combining the features of tearing and cross-field instabilities, J. Geophys. Res., 104, 371, 1999.
Langdon, A. B.: On enforcing Gauss’ law in electromagnetic particle-in-cell codes, Compt. Phys. Commun., 70, 447, 1992. Lui, A. T. Y.: Tutorial on geomagnetic storms and substorms, IEEE
Trans. Plasma Sci., 28, 1854, 2000.
Ma, Z. W. and Bhattachargee, A: Sudden disruption of a thin current sheet in collisionless Hall magnetohydrodynamics due to sec-ondary tearing and coalescence instability, Geophys. Res. Lett., 26, 3337, 1999.
Matthaeus, W. H., Mullan, D. J., Dmitruk, P., et al.: MHD turbu-lence and heating of the corona and solar wind, Nonl. Proc. Geo-phys. 10, 93, 2003.
Mikhailovskii, A. B.: Theory of Plasma Instabilities, Consultants Bureau, New York, 7, 141, 1974.
Nakamura, R., Baumjohann, W. Runov, A., et al.: Fast flow during sheet thinning, Geophys. Res. Lett., 29(23), 2140, doi:10.1029/2002GL016200, 2002.
Ozaki, M., Sato, T., Horiuchi, R., and Group, C. S.: Electro-magnetic instability and anomalous instability in a neutral sheet, Phys. Plasmas, 3, 2265, 1996.
Parker, E. N.: Nanoflares and the solar x-ray corona, Ap. J., 330, 474, 1988.
Priest, E. R.: Current sheet models of solar flares, Solar Phys., 47, 41, 1976.
Pritchett, P. L.: Geospace environment modeling magnetic recon-nection challenge: Simulation with a full particle electromag-netic code, J. Gephys. Res., 106, 3783, 2001.
Pritchett, P. L.: Particle-in-Cell simulations of magnetosphere elec-trodynamics, IEEE Trans. Plasma Sci., 28, 1976, 2000. Pritchett, P. L., Coroniti, F. V., and Decyk, V. K.: Three-dimensional
stability of thin quasi-neutral current sheets, J. Geophys. Res., 101, 27 413, 1996.
Romero, H. and Ganguli, G.: Nonlinear evolution of a strongly sheared cross-field plasma flow, Phys. Fluids B, 5, 3163, 1993. Saha, S. and Singh, N.: “Evolution of a plasma to the Harris
Equi-librium,” paper #SM21B-11, EOS Trans. AGU, Fall Meeting Suppl. Abstract SM21B-11, 1999.
Segeev, V., Runov, A, Baumjohann, W., et al.: Current sheet flap-ping motion and structure observed by Cluster, Geophys. Res Lett., 30(6), 1327, 2003.
Shay, M. A., Drake, J. F., Rogers, B. N., Denton, R. E.: Alfv´enic collisionless magnetic reconnection and the Hall term, J. Gephys. Res., 106, 3759, 2001.
Silin, I. and B¨uchner, J.: Kinetic Instabilities of thin current sheets: Results of two-and- one-half-dimensional Vlasov code simula-tions, Phys. Plasmas, 10, 1299, 2003a.
Silin, I. and B¨uchner, J.: Nonlinear instability of thin current sheets in antiparallel and guided magnetic fields, Phys. Plasmas, 10, 3561, 2003b.
Sitnov, M. I., Gujdar, P. N., and Swisdak, M.: A model of the bifur-cated current sheet, Geophys. Res. Lett., 30, 1721, 2003. Zeiler, A., Biskamp, D., Drake, J. F., Rogers, B. N., and