PRACTICAL LESSON "ANALYSIS OF DRINKING WATER" IN TEACHING "CHEMISTRY AND ENVIRONMENTAL PROTECTION" (IN THE 10TH GRADE)
Antoaneta A. Angelacheva
University of Plovdiv, Faculty of Chemistry, Chair of General and Inorganic Chemistry with Methodology of Chemistry Teaching
Abstract
In the article are being analyzed the results of pedagogical experiment for research of effectiveness of the practical lesson "Analysis of drinking water" in teaching the school subject "Chemistry and environmental protection" (in the 10th grade, specialized training). In appendix is presented the methodological development of the lesson which includes: aims and tasks of the lesson, questions and problems for preliminary preparation of students, chemical experiments for determination physical properties and chemical composition of drinking water.
Key words: environmental education, chemistry education, analysis of drinking water
1. INTRODUCTION
The presence of water is a basic prerequisite for the existence of life on a planet. The Earth is an example in this respect, as about 70% of the Earth's surface is covered with water. But this water is salty, and fresh water represents a very small portion (around 1%) of the total amount of water on Earth. Solving the problem of meeting the needs of people from drinking water is closely linked to ensuring its quality.
Knowledge about the organoleptic and physicochemical indicators for the quality of drinking water, skills for their experimental determination and attitudes towards the problem of water conservation in nature are components of students' ecological understanding. The major factor for its formation is the teaching of the natural sciences. A review of the curriculum on school subject "Chemistry and environmental protection" (in the 7th -12th grades) indicates that in the training in the 10th grade (specialized training) is presented the topic "Ecological problems of hydrosphere" (Bliznakov et al., 2002). In its studying is emphasized on the knowledge about presence of water in nature, sources of water pollution, methods for purification of wastewater and drinking water. In the presented Laboratory practicum is included practical lesson for testing the water hardness and for its softening. In order to enrich the system of ecological knowledge of students, to develop the system of skills (experimental, organizational and technical) and the system of ethics (ecological, moral) would be appropriate the students to learn and to explore other indicators of water quality. Step in this direction is the present work which presents a methodological development of the practical lesson "Analysis of drinking water" in teaching the school subject "Chemistry and environmental protection" (in the 10th grade, specialized training). In the article are described the results of a pedagogical experiment for study the influence of the lesson on students' cognitive results with an emphasis on their ecological culture.
It is necessary to specify that in the lesson is not realized a quantitative analysis of water, because the students do not have the necessary knowledge about analytical chemistry and skills for precise laboratory work. The students carry out a qualitative analysis of samples of drinking water from different sources and on the basis of the received results students make conclusions about its suitability for consumption.
2. RESEARCH METHODOLOGY
The aim of the experimental study is to obtain reliable data on the appropriateness of the developed practical lesson "Analysis of drinking water" (see Appendix) in teaching the school subject "Chemistry and environmental protection" in the 10th grade.
Object of the research are the students in the 10th grade, specialized training. The subject of the research are the students' cognitive results – knowledge, skills and attitudes towards the problem of quality of drinking water.
The experimental hypothesis is that the created practical lesson positively influences on development of the system of students' environmental knowledge and skills, and attitudes towards the environment. The hypothesis is based on the idea that the students mastering the system of knowledge, skills and attitudes towards the problem leads to a more active cognitive process while studying the subject of Chemistry.
Achievement the aim and verification the hypothesis of the research require application of suitable methods of scientific researches. Two relatively distinguished groups of methods are used: (a) methods of theoretical research – a critical analysis of the publications in the field of Methodology of Chemistry Teaching; modeling a variant of practical lesson for analysis of drinking water; (b) methods of empirical research – real pedagogical experiment, a questionnaire and testing.
3. DESCRIPTION OF THE RESEARCH
The variable which must be monitored and measured in the course of the experiment is determined on the basis of the pedagogical diagnostic researches (Bizhkov & Kraevski, 2007) and on the basis of our researches (Angelacheva & Gergova, 2011). Empirical data show that higher students' environmental culture correlates with a higher level of training of students. These findings are an argument to determine the training of students in chemistry as the dependent variable. To measure this variable the following criteria and indicators are used:
• Criterion knowledge (about the physical properties and chemical composition of drinking water) with indicators volume and deepness of knowledge.
• Criterion skills with indicators skills for application of knowledge in various cognitive situations and skills for planning and conducting safety experiments (for study physical and chemical properties of drinking water), for analysis of experimental results.
• Criterion attitudes towards the problem of the quality of drinking water with indicators awareness and intensity of the attitudes.
The selected criteria and indicators are used in the development of a criterion test. It is planned to examine to which extent the expected learning results (knowledge, skills and attitudes), fixed in the curricula of the 10th grade, have been achieved. The properties of the test are verified using a small sample of students in experimental education conditions. The test and the results of the statistical analysis of its properties will be presented in another article. The test is divided relatively into three subtests. Subtest 1 includes tasks from 1 to 4, by which is established the volume and the deepness of students' knowledge about physical and chemical properties of drinking water. Through tasks from 5 to 8 (subtest 2) is diagnosed the students' abilities to apply acquired knowledge in different situations, to plan and to perform chemical experiments observing technique for safe operation. The tasks in subtest 3 (tasks from 9 to 12) are used to diagnose not only the knowledge and skills of students about the educational content included in subtests 1 and 2, but also the attitude of the students towards the problem of quality of drinking water. In the three subtests the tasks are multiple choice questions or with free response. The evaluation of the tasks with multiple choice questions is with 1 point for each correct answer and 0 points for a wrong or unspecified answer. In the tasks with free response scores are determined depending on the complexity of the task and the completeness of the response.
For the purposes of the pedagogical experiment teaching is organized in two variants – an experimental and a control. The first version is associated with application of the developed practical lesson (an experimental group EG – 80 students). The second version follows the traditional training in school subject "Chemistry and environmental protection" in the 10th grade (a control group KG – 80 students). Both groups are aligned on the achievements of pupils in teaching chemistry through the preliminary test. Experimental study of the appropriateness of the developed practical lesson is carried out in two consecutive school years.
4. RESULTS AND DISCUSSION
The statistical analysis of the experimental results is carried out with the software product SPSS 13 (Manov, 2001). The data for the statistical parameters which characterize the training of students in the studied groups during the two years of the pedagogical experiment are presented in tables 1 and 2.
Table 1. Statistical variables that characterize
the training of students from the studied groups in the first year of the experiment
Statistical variables
KG EG
subtest 1 subtest 2 subtest 3 subtest 1 subtest 2 subtest 3 Number of
respondents (n)
80 80 80 80 80 80
Mean arithmetic values ( )
2.21 2.56 2.21 3.44 3.33 3,19
Variance (s2) 0.47 0.58 0.47 0.5 0,55 0.53 Standard
deviation (s)
0.69 0.76 0.69 0.74 0.74 0,73
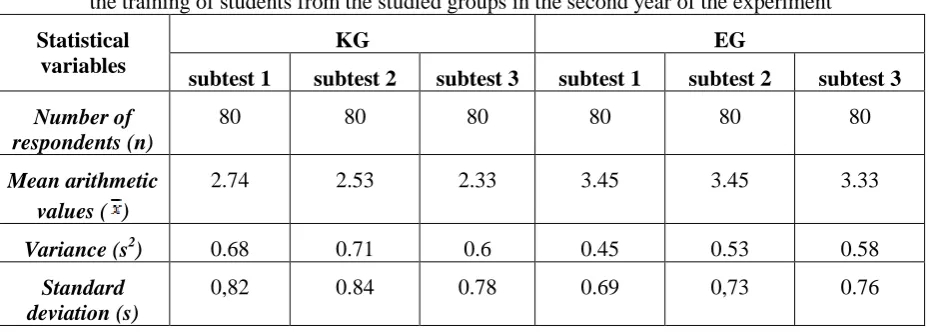
Table 2. Statistical variables that characterize
the training of students from the studied groups in the second year of the experiment
Statistical variables
KG EG
subtest 1 subtest 2 subtest 3 subtest 1 subtest 2 subtest 3 Number of
respondents (n)
80 80 80 80 80 80
Mean arithmetic values ( )
2.74 2.53 2.33 3.45 3.45 3.33
Variance (s2) 0.68 0.71 0.6 0.45 0.53 0.58 Standard
deviation (s)
0,82 0.84 0.78 0.69 0,73 0.76
Statistical processing and analysis of the experimental results are focused in solving the following question: Is there a difference between the distributions of random variables X and Y, which characterize the training of students in the experimental and in the control group? The answer of this question is related to empirical verification of the statistical hypotheses:
Hypothesis H0: The difference between the distributions of random variables X and Y in the studied groups is insubstantial.
Hypothesis H1: Between the distributions of random variables X and Y in the studied groups there is a significant difference.
The statistical hypotheses are tested with the quantity U which is recommended when independent samples are with large volume and belong to a normally distributed whole with equal variance (Manov, 2001). The criterion U is calculated with the formula (1):
U =x�– ys��nn1. n2
1+ n2 (1) where
, – the arithmetic means of the samples; n1, n2 – number of students in samples; s – the mean
weighted average of variance sx 2
, sy 2
.
Application of the quantity U requires to verify the condition for homogenous variance in the studied groups. The statistical hypotheses are:
Hypothesis H0: s1 2
= s2 2
There is no difference between the variances in the two samples. Hypothesis H1: s1
2≠ s 2
2
The variances in the two samples differ.
The testing quantity is the Fishers' criterion F, which is calculated with the formula (2):
F =s12 s22 (2)
where s12и s22аre the variances of the studied groups.
At the confidence level α = 0,01 the upper critical value is taken from the table, and the lower critical value is calculated with the formula (3):
(3).
For our case: 0,995F79,79 = 1,96; 0.005F79,79 = 0,51.
The experimental data for the criterion F are presented in table 3.
Table 3. Summary data from the statistical processing of the experimental results for the two years of the pedagogical experiment
First year of the experiment Second year of the experiment
Subtest 1 F = 1.06; U = 5,69 F = 1.51; U = 5,98 Subtest 2 F = 1,05; U = 6.49 F = 1.33; U = 7.36 Subtest 3 F = 1.13; U = 8,72 F = 1,03; U = 8,21
1−( / )α2
F
n1−1, n2−1( / ) ,
( / ) ,
α
α
2 1 1
1 2 1 1
1 2
1 2
1
F
F
n n
n n
− −
− − −
=
Since the calculated values of the criterion F are within the limits 0.005F79,79 < F < 0,995F79,79, can be
considered hypothesis H0: There is no statistically significant difference between variances of the experimental and the control groups of students in both years of the pedagogical experiment.
After both samples belong to populations with equal variances may apply the criterion U for establishing the difference between means. Statistical hypotheses are:
Hypothesis H0: µ1 = µ2 There is no difference between the means of both samples.
Hypothesis H1: µ1 ≠ µ2 The means of the samples are different.
At the confidence level = 0,01 the critical value is U = 2,58. The values of the criterion U (table 3), obtained from the statistical processing of the empirical data from testing in the control and in the experimental group in both years of the pedagogical experiment, are higher than the critical value of the quantity U. Therefore hypothesis H0 is rejected and is accepted the alternative hypothesis H1. The difference between the means of the results in the studied groups in both years of the pedagogical experiment is statistically significant. That is depend on application of the developed practical lesson in teaching the school subject "Chemistry and environmental protection" in the 10th grade.
Experimentally founded difference between the distribution of the random variables X and Y, which characterize the training of students in the studied groups, brings out the necessity of decision the following question: Is there a difference between the distribution of the random variables X and Y, which characterize the training of students in the experimental groups in both years of the pedagogical experiment? The answer of this question may prove the presence or absence of recurrence in the effect of the developed laboratory lesson.
The criterion χ2
is suitable for comparing the relative frequency of distribution of results obtained from independent samples, with two categories for measuring research mark (in this case "achieved" - "failing to achieve" the aims of the test). The statistical hypotheses are:
Hypothesis H0: p1 = p2 The relative frequency of distribution of the results in the studied groups is
equally probable in both years of the experiment.
Hypothesis H1: р1≠ р2 The relative frequency of distribution of the results in the studied groups has a
different probability in both years of the experiment.
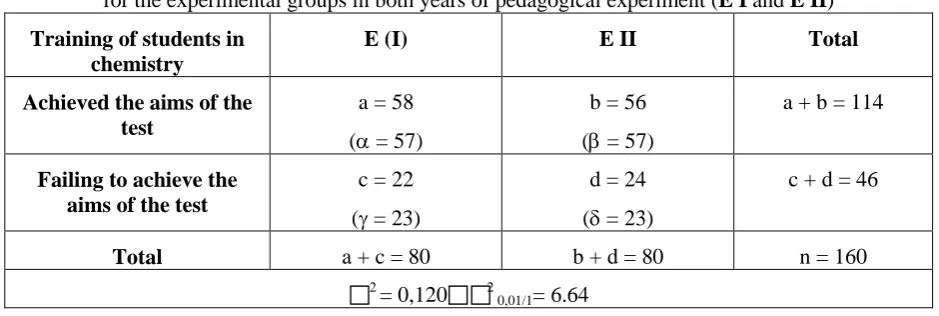
The application of the criterion χ2 requires the data for the studied groups to be performed in "table with four fields" (table 4).
Table 4. Frequency of distribution of the results of the test
for the experimental groups in both years of pedagogical experiment (E I and E II)
Training of students in chemistry
E (I) E II Total
Achieved the aims of the test
a = 58 (α = 57)
b = 56 (β = 57)
a + b = 114
Failing to achieve the aims of the test
c = 22 (γ = 23)
d = 24 (δ = 23)
c + d = 46
Total a + c = 80 b + d = 80 n = 160
2
= 0,1202
0,01/1= 6.64
In each of the four fields are entered the observed frequency of distribution of the results of the test – a, b, c, d, and the theoretical expected distributions – α, β, γ, δ, which are calculated with the formulas (4):
α= (a + b)(a + c)n ; β= (a + b)(b + d)n ; γ= (c + d)(a + c)n ; δ= (c + d)(b + d)n (4).
The criterion χ2
is calculated with the formula (5):
χ2=�(fbi– fei) fei k
i=1
(5) where
fbi – the observed frequencies (a, b, c and d); fei – the theoretical frequencies (α, β, γ and δ).
Empirical values of criterion χ2 compare with critical dimension χ2
0.01/1= 6,64.
Since χ2 χ2
0,01/1 is accepted hypothesis H0: The relative frequency of the distribution of the results of
the test in the experimental groups is similar in both years of the pedagogical experiment. It is not recorded a statistically significant difference in the level of learning achievements (measured in selected criteria and indicators) of students in the experimental groups. Therefore it can be assumed as empirically proven the thesis for repeatability in the effect of the developed lesson for optimization the cognitive activity of students through enrichment of students' environmental culture in teaching Chemistry in the 10th grade.
5. CONCLUSION
The empirical material obtained from pedagogical experiment give the basis to claim that the developed laboratory lesson is an effective form for organization of the training in Chemistry. It helps the in depth understanding of the learning content, stimulates the transfer of environmental knowledge and skills, fosters the criticality of thought and attitude towards the problems of environment.
ACKNOWLEDGEMENTS
The author would like to thank the Research Fund of the Plovdiv University for its financial support (contract NI 13 HF 006).
REFERENCES
Angelacheva, А. (2006). Methods and technique of experiment in chemistry teaching. Part I (in Bulgarian). Plovdiv University Press, Plovdiv.
Angelacheva, A. (2014). Chemistry – observations and experiments (in Bulgarian), Plovdiv University Press, Plovdiv.
Angelacheva, A. & Gergova E. (2011). Environmental education in teaching chemistry (in Bulgarian). Plovdiv University Press, Plovdiv.
Bizhkov, G. & Kraevski, V. (2007). Methodology and methods of pedagogical researches (in Bulgarian). Sofia University Press, Sofia.
Bliznakov, G., Boianova, L., Sokolova, A. & Ribarska, P. (2002). Chemistry and environmental protection 10th grade, specialized training (in Bulgarian). Anubis Publishing House, Sofia.
Ivanov, I. (2006). Bases of pedagogical diagnostics (in Bulgarian). Shumen University Press, Shumen. Lakurski, A. (1999). Mathematical and statistical methods in psychological and pedagogical researches (in Bulgarian). Softtreid Publishing House, Sofia.
Manov, A. (2001). Statistics with SPSS (in Bulgarian). Trakia-M Publishing House, Sofia.
Manev, S., Mihova, L., Zavkova, M., Lazarov, D. & Petrov, G. (2002). Chemistry and environmental protection 10th grade, specialized training (in Bulgarian). Prosveta Publishing House, Sofia.
Nasledov, А. (2012). Mathematical methods for psychological researches. Analysis and interpretation of data (in Russian). Rech Publishing House, Saint Petersburg.
Nikolova, L., Vasileva, A., Atanasova, A., Todorova, E. & Kolevska, S. (1990). Practical exercises in environmental chemistry (in Bulgarian). Prosveta Publishing House, Sofia.
Stoichev, D. (2007). Quantitative methods for modeling and diagnostics in the experimental pedagogy, psychology and sociology (in Bulgarian). Plovdiv University Press, Plovdiv.
APPENDIX
ANALYSIS OF DRINKING WATER (PRACTICAL LESSON) 1. Aims and tasks of the lesson
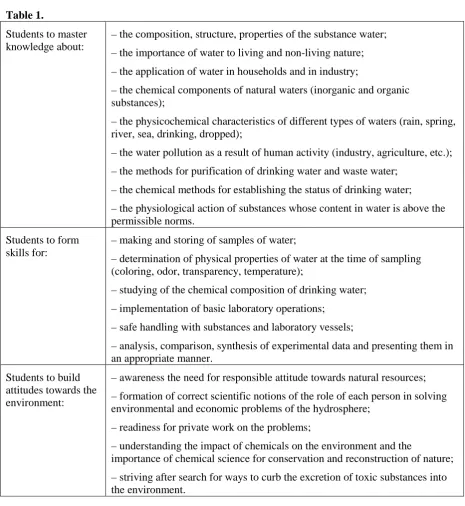
The main aim of laboratory lesson is linked to development students' environmental culture through enrichment of the system of environmental knowledge about the substance water, skills for experimental study of samples of water and attitudes towards the problem for protection of the water. In the context of this aim the more important tasks of the lesson are presented in table 1.
Table 1.
Students to master knowledge about:
– the composition, structure, properties of the substance water; – the importance of water to living and non-living nature; – the application of water in households and in industry;
– the chemical components of natural waters (inorganic and organic substances);
– the physicochemical characteristics of different types of waters (rain, spring, river, sea, drinking, dropped);
– the water pollution as a result of human activity (industry, agriculture, etc.); – the methods for purification of drinking water and waste water;
– the chemical methods for establishing the status of drinking water; – the physiological action of substances whose content in water is above the permissible norms.
Students to form skills for:
– making and storing of samples of water;
– determination of physical properties of water at the time of sampling (coloring, odor, transparency, temperature);
– studying of the chemical composition of drinking water; – implementation of basic laboratory operations;
– safe handling with substances and laboratory vessels;
– analysis, comparison, synthesis of experimental data and presenting them in an appropriate manner.
Students to build attitudes towards the environment:
– awareness the need for responsible attitude towards natural resources; – formation of correct scientific notions of the role of each person in solving environmental and economic problems of the hydrosphere;
– readiness for private work on the problems;
– understanding the impact of chemicals on the environment and the
importance of chemical science for conservation and reconstruction of nature; – striving after search for ways to curb the excretion of toxic substances into the environment.
2. Questions and tasks for the preliminary preparation
Investigate and explain what is the importance of water to living organisms. Indicate the reasons for the shortage of drinking water in some areas of Bulgaria.
Study the normative documents for the qualities of drinking water (BDS 2823-83).
What rules must be followed when taking samples of water and how these samples must be stored? What are the sources of water pollution in nature and what are the consequences of this for the living and non-living nature?
Inquire the methods for studying the physical and chemical qualities of drinking water. Prepare the necessary reagents and laboratory glassware for laboratory analyses in the course of practical lesson. Remind the rules for safe work with chemicals.
Investigate whether near your location has a wastewater treatment plant or laboratory for the control of waste and drinking water. Visit them.
3. Practical exercises 3.1. Sampling of water
When taking a sample of a water-main the water is allowed to flow for about 10 minutes. The container in which will store the sample is rinsed 2-3 times with the same water. The sample should be at least one liter capacity and store in a clean glass containers (it can be used plastic containers only if they do not attach an extra taste of the water). On them is noted the water source, the date and time of sampling. The containers store in refrigerator until the moment of its study.
3.2. Examination of physical properties of the drinking water
The physical properties of water (temperature, color, smell, transparency) are determined at the time of sampling. For reporting the temperature of water sample the thermometer is placed in the container for about 5 minutes in vertical position. During the recording of temperature the sample must be protected from warming and from direct sunlight. Water with temperature of 6-12C acts most refreshing. The drinking water should be colorless and transparent, without side taste and smell.
3.3. Examination of chemical composition of the drinking water Determination of chemical nature of the drinking water
The chemical nature of the water sample is determined with indicators – litmus paper, liquid universal indicator or etc. The pH of drinking water is 6,5-8,5.
Detection of potassium ions K+
Chemicals: 40 g sodium heksanitrokobaltat(III) Na3[Co(NO2)6] are dissolved into 100 cm3 water. Instructions: In a glass place 10 cm3 of the sample, add 3-4 drops of a solution of acetic acid CH3COOH (the chemical nature of the sample must have a pH = 4-5) and 5 cm3 from the reagent. The solution is shaken vigorously. The result of the experience is reported after 2-3 minutes. A yellow sediment is formed when the concentration of potassium ions K+ is over 0,1 mg/l; the solution is muddy when the concentration of potassium ions K+ is over 0,01 mg/l. The limit admissible concentration of potassium ions K+ in drinking water is 300 mg/l.
2К+
+ Na+ + [Co(NO2)6]3– → K2Na[Co(NO2)6]↓ Detection of calcium ions Ca2+
Chemicals: 35 g ammonium oxalate (NH4)2C2O4 are dissolved into water and the volume of the solution is brought up to 1000 cm3; 120 cm3 icy acetic acid CH3COOH are diluted with water to a volume of 1000 cm3.
Instructions: To 10 cm3 of the sample are added 3 cm3 solution of acetic acid CH3COOH and 8 cm3 solution of ammonium oxalate (NH4)2C2O4 The formation of a white sediment shows that the concentration of calcium ions Ca2+ in the sample is about 100 mg/l; if the solution is turbid, the concentration is over 1mg/l; if the solution opalescences, the concentration is over 0,01 mg/l. The limit admissible concentration of calcium ions Ca2+ in drinking water is 150 mg/l.
Са2+
+ C2O42– → СаC2O4↓ Detection of lead ions Pb2+
Chemicals: 10 g potassium chromate K2CrO4 are dissolved in 90 cm3 water.
Instructions: To 10 cm3 of the sample is added 1 cm3 of reagent and then is mixed. If a yellow sediment is formed, the concentration of lead ions Pb2+ is over 100 mg/l; if the solution is turbid, the concentration is over 20 mg/l; if the solution opalescences, the concentration is about 0,1 mg/l. The limit admissible concentration of lead ions Pb2+ in drinking water is 0,01 mg/l.
Pb2+ + CrO42– → PbCrO4↓ Detection of iron ions Fe3+
Chemicals: 20 g ammonium tiocinat NH4SCN are dissolved in water. Then the volume of the solution is brought up to 100 cm3; concentrated nitric acid HNO3; 5% solution of hydrogen peroxide H2O2. Instructions: To 10 cm3 of the sample is added 1 drop of concentrated nitric acid HNO3, 2-3 drops solution of hydrogen peroxide H2O2 and 0,5 cm3 solution of ammonium tiocinat NH4SCN. The appearance of pink coloring indicates that the concentration of iron ions Fe3+ in the sample is over 2 mg/l; red coloring – over 10 mg/l. The limit admissible concentration of iron ions Fe3+ in drinking water is 0,02 mg/l.
Fe3+ + 3SCN– → Fe(SCN)3 Detection of chloride ions Cl–
Chemicals: 5 g silver nitrate AgNO3 are dissolved in 95 cm3 water; solution of nitric acid HNO3 (1: 4).
Instructions: To 10 cm3 of the sample are added 3-4 drops solution of nitric acid HNO3 and 0,5 cm3 solution of silver nitrate AgNO3. The formation of a white sediment indicates that the concentration of chloride ions Cl– in the sample is over 100 mg/l; if the solution is turbid, the concentration is over 10 mg/l; if the solution opalescences, the concentration is over 1 mg/l. The limit admissible concentration of chloride ions Cl– in drinking water is 250 mg/l.
Ag+ + Cl– → AgCl↓
Detection of sulfate ions SO42–
Chemicals: 10 g barium chloride BaCl2.2H2O are dissolved in 90 cm3 water; 16 cm3 concentrated hydrochloric acid HCl are dissolved in water and the volume of the solution is brought up to 100 cm3. Instructions: To 10 cm3 of the sample are added 2-3 drops solution of hydrochloric acid HCl and 0,5 cm3 solution of barium chloride BaCl2.2H2O. The formation of a white sediment indicates that the concentration of sulfate ions SO42– in the sample is over 10 mg/l; if the solution opalescences, the concentration is over 1 mg/l. The limit admissible concentration of sulfate ions SO42– in drinking water is 250 mg/l.
Bа2+
+ SO42– → BаSO4↓
Detection of phosphate ions PO43–
Chemicals: 25 g ammonium molybdate (NH4)2MoO4 are dissolved in water and the volume of the solution is brought up to 1000 cm3; solution of nitric acid HNO3 (1:2); 56,4 g tin dichloride SnCl2.2H2O are dissolved in 25 cm3 concentrated hydrochloric acid HCl. The solution is diluted with water to 100 cm3. In the resulting solution are put bits of tin foil and is stored in tightly closed bank. Instructions: To 10 cm3 of the sample are added 3-4 drops solution of nitric acid HNO3, 2 cm3 solution of ammonium molybdate (NH4)2MoO4 and 6 drops solution of tin dichloride SnCl2. The solution turns blue when the concentration of phosphate ions PO43– is over 10 mg/l; azure – over 1 mg/l, pale blue – over 0,01 mg/l.
To prove the existence of phosphate ions PO43– in drinking water as reagent can be used solution of silver nitrate AgNO3 – it is formed a yellow sediment of silver phosphate Ag3PO4. The limit admissible concentration of phosphate ions PO43– in drinking water is 0,5 mg/l.
Detection of nitrate ions NO3–
Chemicals: 0,1 g diphenylamine (C6H5)2NH are dissolve in 10 cm3 concentrated sulfuric acid H2SO4. Instructions: To 1 cm3 of the sample are added drops of the reagent. Pale blue coloring is observed when the concentration of nitrate ions NO3– in the sample is over 0,001 mg/l; blue coloring – over 1 mg/l; dark blue coloring – over 100 mg/l. The limit admissible concentration of nitrate ions NO3– in drinking water is 50 mg/l.
Detection of nitrite ions NO2–
Instructions: In a conical flask are placed 10 cm3 of the sample and 0,5 cm3 Gris’ reagent. The solution is heated in a water bath at 70C for 5 minutes (or is left for 20 minutes at room temperature). The appearance of pink coloring indicates that the contents of the nitrite ions NO2– in the sample is 0,1-0,2 mg/l; deep pink coloring – 0,2-0,5 mg/l; red coloring – over 0,5 mg/l. The limit admissible concentration of nitrite ions NO2– in drinking water is 0,5 mg/l.
Detection of copper ions Cu2+
Chemicals: solution of concentrated ammonia NH3.
Instructions: In the cup are placed 3-5 cm3 of the sample and it is heated to a dry residue. On it are put 1-2 drops solution of concentrated ammonia NH3. The appearance of intense blue or violet coloring proves the presence of copper ions Cu2+ in the sample. The limit admissible concentration of copper ions Cu2+ in drinking water is 2,0 mg/l.
Cu2+ + 4NH4OH → [Cu(NH3)4]2+ + 4H2O